NZDCHF - Short from bearish order block ✅Hello traders!
‼️ This is my perspective on NZDCHF.
Technical analysis: As we can see here price changed the character and started to form lower lows and lower highs which means we are bearish, so I look for a short position if price makes a retracement to fill the imbalance higher and then rejects from bearish order block.
Fundamental news: On Thursday we will have news with high impact on CHF, we will see results of Interest Rate.
Like, comment and subscribe to be in touch with my content!
Nzdchfsetup

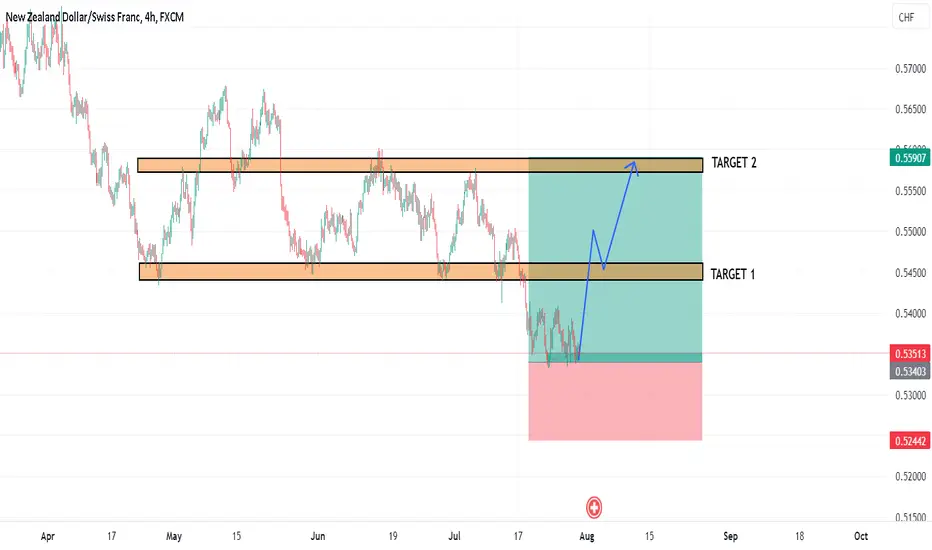
NZDCHF - Upside move ✅Hello traders!
‼️ This is my perspective on NZDCHF.
Technical analysis: Here we are in a bullish market structure from 4H timeframe perspective, so I am looking for a long. I expect bullish price action from here as price mitigated bullish order block and could reject from institutional big figure 0.54000.
Like, comment and subscribe to be in touch with my content!

NZDCHF Bullish Breakout! NZD-CHF broke out of
The falling channel pattern
And the breakout is confirmed
So we will be expecting
A further move up !

NZDCHF,🔴Sell opportunity🔴
NZDCHF reached the important supply zone formed as a bearish order block with FVG.
So we can expect the zone to reject the price.
We can study the price in the lower time frame for finding the trigger.
💡Wait for the update!
🗓️06/02/2024
🔎 DYOR
💌It is my honor to share your comments with me💌

NZD/CHF +50 Pips 0 Drawdown , New Entry & New Update Now 👌This Is An Educational + Analytic Content That Will Teach Why And How To Enter A Trade
Make Sure You Watch The Price Action Closely In Each Analysis As This Is A Very Important Part Of Our Method
Disclaimer : This Analysis Can Change At Anytime Without Notice And It Is Only For The Purpose Of Assisting Traders To Make Independent Investments Decisions.

NZD/CHF Ready For Sell To Give You 200 Pips For Free !This Is An Educational + Analytic Content That Will Teach Why And How To Enter A Trade
Make Sure You Watch The Price Action Closely In Each Analysis As This Is A Very Important Part Of Our Method
Disclaimer : This Analysis Can Change At Anytime Without Notice And It Is Only For The Purpose Of Assisting Traders To Make Independent Investments Decisions.

7 Dimension Analysis For NZDCHF 🕛 TOPDOWN - Navigating a Bearish Market with Strong CHF Dominance
Overview: CHF stands as a dominant force in the forex market, consistently overpowering NZD according to historical data. A crucial breakdown in the monthly structure, especially in August, has placed this pair in a post-breakout scenario for the past four months, signaling a looming substantial selloff. On the weekly chart, the market is in a bearish buildup, struggling to surpass previous high levels and experiencing rejection from a significant supply zone.
😇 7 Dimension Analysis
Time Frame: Daily
1️⃣ Swing Structure: Bearish
🟢 Structure Behavior: Break of Structure (BoS)
🟢 Swing Move: Initial Impulsive
🟢 Inducement: A noteworthy move from the point of interest, followed by a deep pullback completed with an Institutional Funded Candle (IFC).
🟢 Internal Structure: Liquidity sweep indicates a strong reversal. Extremes in overbought conditions have been mitigated, signaling a strong sell.
🟢 Resistance/Supply Areas: Multiple confluences, including resistance, supply, distribution, and premier, are aligned, suggesting a potent reversal zone.
2️⃣ Pattern
🟢 CHART PATTERNS
Descending Triangle: Signaling bearish continuation.
Shakeout Continuation: Supporting the bearish bias.
🟢 CANDLE PATTERNS
Key Observations:
Record session count with five consecutive bullish candles, ending with shrinking long wicks.
Inverted Hammer and gravestone Doji, indicating indecision and potential reversal.
Climax player activity is notable.
3️⃣ Volume Spread Analysis (VSA): Indicates a high number of sellers at the current point.
4️⃣ Momentum RSI:
🟢 Momentum State: Bullish to sideways.
🟢 Range Shift: Bullish to sideways with loud moves, suggesting a 90% likelihood of further downside.
🟢 Loud Moves: Completed their cycle, preparing for further downside.
🟢 Overbought Rejections: Count of 1.
🟢 Grandfather Father Son Entries: 50% probability setup.
5️⃣ Volatility Bollinger Bands:
🟢 Bands above the middle band.
🟢 Squeeze initiating volatility compression.
🟢 Head fake done with the upper band.
🟢 W pattern completed.
🟢 Band Puncher at the upper band, a powerful reversal signal.
6️⃣ Strength - ROC Values: Equal at the point.
✔️ Entry Time Frame: Daily
✅ Entry TF Structure: Bearish
☑️ Current Move: Impulsive
✔ Support/Resistance Base: Extreme OB rejection.
☑️ Candles Behavior: Bearish long wicks, gravestone Doji.
☑️ Trend Line Breakout: Awaiting confirmation.
☑️ Final Comments: Waiting for a sell signal.
💡 Decision: Short this pair upon tomorrow's open on trend line breakout and H1 churn.
🚀 Entry: 0.5375
✋ Stop Loss: 0.5529
🎯 Take Profit: 0.50
2nd Exit if Internal Structure Changes, 3rd Trendline Breakout, FOMO.
😊 Risk to Reward Ratio: 1:5
🕛 Expected Duration: 60 days
SUMMARY: The analysis maintains a bearish perspective, emphasizing potential for a substantial selloff. The strategy involves shorting the pair upon confirmation of a trend line breakout, with various indicators aligning to support the bearish bias. Considerations include multiple confluences at resistance areas and the completion of a W pattern at the upper Bollinger Band, reinforcing the expectation for a downward move.

NZDCHF I Bullish breakout and possibly headed toward resistanceWelcome back! Let me know your thoughts in the comments!
** NZDCHF Analysis - Listen to video!
We recommend that you keep this pair on your watchlist and enter when the entry criteria of your strategy is met.
Please support this idea with a LIKE and COMMENT if you find it useful and Click "Follow" on our profile if you'd like these trade ideas delivered straight to your email in the future.
Thanks for your continued support!

NZD/CHF! 6/12 Any opportunity to give DOWN prices?⭐️ Smart investment, Strong finance
⭐️ Personal comments NOVA:
The price continues to circle around the nearest resistance zone, today there is no news that will have too much impact. The price cannot break through this zone yet, NOVA will give a SELL signal here
⭐️ SET UP NZD/CHF PRICE:
🔥SELL zone: 0.54000 - 0.54150 SL 0.54600
TP1: 0.53700
TP2: 0.53400
TP3: 0.53000
⭐️ Technical analysis:
Based on technical indicators EMA 34, EMA89 and support resistance areas to set up a reasonable SELL order.
⭐️ NOTE:
Note: Nova wishes traders to manage their capital well
- take the number of lots that match your capital
- Takeprofit equal to 4-6% of capital account
- Stoplose equal to 2-3% of capital account
- The winner is the one who sticks with the market the longest

NZDCHFI am still expecting NZDCHF to make a new high thereby taking out the previous high. Now at current position, it making up its mind.

NZDCHF BUY | Day Trading Analysis With Volume ProfileHello Traders, here is the full analysis.
Watch strong action at the current levels for BUY. GOOD LUCK! Great BUY opportunity NZDCHF
I still did my best and this is the most likely count for me at the moment.
Support the idea with like and follow my profile TO SEE MORE.
Traders, if you liked this idea or if you have your own opinion about it, write in the comments. I will be glad 🤝
Patience is the If You Have Any Question, Feel Free To Ask 🤗
Just follow chart with idea and analysis and when you are ready come in THE GROVE | VIP GROUP, earn more and safe, wait for the signal at the right moment and make money with us💰

NZDCHF Long Term Buying Trading IdeaHello Traders
In This Chart NZDCHF HOURLY Forex Forecast By FOREX PLANET
today NZDCHF analysis 👆
🟢This Chart includes_ (NZDCHF market update)
🟢What is The Next Opportunity on NZDCHF Market
🟢how to Enter to the Valid Entry With Assurance Profit
This CHART is For Trader's that Want to Improve Their Technical Analysis Skills and Their Trading By Understanding How To Analyze The Market Using Multiple Timeframes and Understanding The Bigger Picture on the Charts

NZDCHF I Potential downside 100 pipsHello,Traders!
.
.
.
.
.
NZDCHF is trading in a downtrend on the daily and just broke
previous support 0.5300. It will likely head for the next support
level at 0.5200. Watch for any pullbacks to 0.5310 area. SHORT!
Trade safe and good luck!
Like, comment and subscribe to help us grow!
Check out other forecasts below too!

NZDCHF Long Term Selling Trading IdeaHello Traders
In This Chart NZDCHF HOURLY Forex Forecast By FOREX PLANET
today NZDCHF analysis 👆
🟢This Chart includes_ (NZDCHF market update)
🟢What is The Next Opportunity on NZDCHF Market
🟢how to Enter to the Valid Entry With Assurance Profit
This CHART is For Trader's that Want to Improve Their Technical Analysis Skills and Their Trading By Understanding How To Analyze The Market Using Multiple Timeframes and Understanding The Bigger Picture on the Charts

NZDCHF Long Term Buying Trading IdeaHello Traders
In This Chart NZDCHF HOURLY Forex Forecast By FOREX PLANET
today NZDCHF analysis 👆
🟢This Chart includes_ (NZDCHF market update)
🟢What is The Next Opportunity on NZDCHF Market
🟢how to Enter to the Valid Entry With Assurance Profit
This CHART is For Trader's that Want to Improve Their Technical Analysis Skills and Their Trading By Understanding How To Analyze The Market Using Multiple Timeframes and Understanding The Bigger Picture on the Charts

NZDCHF TradeAfter taken liqudity of the buyside and change of character and break of structure we will see a drop of the price to taken liquidity of the sellside we consider FVG an entry point
- Trading is probability control your risk management
Good luck

NZDCHF BUY STOPNZDCHF BUY STOP
Entry point :- 53500
Stop lose :- 53050
Target 1 :- 0.5395
Target 2 :- 0.5440
Target 3 :- 0.5485
Target 4 :- 0.5530
Target 5 :- 0.5575

NZDCHF: So easy with Sphyn analysis!At the start of the week, the GBPNZD exchange rate is experiencing a defensive stance, with potential gains expected in the following days. Although there is noticeable volatility, it remains constrained within a narrow range. This indicates that we can anticipate further trading activity between levels near 2.0910, reminiscent of highs from 2023, and recent lows approximately at 2.0500.

NZDCHF BULLISH SETUPNZDCHF
Entry point :- 0.54153
Stop lose :- 0.53338
Target 1 :- 0.5497
Target 2 :- 0.5578
Target 3 :- 0.5660
Target 4 :- 0.5741
Target 5 :- 0.5823

NZDCHF Long Term Buying Trading IdeaHello Traders
In This Chart NZDCHF DAILY Forex Forecast By FOREX PLANET
today NZDCHF analysis 👆
🟢This Chart includes_ (NZDCHF market update)
🟢What is The Next Opportunity on NZDCHF Market
🟢how to Enter to the Valid Entry With Assurance Profit
This CHART is For Trader's that Want to Improve Their Technical Analysis Skills and Their Trading By Understanding How To Analyze The Market Using Multiple Timeframes and Understanding The Bigger Picture on the Charts
NZDCHF TradeAfter taken liquidity o the buyside and change of character and beraker block we will see a drop of the price we consider Breaker block an entry point

NZD/CHF Creating Inverted H&S Pattern,Long Setup Will Be Valid ?This Is An Educational + Analytic Content That Will Teach Why And How To Enter A Trade
Make Sure You Watch The Price Action Closely In Each Analysis As This Is A Very Important Part Of Our Method
Disclaimer : This Analysis Can Change At Anytime Without Notice And It Is Only For The Purpose Of Assisting Traders To Make Independent Investments Decisions.
