NZDJPY “Kiwi Poised to Fly as Japan Muddles ThroughNZDJPY shows a bullish breakout from a descending trendline, with bullish structure holding near 87.20–87.25.
Key resistance targets:
87.97 (Previous high)
88.64 (Next resistance / projected fib target)
Two upside scenarios are shown:
Conservative target: ~87.97
Aggressive swing: ~88.64
If 87.00–87.20 zone holds as support, expect bullish continuation.
🧩 Current Bias: Bullish
📌 Key Fundamentals Driving NZDJPY
NZD Side (Strengthening):
RBNZ hawkish hold: RBNZ recently kept rates at 5.50% and warned that inflation remains persistent, requiring prolonged tight policy.
Resilient NZ GDP: Stronger-than-expected GDP print signals economic resilience.
Terms of trade improvement: Commodity exports holding firm, China consumption rebound showing hints of demand recovery (see recent 618 festival sales data).
AUD correlation: AUD and NZD are moving together; if AUD strengthens, NZD often follows.
JPY Side (Weakening):
BoJ remains ultra-dovish: Despite inflation trends, BoJ is hesitant to tighten further, preferring gradual tapering.
Yen under pressure from yield differentials: Global central banks (like RBNZ, Fed) remain hawkish while BoJ is not.
Geopolitical funding flows: JPY used as a funding currency amid global volatility (carry trade boost for NZDJPY).
⚠️ Risks That May Reverse the Trend
BoJ surprise tightening rhetoric (e.g. bond purchase taper announcement).
China data deterioration, hurting Kiwi sentiment.
Sharp equity sell-off and geopolitical escalation (Yen safe-haven reversal).
📅 Important News to Watch
🇳🇿 NZ Trade Balance (upcoming)
🇯🇵 Tokyo Core CPI (Jun 28) – Critical for BoJ policy speculation.
RBNZ or BoJ member speeches (hawkish or dovish shifts)
Fed tone shift or US dollar strength spillover
🏁 Who Leads the Move?
NZDJPY could lead among yen crosses due to the RBNZ’s clear inflation fight versus BoJ’s passive stance. NZDJPY is also more responsive to commodity and global risk-on flows than EURJPY or USDJPY.
Nzdjpy!!

NZD/JPY BEARS WILL DOMINATE THE MARKET|SHORT
Hello, Friends!
NZD/JPY pair is trading in a local uptrend which we know by looking at the previous 1W candle which is green. On the 1D timeframe the pair is going up too. The pair is overbought because the price is close to the upper band of the BB indicator. So we are looking to sell the pair with the upper BB line acting as resistance. The next target is 84.431 area.
Disclosure: I am part of Trade Nation's Influencer program and receive a monthly fee for using their TradingView charts in my analysis.
✅LIKE AND COMMENT MY IDEAS✅

NZDJPY Set To Grow! BUY!
My dear friends,
Please, find my technical outlook for NZDJPY below:
The instrument tests an important psychological level 86.740
Bias - Bullish
Technical Indicators: Supper Trend gives a precise Bullish signal, while Pivot Point HL predicts price changes and potential reversals in the market.
Target - 87.156
About Used Indicators:
Super-trend indicator is more useful in trending markets where there are clear uptrends and downtrends in price.
Disclosure: I am part of Trade Nation's Influencer program and receive a monthly fee for using their TradingView charts in my analysis.
———————————
WISH YOU ALL LUCK

NZD_JPY WILL KEEP GROWING|LONG|
✅NZD_JPY is trading along
The rising support line
And as the pair is going up now
After the retest of the line
I am expecting the price to keep growing
To retest the supply levels above at 87.429
LONG🚀
✅Like and subscribe to never miss a new idea!✅
Disclosure: I am part of Trade Nation's Influencer program and receive a monthly fee for using their TradingView charts in my analysis.

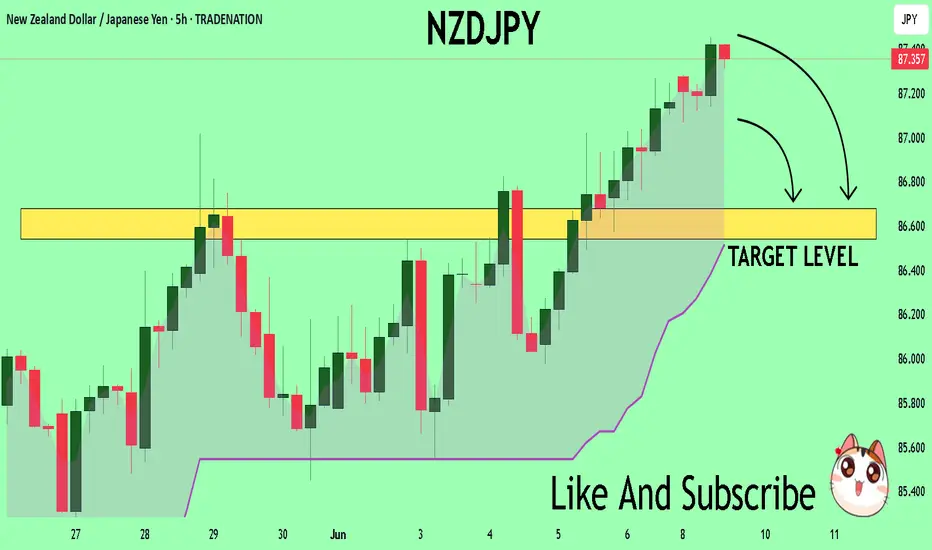
NZDJPY Potential UpsidesHey Traders, in today's trading session we are monitoring NZDJPY for a buying opportunity around 87.350 zone, NZDJPY is trading in an uptrend and currently is in a correction phase in which it is approaching the trend at 87.350 support and resistance area.
Trade safe, Joe.

SHORT ON NZD/JPYNZD/JPY has given us a CHOC (change or character) to the downside breaking a previous low.
I will be looking for NZD/JPY to retouch the supply area before dropping.
Aiming for 100-200 pips easy!

NZDJPY Under Pressure! SELL!
My dear followers,
This is my opinion on the NZDJPY next move:
The asset is approaching an important pivot point 87.365
Bias - Bearish
Technical Indicators: Supper Trend generates a clear short signal while Pivot Point HL is currently determining the overall Bearish trend of the market.
Goal - 86.678
About Used Indicators:
For more efficient signals, super-trend is used in combination with other indicators like Pivot Points.
Disclosure: I am part of Trade Nation's Influencer program and receive a monthly fee for using their TradingView charts in my analysis.
———————————
WISH YOU ALL LUCK
NZD_JPY BULLISH BREAKOUT|LONG|
✅NZD_JPY is trading in a
Local uptrend and the pair
Made a bullish breakout
Of the key horizontal level
Of 87.000 which is confirmed
So on Monday we will be
Expecting a further bullish
Move up after a potential
Local pullback
LONG🚀
✅Like and subscribe to never miss a new idea!✅
Disclosure: I am part of Trade Nation's Influencer program and receive a monthly fee for using their TradingView charts in my analysis.


NZD-JPY Will Go Down! Sell!
Hello,Traders!
NZD-JPY keeps growing
But will soon hit a horizontal
Resistance of 87.730 and as
The pair is locally overbought
So after the retest we will
Be expecting a local
Bearish correction
Sell!
Comment and subscribe to help us grow!
Check out other forecasts below too!
Disclosure: I am part of Trade Nation's Influencer program and receive a monthly fee for using their TradingView charts in my analysis.

NZD/JPY BEARS WILL DOMINATE THE MARKET|SHORT
Hello, Friends!
NZD-JPY uptrend evident from the last 1W green candle makes short trades more risky, but the current set-up targeting 86.881 area still presents a good opportunity for us to sell the pair because the resistance line is nearby and the BB upper band is close which indicates the overbought state of the NZD/JPY pair.
Disclosure: I am part of Trade Nation's Influencer program and receive a monthly fee for using their TradingView charts in my analysis.
✅LIKE AND COMMENT MY IDEAS✅

NZDJPY Is Going Up! Long!
Here is our detailed technical review for NZDJPY.
Time Frame: 12h
Current Trend: Bullish
Sentiment: Oversold (based on 7-period RSI)
Forecast: Bullish
The market is trading around a solid horizontal structure 86.992.
The above observations make me that the market will inevitably achieve 88.309 level.
P.S
Please, note that an oversold/overbought condition can last for a long time, and therefore being oversold/overbought doesn't mean a price rally will come soon, or at all.
Disclosure: I am part of Trade Nation's Influencer program and receive a monthly fee for using their TradingView charts in my analysis.
Like and subscribe and comment my ideas if you enjoy them!

NZDJPY: Short Trading Opportunity
NZDJPY
- Classic bearish pattern
- Our team expects retracement
SUGGESTED TRADE:
Swing Trade
Sell NZDJPY
Entry - 86.342
Stop - 86.782
Take - 85.565
Our Risk - 1%
Start protection of your profits from lower levels
Disclosure: I am part of Trade Nation's Influencer program and receive a monthly fee for using their TradingView charts in my analysis.
❤️ Please, support our work with like & comment! ❤️

NZDJPY to find sellers at previous resistance?NZDJPY - 24h expiry
Trading has been mixed and volatile. Price action looks to be forming a top. We look for a temporary move higher. Preferred trade is to sell into rallies. Bespoke resistance is located at 86.50.
We look to Sell at 86.50 (stop at 86.75)
Our profit targets will be 85.50 and 85.25
Resistance: 86.30 / 86.70 / 87.00
Support: 85.50 / 85.20 / 84.80
Risk Disclaimer
The trade ideas beyond this page are for informational purposes only and do not constitute investment advice or a solicitation to trade. This information is provided by Signal Centre, a third-party unaffiliated with OANDA, and is intended for general circulation only. OANDA does not guarantee the accuracy of this information and assumes no responsibilities for the information provided by the third party. The information does not take into account the specific investment objectives, financial situation, or particular needs of any particular person. You should take into account your specific investment objectives, financial situation, and particular needs before making a commitment to trade, including seeking advice from an independent financial adviser regarding the suitability of the investment, under a separate engagement, as you deem fit.
You accept that you assume all risks in independently viewing the contents and selecting a chosen strategy.
Where the research is distributed in Singapore to a person who is not an Accredited Investor, Expert Investor or an Institutional Investor, Oanda Asia Pacific Pte Ltd (“OAP“) accepts legal responsibility for the contents of the report to such persons only to the extent required by law. Singapore customers should contact OAP at 6579 8289 for matters arising from, or in connection with, the information/research distributed.

NZDJPY A Fall Expected! SELL!
My dear friends,
Please, find my technical outlook for NZDJPY below:
The price is coiling around a solid key level - 86.642
Bias - Bearish
Technical Indicators: Pivot Points Low anticipates a potential price reversal.
Super trend shows a clear sell, giving a perfect indicators' convergence.
Goal - 85.925
Safe Stop Loss - 87.013
About Used Indicators:
The pivot point itself is simply the average of the high, low and closing prices from the previous trading day.
Disclosure: I am part of Trade Nation's Influencer program and receive a monthly fee for using their TradingView charts in my analysis.
———————————
WISH YOU ALL LUCK

Bullish rise?NZD/JPY has reacted off the pivot and could potentially rise to the 1st resistance.
Pivot: 86.01
1st Support: 85.40
1st Resistance: 87.07
Risk Warning:
Trading Forex and CFDs carries a high level of risk to your capital and you should only trade with money you can afford to lose. Trading Forex and CFDs may not be suitable for all investors, so please ensure that you fully understand the risks involved and seek independent advice if necessary.
Disclaimer:
The above opinions given constitute general market commentary, and do not constitute the opinion or advice of IC Markets or any form of personal or investment advice.
Any opinions, news, research, analyses, prices, other information, or links to third-party sites contained on this website are provided on an "as-is" basis, are intended only to be informative, is not an advice nor a recommendation, nor research, or a record of our trading prices, or an offer of, or solicitation for a transaction in any financial instrument and thus should not be treated as such. The information provided does not involve any specific investment objectives, financial situation and needs of any specific person who may receive it. Please be aware, that past performance is not a reliable indicator of future performance and/or results. Past Performance or Forward-looking scenarios based upon the reasonable beliefs of the third-party provider are not a guarantee of future performance. Actual results may differ materially from those anticipated in forward-looking or past performance statements. IC Markets makes no representation or warranty and assumes no liability as to the accuracy or completeness of the information provided, nor any loss arising from any investment based on a recommendation, forecast or any information supplied by any third-party.

Bearish reversal?NZD/JPY is rising towards the pivot and could reverse to the 1st support.
Pivot: 86.38
1st Support: 84.37
1st Resistance: 87.07
Risk Warning:
Trading Forex and CFDs carries a high level of risk to your capital and you should only trade with money you can afford to lose. Trading Forex and CFDs may not be suitable for all investors, so please ensure that you fully understand the risks involved and seek independent advice if necessary.
Disclaimer:
The above opinions given constitute general market commentary, and do not constitute the opinion or advice of IC Markets or any form of personal or investment advice.
Any opinions, news, research, analyses, prices, other information, or links to third-party sites contained on this website are provided on an "as-is" basis, are intended only to be informative, is not an advice nor a recommendation, nor research, or a record of our trading prices, or an offer of, or solicitation for a transaction in any financial instrument and thus should not be treated as such. The information provided does not involve any specific investment objectives, financial situation and needs of any specific person who may receive it. Please be aware, that past performance is not a reliable indicator of future performance and/or results. Past Performance or Forward-looking scenarios based upon the reasonable beliefs of the third-party provider are not a guarantee of future performance. Actual results may differ materially from those anticipated in forward-looking or past performance statements. IC Markets makes no representation or warranty and assumes no liability as to the accuracy or completeness of the information provided, nor any loss arising from any investment based on a recommendation, forecast or any information supplied by any third-party.

Potential bearish drop?NZD/JPY is reacting off the resistance level which is a pullback resistance that aligns with the 50% Fibonacci retracement and could drop from this level to our take profit.
Entry: 86.13
Why we like it:
There is a pullback resistance level that lines up with the 50% Fibonacci retracement.
Stop loss: 87.09
Why we like it:
There is a pullback resistance level that lines up with the 78.6% Fibonacci retracement.
Take profit: 84.73
Why we like it:
There is a pullback support level.
Enjoying your TradingView experience? Review us!
Please be advised that the information presented on TradingView is provided to Vantage (‘Vantage Global Limited’, ‘we’) by a third-party provider (‘Everest Fortune Group’). Please be reminded that you are solely responsible for the trading decisions on your account. There is a very high degree of risk involved in trading. Any information and/or content is intended entirely for research, educational and informational purposes only and does not constitute investment or consultation advice or investment strategy. The information is not tailored to the investment needs of any specific person and therefore does not involve a consideration of any of the investment objectives, financial situation or needs of any viewer that may receive it. Kindly also note that past performance is not a reliable indicator of future results. Actual results may differ materially from those anticipated in forward-looking or past performance statements. We assume no liability as to the accuracy or completeness of any of the information and/or content provided herein and the Company cannot be held responsible for any omission, mistake nor for any loss or damage including without limitation to any loss of profit which may arise from reliance on any information supplied by Everest Fortune Group.

NZD/JPY BEARISH BIAS RIGHT NOW| SHORT
NZD/JPY SIGNAL
Trade Direction: short
Entry Level: 85.992
Target Level: 83.908
Stop Loss: 87.366
RISK PROFILE
Risk level: medium
Suggested risk: 1%
Timeframe: 1D
Disclosure: I am part of Trade Nation's Influencer program and receive a monthly fee for using their TradingView charts in my analysis.
✅LIKE AND COMMENT MY IDEAS✅

NZD/JPY "Kiwi vs Yen" Forex Bank Heist (Day Trade Plan)🌟Hi! Hola! Ola! Bonjour! Hallo! Marhaba!🌟
Dear Money Makers & Robbers, 🤑 💰💸✈️
Based on 🔥Thief Trading style technical and fundamental analysis🔥, here is our master plan to heist the NZD/JPY "Kiwi vs Yen" Forex Bank Heist. Please adhere to the strategy I've outlined in the chart, which emphasizes long entry. Our aim is to escape near the high-risk Yellow MA Zone. Risky level, overbought market, consolidation, trend reversal, trap at the level where traders and bearish robbers are stronger. 🏆💸"Take profit and treat yourself, traders. You deserve it!💪🏆🎉
Entry 📈 : "The heist is on! Wait for the Crossing previous high (86.000) then make your move - Bullish profits await!"
however I advise to Place Buy stop orders above the Moving average (or) Place buy limit orders within a 15 or 30 minute timeframe most recent or swing, low or high level for Pullback entries.
📌I strongly advise you to set an "alert (Alarm)" on your chart so you can see when the breakout entry occurs.
Stop Loss 🛑: "🔊 Yo, listen up! 🗣️ If you're lookin' to get in on a buy stop order, don't even think about settin' that stop loss till after the breakout 🚀. You feel me? Now, if you're smart, you'll place that stop loss where I told you to 📍, but if you're a rebel, you can put it wherever you like 🤪 - just don't say I didn't warn you ⚠️. You're playin' with fire 🔥, and it's your risk, not mine 👊."
📍 Thief SL placed at the nearest/swing low level Using the 30mins timeframe (84.800) Day trade basis.
📍 SL is based on your risk of the trade, lot size and how many multiple orders you have to take.
🏴☠️Target 🎯: 88.000
🧲Scalpers, take note 👀 : only scalp on the Long side. If you have a lot of money, you can go straight away; if not, you can join swing traders and carry out the robbery plan. Use trailing SL to safeguard your money 💰.
💰💵💸NZD/JPY "Kiwi vs Yen" Forex Bank Heist (Day Trade Plan) is currently experiencing a bullishness,., driven by several key factors. .☝☝☝
📰🗞️Get & Read the Fundamental, Macro Economics, COT Report, Quantitative Analysis, Sentimental Outlook, Intermarket Analysis, Future trend targets with overall score... go ahead to check 👉👉👉🔗🔗🔗
⚠️Trading Alert : News Releases and Position Management 📰🗞️🚫🚏
As a reminder, news releases can have a significant impact on market prices and volatility. To minimize potential losses and protect your running positions,
we recommend the following:
Avoid taking new trades during news releases
Use trailing stop-loss orders to protect your running positions and lock in profits
💖Supporting our robbery plan 💥Hit the Boost Button💥 will enable us to effortlessly make and steal money 💰💵. Boost the strength of our robbery team. Every day in this market make money with ease by using the Thief Trading Style.🏆💪🤝❤️🎉🚀
I'll see you soon with another heist plan, so stay tuned 🤑🐱👤🤗🤩

NZDJPY to continue in the downward move?NZDJPY - 24h expiry
The medium term bias remains bearish.
Short term RSI is moving higher.
We look for a temporary move higher.
Preferred trade is to sell into rallies.
Bespoke resistance is located at 85.25.
We look to Sell at 85.25 (stop at 85.55)
Our profit targets will be 84.20 and 84.00
Resistance: 85.25 / 85.70 / 86.10
Support: 84.60 / 84.20 / 84.00
Risk Disclaimer
The trade ideas beyond this page are for informational purposes only and do not constitute investment advice or a solicitation to trade. This information is provided by Signal Centre, a third-party unaffiliated with OANDA, and is intended for general circulation only. OANDA does not guarantee the accuracy of this information and assumes no responsibilities for the information provided by the third party. The information does not take into account the specific investment objectives, financial situation, or particular needs of any particular person. You should take into account your specific investment objectives, financial situation, and particular needs before making a commitment to trade, including seeking advice from an independent financial adviser regarding the suitability of the investment, under a separate engagement, as you deem fit.
You accept that you assume all risks in independently viewing the contents and selecting a chosen strategy.
Where the research is distributed in Singapore to a person who is not an Accredited Investor, Expert Investor or an Institutional Investor, Oanda Asia Pacific Pte Ltd (“OAP“) accepts legal responsibility for the contents of the report to such persons only to the extent required by law. Singapore customers should contact OAP at 6579 8289 for matters arising from, or in connection with, the information/research distributed.

NZDJPY: Long Signal with Entry/SL/TP
NZDJPY
- Classic bullish formation
- Our team expects growth
SUGGESTED TRADE:
Swing Trade
Buy NZDJPY
Entry Level - 84.918
Sl - 84.386
Tp - 85.905
Our Risk - 1%
Start protection of your profits from lower levels
Disclosure: I am part of Trade Nation's Influencer program and receive a monthly fee for using their TradingView charts in my analysis.
❤️ Please, support our work with like & comment! ❤️

NZD/JPY Breaks Wedge Structure – Bearish Setup Targets 82.42NZD/JPY has broken down from a rising wedge and failed to reclaim upper support, now acting as resistance. The structure is cleanly bearish on the 4H chart, with rejection near 85.60 and a confirmed lower high. Weak New Zealand data and rising safe-haven demand for JPY add weight to this technical setup. Price looks poised to extend toward 82.42 and possibly 80.99 if momentum builds. Bearish bias is valid unless price closes above 87.17.
🔍 Technical Analysis
Chart Pattern: Rising wedge → broken → retest failed
Bear Flag: Forming below wedge base, suggesting further downside
Resistance Area: 85.60–87.17
Bearish Structure:
Lower highs and bearish candle formations
Price unable to reclaim former support trendline
Support Targets:
First TP: 84.00 – minor support, fib confluence
Second TP: 82.42 – March swing low
Final TP: 81.00 zone – next fib cluster
🌍 Macro Fundamentals
🇳🇿 New Zealand Dollar (NZD)
Retail Sales missed: 0.0% vs 0.9% forecast → consumer sector is slowing
Core Retail Sales weak: 0.7% vs 1.4%
Dairy auction (GDT Index) down -0.9% → key export underperforming
Implication: Risk of slower growth → RBNZ may shift toward neutral/dovish stance
🇯🇵 Japanese Yen (JPY)
JPY supported by risk-off flows due to:
U.S. credit downgrade
Iran-US nuclear tension
Declining global PMI forecasts
Yen strengthens as traders seek safe havens despite BoJ’s dovish baseline
🎯 Trade Plan
Bias: Bearish
Entry Zone: 85.50–85.60 (confirmation area)
Targets:
TP1: 84.00
TP2: 82.42
TP3: 81.00
Stop Loss: Above 87.17 (invalidates wedge breakdown)
⚠️ What to Watch
China sentiment or surprise stimulus (may support NZD)
Sharp equity rallies (could reduce JPY demand short-term)
If NZD/JPY closes above 86.00, reduce position or stay out
🧭 Conclusion
NZD/JPY has rolled over from a broken rising wedge, now forming a clean bearish continuation structure. Weak NZ data and macro risk flows into JPY favor downside extension. This setup offers clear levels, defined risk, and macro alignment — ideal for disciplined short entries.
