NZDJPY - Zone to ZoneYesterday's collapse filled some of the imbalance from the strong move up.
We are now trading around a previous order block and showing signs of rejection, could this be signs of some bullish momentum prior to NFP?
Ideally, I would like to buy here to the higher OB but I will wait for further confirmation.
Nzdjpybreakout

Forex | NZD/JPY | How to trade with support and resistanceForex | NZD/JPY | How to trade with support and resistance
the complete analysis for nzdjpy


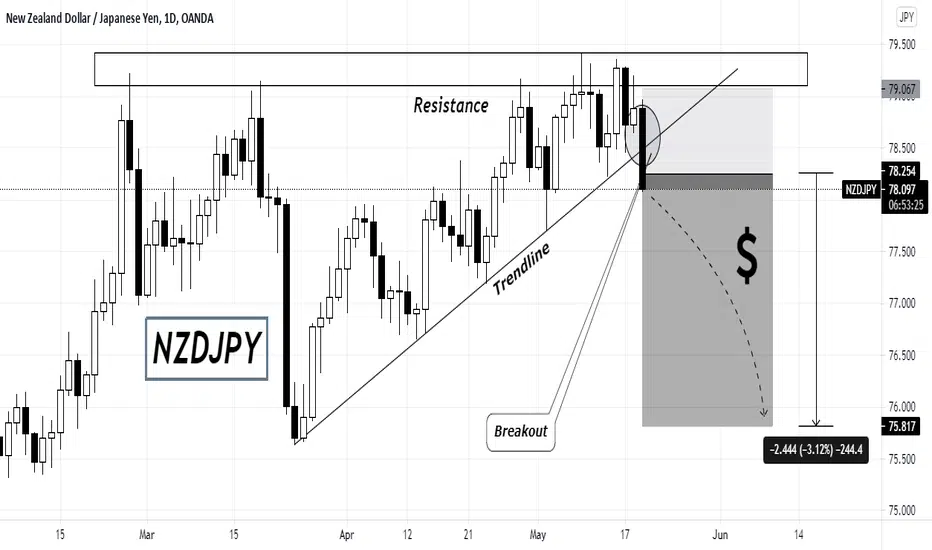
NZDJPY - Bearish Opportunities !Welcome to our Trade Setups - May 19th ( NZDJPY ) !
SELL NZDJPY
ENTRY LEVEL @ 78.254
SL @ 0.93325
TP @ 79.067
Max Risk: 1% - 3%!
Risk/Reward Ratio: 3
Leave us a comment or like to keep our content for free and alive.
Have a great week everyone!
NZDJPYHello Everyone, if you like the idea kindly support us with a like and follow Here is our update analysis for the NZDJPY pair on H4 timeframe Feel free to share your opinion Thank you & good luck


NZDJPY - Bullish Opportunities !Welcome to our Trade Setups - April 27th ( NZDJPY ) !
BUY NZDJPY
ENTRY LEVEL @ 78.479
SL @ 77.901
TP @ 79.346
Max Risk: 1% - 3%!
Risk/Reward Ratio: 2
Leave us a comment or like to keep our content for free and alive.
Have a great week everyone!

NZDJPY - Bullish Opportunities !Welcome to our Trade Setups - April 23th ( NZDJPY ) !
BUY NZDJPY
ENTRY LEVEL @ 77.563
SL @ 77.905
TP @ 77.392
Max Risk: 1% - 3%!
Risk/Reward Ratio: 2
Leave us a comment or like to keep our content for free and alive.
Have a great week everyone!

NZD/JPY Bullish Wave LTFHi Traders
NZD/JPY Signal (H4 Timeframe)
A high probability, entry to go LONG has formed @ 76.186 after the market found support @ 75.781. Only the downward break of 75.781 would cancel this bullish scenario.
Trade details
Entry: 76.186
Stop loss: 75.781
Take profit 1: 77.260
Take profit 2: 78.190
Take profit 3: 79.706
Score: 10
Strategy: Bullish Wave - LTF


NZDJPY, Breakout Ascending Channel, LongNZDJPY, Breakout Ascending Channel and has a very good Support! Watch out Friends!

NZDJPY SELLThis is NZDJPY 4H timeframe analysis, i'm expecting the market to start selling from where it is at a moment.


NZDJPY Break and retest cycle will it reach 2020 high ?NZDJPY
*********
⏳Day chart
🎲 Detailed analysis
⛳️Bullish entry
—————-❇️——————-
Detailed analysis 💬
1️⃣ Notable break and retest happens twice
2️⃣ 71.630 Multi month highs strong support
3️⃣ Positive risk sentiment, Vaccine news
4️⃣ 72.00 Dynamic support and resistance
5️⃣73.600 acted as strong resistance-Key trend reversal area
6️⃣ 70.110 50% Fibonacci will Acted as strong support/Point of control coincidence
7️⃣ Technical support - Bullish
8️⃣ 73.600 will acted as key reversal-bearish
9️⃣ 2020 High will act as alternative bearish entry-Double top formation
🔟 Possible swing target-73.600
#️⃣ Overall long-term trend- Bullish
—————-❇️——————-
📉 Technical bias-Day-Bullish
Price is above 50,100,200 Exponential moving average
50,100 Exponential moving average will act as support-Bullish
Relative strength index - well above 60 - Bullish trend
MACD -Histogram is slowly fading towards red, Oscillators about to cross soon
Stochastic - Reached around 75- overbought condition will give a short term fall back expected
Ichimoku cloud -cloud is still green-Price is well above the cloud
Bollinger band- Price reached around the upper side of the band-Short term bearish correction towards middle band was expected
—————-✳️——————-
Key reversal area's
70.000 psychological level
70.110Point of control area Volume analysis
71.670 June,July,August month highs
69.000 Lower side of the recent consolidation phase
73.000 Major psychological level
73.660 Possible entry- Bear
73.660 Trendline resistance/Alternative Bearish entry
—————-✳️——————-
Bearish entry #yen #kiwi #nzdjpy
Entry price - 72.150
Take profit 01 - 72.800
Take profit 02 - 73.600
🚫 Stop lose 71.200
⬆️ 2.00 Growth expected
⤴️ Account growth 1: 2
✅ Risk reward ratio 1 : 2
—————-⚜️——————-
Push the like button , And cheer up if you found useful


NZD/JPY Technical Analysis
The zone of 71.100-200 proves to be a tough nut for the pair.
Despite multiple attempts, the price is unable to break above it.
Further, the price action has formed an evening action star pattern at the resistance zone.
Hence, we expect the pair to be bearish in the near-term.

NZD/JPY - ForecastAs you can see NZD/JPY recently broke above the consolidation/Ranging level. and has RETESTED it.
Now we need to see if this was a fake breakout or it will actually continue in Buy.
if it comes back in the consolidation range then it was a fake breakout BUT if it breaks above the previous structure at around 71.950 then it should continue going up till next resistance level which is at around 73.45.
::
If you have a better idea or you disagree with me then please let me know in the comments
A Like would be appreciated.

NZDJPY LONG until next weekI will go long on NZDJPY because it just bounced on the support zone. It is safe now to go long on NZDJPY.
This is the best time to buy NZDJPY for next week bullish move. I think it will go up next week.
Trade At Your Own Risk ;)

NZD/JPY Wave Analysis
The counter is currently formed a flat ABC corrective wave.
It broke out from a bear flag pattern, tested the broken support, and is now coming down with strong momentum.
Hence, we expect the pair to be bearish in the near-term.


NZDJPY / SHORT IDEA / STILL BELIEVE THIS WILL TAKE A TUMBLEI believe this will take a big fall, price appears to be heading towards its previous high and is moving away from my key level
I am going to wait until price breaks this support zone and the trend line before selling
