NJ Buy opportunity With the short sell ending, NJ long-term buy looks like a good opportunity. Let me know your thoughts in the comments below.
Nzdjpybuy

NZDJPY - Final PushI want to see a final push into the previous resistance before we see continued downside.

NZDJPY Buy idea 💡 Entry details on the chartHey traders, here is the analysis for the NZDJPY. Let me know if you guys have any questions in the comment section. If you guys like my analysis please hit like. Thanks.
NOTE - Please do your own analysis before taking the trade.

NZDJPY Buy opportunityNJ bounced back since last week (hit last week's TP). Looking for another entry in this uptrend market.

NJ Buy OpportunityNZDJPY has been a bit choppy as of late, but there is a potential set up for a buy opportunity.


NZD/JPY Bullish Wave LTFHi Traders
NZD/JPY Signal (H4 Timeframe)
A high probability, entry to go LONG has formed @ 76.186 after the market found support @ 75.781. Only the downward break of 75.781 would cancel this bullish scenario.
Trade details
Entry: 76.186
Stop loss: 75.781
Take profit 1: 77.260
Take profit 2: 78.190
Take profit 3: 79.706
Score: 10
Strategy: Bullish Wave - LTF


NZDJPY, 1hr tf, buy setup at the end of wave-ivHello my friends,
Today i am gonna buy NZDJPY.
Previously i took sell order from 76.55 and closed it at 76.00 and banked +55 pips which yield 2.75R.
I didn't posted it on tradingview because i was not on my laptop when i took that trade.
So instead i will share the buy position today.
As you can see, price retrace towards 61.8 fibonacci retracement which also has a horizontal support level at 75.90.
Additonally there is 200-EMA at here as well so this place is an area of confluence support.
Buy NZDJPY 75.90
Stop loss 75.50
Take profit 77.20 (3.25R)
Use only 1-2% risk
Good luck


NZDJPY, Approaching strong support zone, longNZDJPY, Approaching strong support zone that respected many times!

NZDJPY, Break out Significant Support, longNZDJPY, Break out Significant Support and has bullish Momentum!

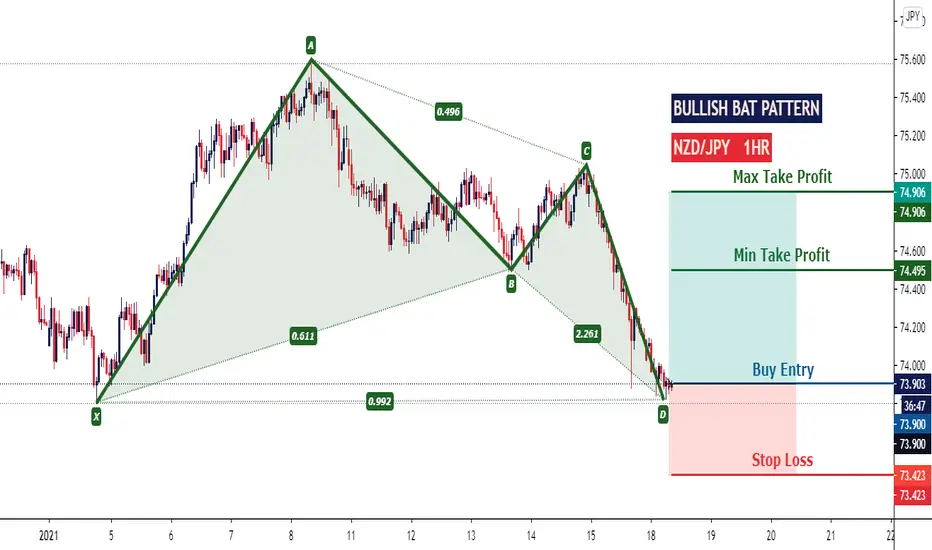
Bullish Bat PatternNZDJPY BULLISH BAT PATTERN
Market Buy Order Set Up.
Buy Entry: (73.900)
Min Take-Profit: (74.495)
Max Take-Profit: (74.906)
Stop-Loss: (73.423)
Max Risk-Reward: (2.11)
Smash a Like button and leave a Comment, I appreciate every support. Goodluck.
NZDJPY / LongI dont believe we are going to continue seeing a bullish move in the XXXJPY pairs.. Looking for rejections in this area

Bullish Shark PatternNZDJPY BULLISH SHARK PATTERN
Market Buy Order Set Up.
Buy Entry: (74.423)
Take-Profit 1: (74.737)
Take-Profit 2: (75.045)
Stop-Loss: (74.101)
Max Risk-Reward: (1.96)
Smash a Like button and leave a Comment, I appreciate every support. Goodluck.


NZDJPY 4HR BUYNZDJPY broke the high and we have seen a retracement back to the support so im expecting it to rise


NZDJPY Still BullishHi Traders,
NZDJPY is still bullish in my bias.
I have mentioned SL and TP levels.
Hope all the best.
Good Luck

NZDJPY, daily tf, bulls in control for nowHello my friends,
Another setup for next week is NZDJPY pairs.
As you can see NZDJPY pretty much bullish since breaking above the 5 months flag pattern.
For me, there is still further upside for this pair.
The measured objective of that 5 months flag pattern was around 800-900 pips in my opinion.
We could see NZDJPY continue to the upside until 76-77 area.
Long/Buy positons will be in favor for now and we will only look to buy this pair.
As you can see price right now consolidating inside a possible bullish continuation pattern right now.
This could be a pennant / flag pattern.
We will try taking a buy position at 73.35 area for our first buy position.
This 73.35 area is our horizontal support and possibly flag/pennat pattern support.
EMA-20 are also located near this area so pretty much it will be an area of confluences.
As price continue higher and make another pattern which is favorable for bulls, we will add more positions.
Buy limit NZDJPY 73.35
Stop loss 73.00
Take profit 75.65 (6.5 R)
RR Ratio 1 : 6.5
Use only 1-2% risk
Good luck


NZDJPY Break and retest cycle will it reach 2020 high ?NZDJPY
*********
⏳Day chart
🎲 Detailed analysis
⛳️Bullish entry
—————-❇️——————-
Detailed analysis 💬
1️⃣ Notable break and retest happens twice
2️⃣ 71.630 Multi month highs strong support
3️⃣ Positive risk sentiment, Vaccine news
4️⃣ 72.00 Dynamic support and resistance
5️⃣73.600 acted as strong resistance-Key trend reversal area
6️⃣ 70.110 50% Fibonacci will Acted as strong support/Point of control coincidence
7️⃣ Technical support - Bullish
8️⃣ 73.600 will acted as key reversal-bearish
9️⃣ 2020 High will act as alternative bearish entry-Double top formation
🔟 Possible swing target-73.600
#️⃣ Overall long-term trend- Bullish
—————-❇️——————-
📉 Technical bias-Day-Bullish
Price is above 50,100,200 Exponential moving average
50,100 Exponential moving average will act as support-Bullish
Relative strength index - well above 60 - Bullish trend
MACD -Histogram is slowly fading towards red, Oscillators about to cross soon
Stochastic - Reached around 75- overbought condition will give a short term fall back expected
Ichimoku cloud -cloud is still green-Price is well above the cloud
Bollinger band- Price reached around the upper side of the band-Short term bearish correction towards middle band was expected
—————-✳️——————-
Key reversal area's
70.000 psychological level
70.110Point of control area Volume analysis
71.670 June,July,August month highs
69.000 Lower side of the recent consolidation phase
73.000 Major psychological level
73.660 Possible entry- Bear
73.660 Trendline resistance/Alternative Bearish entry
—————-✳️——————-
Bearish entry #yen #kiwi #nzdjpy
Entry price - 72.150
Take profit 01 - 72.800
Take profit 02 - 73.600
🚫 Stop lose 71.200
⬆️ 2.00 Growth expected
⤴️ Account growth 1: 2
✅ Risk reward ratio 1 : 2
—————-⚜️——————-
Push the like button , And cheer up if you found useful
