NZD_USD LOCAL PULLBACK AHEAD|SHORT|
✅NZD_USD will soon retest a key resistance level of 0.6036
So I think that the pair will make a pullback
And go down to retest the demand level below at 0.6000
SHORT🔥
✅Like and subscribe to never miss a new idea!✅
Disclosure: I am part of Trade Nation's Influencer program and receive a monthly fee for using their TradingView charts in my analysis.
NZDUSD

New Zealand dollar steady ahead of employment dataThe New Zealand dollar is showing limited movement on Tuesday. In the European session, NZD/USD is trading at 0.5970, up 0.05% on the day. With no key events in New Zealand or the US today, we can expect a quiet day for the New Zealand dollar.
New Zealand releases the employment report for the first quarter on Wednesday. The labor market is showing signs of weakening, with employment change posting two straight declines.
The markets are projecting a slight improvement, with an estimate of 0.1% for Q1.
The unemployment rate has accelerated for seven consecutive quarters and is expected to rise to 5.3% from 5.1% in Q4 2025. This would be the highest level since Q4 2016 and would support the case for the Reserve Bank of New Zealand to lower rates for a sixth straight time at the May 28 meeting. At the April meeting, members warned that the tariffs created downside risks for growth and inflation in New Zealand.
The RBNZ would prefer to continue lowering interest rates in increments of 25-basis points in order to boost the weak economy. Inflation is comfortably within the 1-3% target band but there are upside risks to inflation, especially with global trade tensions escalating due to US tariffs.
In the US, the Federal Reserve is virtually certain to maintain interest rates at 4.25-4.5% on Wednesday. The meeting will be interesting as Fed Chair Powell is expected to push back against pressure from President Trump to lower rates. The Fed is likely to remain on the sidelines until the uncertainty over US tariffs becomes more clear. Trump's zig-zags over tariffs has triggered wild swings in the financial markets, but Trump has said some trade agreements will be announced soon.
NZD/USD is testing support at 0.5968. Below, there is support at 0.5940
There is resistance at 0.5995 and 0.6023

NZD-USD Short From Resistance! Sell!
Hello,Traders!
NZD-USD keeps growing
In an uptrend but the pair
Will soon hit a horizontal
Resistance of 0.6029 from
Where we will be expecting
A local bearish pullback
And a further move down
Sell!
Comment and subscribe to help us grow!
Check out other forecasts below too!
Disclosure: I am part of Trade Nation's Influencer program and receive a monthly fee for using their TradingView charts in my analysis.

NZDUSDOur previous trade was on **EURUSD**, and it’s just a few pips away from hitting the **Take Profit** level — even though I shared it only 5 minutes ago! 🙂
From a **correlation perspective**, I’ve identified a similar opportunity on **NZDUSD** in the same direction. That’s why I’ve opened a **Buy** trade on NZDUSD as well.
🔍 **Criteria:**
✔️ Timeframe: 15M
✔️ Risk-to-Reward Ratio: 1:1.50
✔️ Trade Direction: Buy
✔️ Entry Price: 0.59722
✔️ Take Profit: 0.59923
✔️ Stop Loss: 0.59588
🔔 **Disclaimer:** This is not financial advice. It's a trade I’m taking based on my own system, shared purely for educational purposes.
📌 If you're also interested in systematic and data-driven trading strategies:
💡 Don’t forget to follow the page and subscribe to stay updated on future analyses.

NZDUSD to continue in the upward move?NZDUSD - 24h expiry
Indecisive price action has resulted in sideways congestion on the intraday chart.
Momentum is flat, highlighting the lack of clear direction.
Risk/Reward would be poor to call a buy from current levels.
A move through 0.6000 will confirm the bullish momentum.
The measured move target is 0.6075.
We look to Buy at 0.5950 (stop at 0.5900)
Our profit targets will be 0.6050 and 0.6075
Resistance: 0.6000 / 0.6025 / 0.6050
Support: 0.5950 / 0.5925 / 0.5900
Risk Disclaimer
The trade ideas beyond this page are for informational purposes only and do not constitute investment advice or a solicitation to trade. This information is provided by Signal Centre, a third-party unaffiliated with OANDA, and is intended for general circulation only. OANDA does not guarantee the accuracy of this information and assumes no responsibilities for the information provided by the third party. The information does not take into account the specific investment objectives, financial situation, or particular needs of any particular person. You should take into account your specific investment objectives, financial situation, and particular needs before making a commitment to trade, including seeking advice from an independent financial adviser regarding the suitability of the investment, under a separate engagement, as you deem fit.
You accept that you assume all risks in independently viewing the contents and selecting a chosen strategy.
Where the research is distributed in Singapore to a person who is not an Accredited Investor, Expert Investor or an Institutional Investor, Oanda Asia Pacific Pte Ltd (“OAP“) accepts legal responsibility for the contents of the report to such persons only to the extent required by law. Singapore customers should contact OAP at 6579 8289 for matters arising from, or in connection with, the information/research distributed.

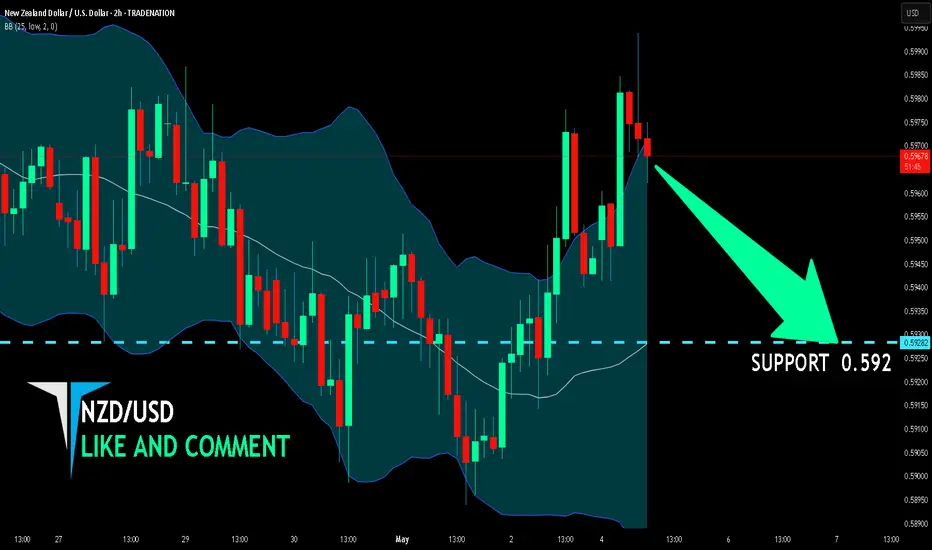
NZD/USD BEARISH BIAS RIGHT NOW| SHORT
Hello, Friends!
NZD/USD is trending down which is obvious from the red colour of the previous weekly candle. However, the price has locally surged into the overbought territory. Which can be told from its proximity to the BB upper band. Which presents a classical trend following opportunity for a short trade from the resistance line above towards the demand level of 0.592.
Disclosure: I am part of Trade Nation's Influencer program and receive a monthly fee for using their TradingView charts in my analysis.
✅LIKE AND COMMENT MY IDEAS✅
NZDUSD - LONG - Trade plan - 1hr TFNZD is fundamentally strong as compared to DXY according to last weeks data
its a buy call for NZDUSD, 1hr TF, Entry at 0.382(0.59464)
SL at 0.59149 (Major Support 0.58936)
TP 1= 0.59788
TP 2=0.60004
TP 3= 0.60298
Make your trade breakeven after TP 1 is hit,
Make your SL at TP1 when TP 2 is hit and so on.

Bullish bounce off pullback support?The Kiwi (NZD/USD) is falling towards the pivot and could bounce to the pullback resistance.
Pivot: 0.5818
1st Support: 0.5690
1st Resistance: 0.6025
Risk Warning:
Trading Forex and CFDs carries a high level of risk to your capital and you should only trade with money you can afford to lose. Trading Forex and CFDs may not be suitable for all investors, so please ensure that you fully understand the risks involved and seek independent advice if necessary.
Disclaimer:
The above opinions given constitute general market commentary, and do not constitute the opinion or advice of IC Markets or any form of personal or investment advice.
Any opinions, news, research, analyses, prices, other information, or links to third-party sites contained on this website are provided on an "as-is" basis, are intended only to be informative, is not an advice nor a recommendation, nor research, or a record of our trading prices, or an offer of, or solicitation for a transaction in any financial instrument and thus should not be treated as such. The information provided does not involve any specific investment objectives, financial situation and needs of any specific person who may receive it. Please be aware, that past performance is not a reliable indicator of future performance and/or results. Past Performance or Forward-looking scenarios based upon the reasonable beliefs of the third-party provider are not a guarantee of future performance. Actual results may differ materially from those anticipated in forward-looking or past performance statements. IC Markets makes no representation or warranty and assumes no liability as to the accuracy or completeness of the information provided, nor any loss arising from any investment based on a recommendation, forecast or any information supplied by any third-party.

Look To Sell USD and Buy EUR, GBP, NZD and AUD!This is the FOREX outlook for the week of May 5 - 9th.
In this video, we will analyze the following FX markets:
USD Index
EUR
GBP
AUD
NZD
CAD
CHF
JPY
USD Index has tapped the W -FVG. I expect it to sweep the last week's high before heading down. Short term strength for longer term weakness.
Look to buy xxxUSD pairs. Sell USDxxx pairs.
Wait for valid setups. FOMC is Wednesday! Don't just jump into trades without confirming the bias first!
Enjoy!
May profits be upon you.
Leave any questions or comments in the comment section.
I appreciate any feedback from my viewers!
Like and/or subscribe if you want more accurate analysis.
Thank you so much!
Disclaimer:
I do not provide personal investment advice and I am not a qualified licensed investment advisor.
All information found here, including any ideas, opinions, views, predictions, forecasts, commentaries, suggestions, expressed or implied herein, are for informational, entertainment or educational purposes only and should not be construed as personal investment advice. While the information provided is believed to be accurate, it may include errors or inaccuracies.
I will not and cannot be held liable for any actions you take as a result of anything you read here.
Conduct your own due diligence, or consult a licensed financial advisor or broker before making any and all investment decisions. Any investments, trades, speculations, or decisions made on the basis of any information found on this channel, expressed or implied herein, are committed at your own risk, financial or otherwise.

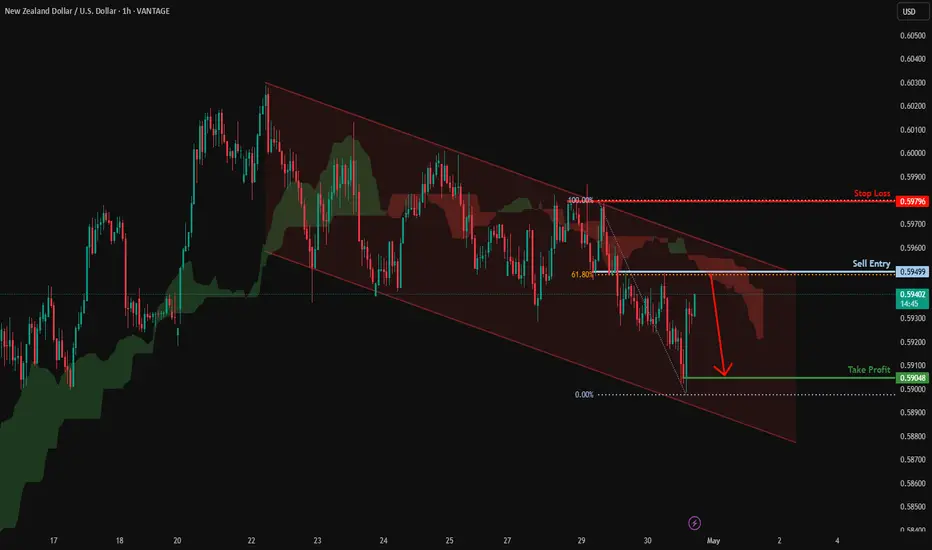
Kiwi H1 | Rising into an overlap resistanceThe Kiwi (NZD/USD) is rising towards an overlap resistance and could potentially reverse off this level to drop lower.
Sell entry is at 0.5946 which is an overlap resistance that aligns with the 38.2% Fibonacci retracement.
Stop loss is at 0.5995 which is a level that sits above the 61.8% Fibonacci retracement and a multi-swing-high resistance.
Take profit is at 0.5897 which is a multi-swing-low support.
High Risk Investment Warning
Trading Forex/CFDs on margin carries a high level of risk and may not be suitable for all investors. Leverage can work against you.
Stratos Markets Limited (tradu.com):
CFDs are complex instruments and come with a high risk of losing money rapidly due to leverage. 63% of retail investor accounts lose money when trading CFDs with this provider. You should consider whether you understand how CFDs work and whether you can afford to take the high risk of losing your money.
Stratos Europe Ltd (tradu.com):
CFDs are complex instruments and come with a high risk of losing money rapidly due to leverage. 63% of retail investor accounts lose money when trading CFDs with this provider. You should consider whether you understand how CFDs work and whether you can afford to take the high risk of losing your money.
Stratos Global LLC (tradu.com):
Losses can exceed deposits.
Please be advised that the information presented on TradingView is provided to Tradu (‘Company’, ‘we’) by a third-party provider (‘TFA Global Pte Ltd’). Please be reminded that you are solely responsible for the trading decisions on your account. There is a very high degree of risk involved in trading. Any information and/or content is intended entirely for research, educational and informational purposes only and does not constitute investment or consultation advice or investment strategy. The information is not tailored to the investment needs of any specific person and therefore does not involve a consideration of any of the investment objectives, financial situation or needs of any viewer that may receive it. Kindly also note that past performance is not a reliable indicator of future results. Actual results may differ materially from those anticipated in forward-looking or past performance statements. We assume no liability as to the accuracy or completeness of any of the information and/or content provided herein and the Company cannot be held responsible for any omission, mistake nor for any loss or damage including without limitation to any loss of profit which may arise from reliance on any information supplied by TFA Global Pte Ltd.
The speaker(s) is neither an employee, agent nor representative of Tradu and is therefore acting independently. The opinions given are their own, constitute general market commentary, and do not constitute the opinion or advice of Tradu or any form of personal or investment advice. Tradu neither endorses nor guarantees offerings of third-party speakers, nor is Tradu responsible for the content, veracity or opinions of third-party speakers, presenters or participants.

Potential bearish drop?NZD/USD is rising towards the resistance level which is an overlap resistance and could drop from this level to our take profit.
Entry: 0.5936
Why we like it:
There is an overlap resistance level.
Stop loss: 0.5997
Why we like it:
There is a pullback resistance level.
Take profit: 0.5829
Why we like it:
There is a pullback support level that aligns with the 38.2% Fibonacci retracement.
Enjoying your TradingView experience? Review us!
Please be advised that the information presented on TradingView is provided to Vantage (‘Vantage Global Limited’, ‘we’) by a third-party provider (‘Everest Fortune Group’). Please be reminded that you are solely responsible for the trading decisions on your account. There is a very high degree of risk involved in trading. Any information and/or content is intended entirely for research, educational and informational purposes only and does not constitute investment or consultation advice or investment strategy. The information is not tailored to the investment needs of any specific person and therefore does not involve a consideration of any of the investment objectives, financial situation or needs of any viewer that may receive it. Kindly also note that past performance is not a reliable indicator of future results. Actual results may differ materially from those anticipated in forward-looking or past performance statements. We assume no liability as to the accuracy or completeness of any of the information and/or content provided herein and the Company cannot be held responsible for any omission, mistake nor for any loss or damage including without limitation to any loss of profit which may arise from reliance on any information supplied by Everest Fortune Group.

NZDUSD: Market of Buyers
The analysis of the NZDUSD chart clearly shows us that the pair is finally about to go up due to the rising pressure from the buyers.
Disclosure: I am part of Trade Nation's Influencer program and receive a monthly fee for using their TradingView charts in my analysis.
❤️ Please, support our work with like & comment! ❤️

Buy nzdcadNZDCAD could start growing from here.The analysis is timed at 1 hour, so it requires patience to reach the goal.

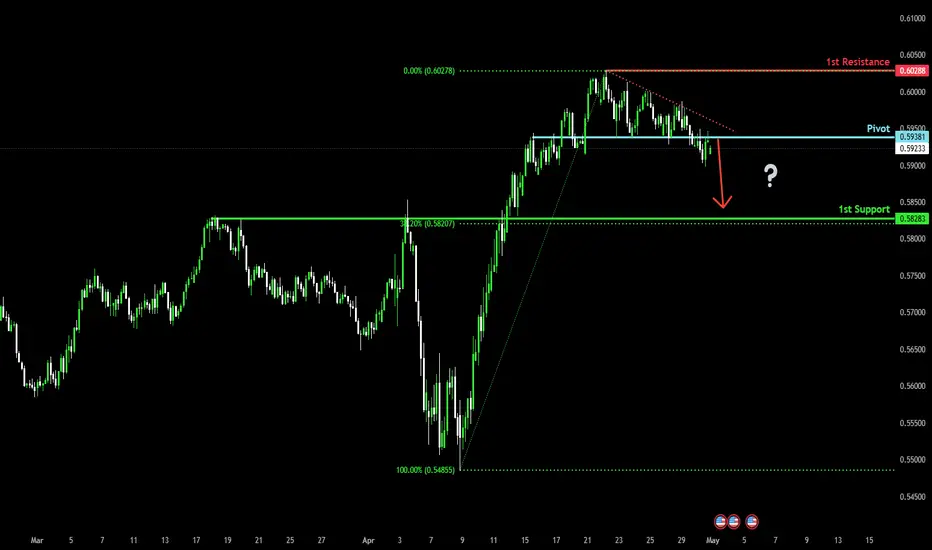
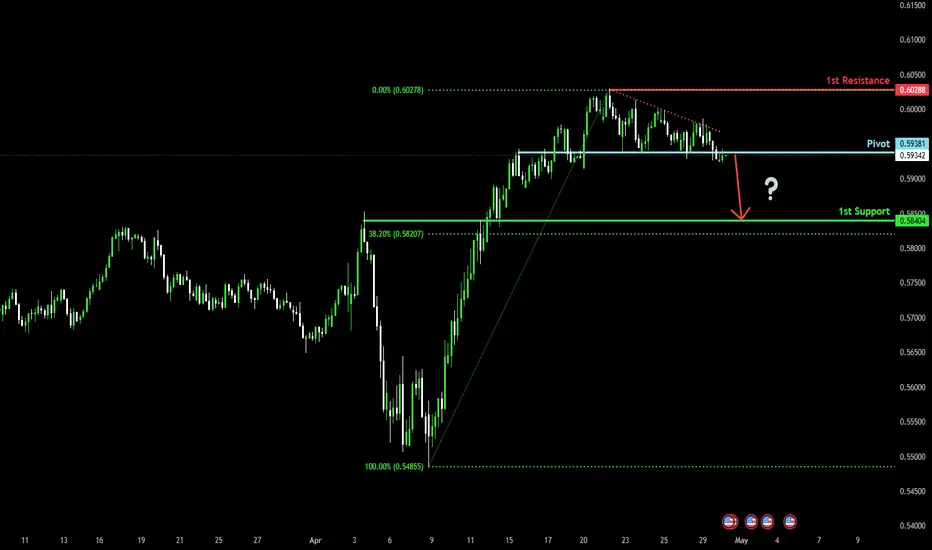
Bearish drop for the Kiwi?The price is reacting off the pivot and could drop to the 1st support which is a pullback support.
Pivot: 0.5938
1st Support: 0.5828
1st Resistance: 0.6028
Risk Warning:
Trading Forex and CFDs carries a high level of risk to your capital and you should only trade with money you can afford to lose. Trading Forex and CFDs may not be suitable for all investors, so please ensure that you fully understand the risks involved and seek independent advice if necessary.
Disclaimer:
The above opinions given constitute general market commentary, and do not constitute the opinion or advice of IC Markets or any form of personal or investment advice.
Any opinions, news, research, analyses, prices, other information, or links to third-party sites contained on this website are provided on an "as-is" basis, are intended only to be informative, is not an advice nor a recommendation, nor research, or a record of our trading prices, or an offer of, or solicitation for a transaction in any financial instrument and thus should not be treated as such. The information provided does not involve any specific investment objectives, financial situation and needs of any specific person who may receive it. Please be aware, that past performance is not a reliable indicator of future performance and/or results. Past Performance or Forward-looking scenarios based upon the reasonable beliefs of the third-party provider are not a guarantee of future performance. Actual results may differ materially from those anticipated in forward-looking or past performance statements. IC Markets makes no representation or warranty and assumes no liability as to the accuracy or completeness of the information provided, nor any loss arising from any investment based on a recommendation, forecast or any information supplied by any third-party.
Bearish reversal off 61.8% Fibonacci resistance?NZD/USD is rising towards the resistance level which is an overlap resistance that lines up with the 61.8% Fibonacci retracement and could reverse from this level to our take profit.
Entry: 0.5949
Why we like it:
There is an overlap resistance that lines up with the 61.8% Fibonacci retracement.
Stop loss: 0.5979
Why we like it:
There is a pullback resistance level.
Take profit: 0.5904
Why we like it:
There is a pullback support level.
Enjoying your TradingView experience? Review us!
Please be advised that the information presented on TradingView is provided to Vantage (‘Vantage Global Limited’, ‘we’) by a third-party provider (‘Everest Fortune Group’). Please be reminded that you are solely responsible for the trading decisions on your account. There is a very high degree of risk involved in trading. Any information and/or content is intended entirely for research, educational and informational purposes only and does not constitute investment or consultation advice or investment strategy. The information is not tailored to the investment needs of any specific person and therefore does not involve a consideration of any of the investment objectives, financial situation or needs of any viewer that may receive it. Kindly also note that past performance is not a reliable indicator of future results. Actual results may differ materially from those anticipated in forward-looking or past performance statements. We assume no liability as to the accuracy or completeness of any of the information and/or content provided herein and the Company cannot be held responsible for any omission, mistake nor for any loss or damage including without limitation to any loss of profit which may arise from reliance on any information supplied by Everest Fortune Group.
NZDUSD Will Go Down From Resistance! Short!
Here is our detailed technical review for NZDUSD.
Time Frame: 1D
Current Trend: Bearish
Sentiment: Overbought (based on 7-period RSI)
Forecast: Bearish
The market is trading around a solid horizontal structure 0.592.
The above observations make me that the market will inevitably achieve 0.580 level.
P.S
Please, note that an oversold/overbought condition can last for a long time, and therefore being oversold/overbought doesn't mean a price rally will come soon, or at all.
Disclosure: I am part of Trade Nation's Influencer program and receive a monthly fee for using their TradingView charts in my analysis.
Like and subscribe and comment my ideas if you enjoy them!

Potential bearish drop?The Kiwi (NZD/USD) is reacting off the pivot which is a pullback resistance and could drop to the 1st support which acts as a pullback support.
Pivot: 0.5938
1st Support: 0.5840
1st Resistance: 0.6028
Risk Warning:
Trading Forex and CFDs carries a high level of risk to your capital and you should only trade with money you can afford to lose. Trading Forex and CFDs may not be suitable for all investors, so please ensure that you fully understand the risks involved and seek independent advice if necessary.
Disclaimer:
The above opinions given constitute general market commentary, and do not constitute the opinion or advice of IC Markets or any form of personal or investment advice.
Any opinions, news, research, analyses, prices, other information, or links to third-party sites contained on this website are provided on an "as-is" basis, are intended only to be informative, is not an advice nor a recommendation, nor research, or a record of our trading prices, or an offer of, or solicitation for a transaction in any financial instrument and thus should not be treated as such. The information provided does not involve any specific investment objectives, financial situation and needs of any specific person who may receive it. Please be aware, that past performance is not a reliable indicator of future performance and/or results. Past Performance or Forward-looking scenarios based upon the reasonable beliefs of the third-party provider are not a guarantee of future performance. Actual results may differ materially from those anticipated in forward-looking or past performance statements. IC Markets makes no representation or warranty and assumes no liability as to the accuracy or completeness of the information provided, nor any loss arising from any investment based on a recommendation, forecast or any information supplied by any third-party.
NZD_USD REBOUND AHEAD|LONG|
✅NZD_USD is trading in an
Uptrend and the pair is making
A local correction in a way
Which also resembles a bullish
Wedge so after the retest of the
Horizontal support around 0.5917
A local bullish rebound
Is to be expected
LONG🚀
✅Like and subscribe to never miss a new idea!✅
Disclosure: I am part of Trade Nation's Influencer program and receive a monthly fee for using their TradingView charts in my analysis.

NZD-USD Long From Support! Buy!
Hello,Traders!
NZD-USD is making a local
Bearish correction but will
Soon hit a horizontal support
Around 0.5915 from where
We will be expecting a
Local bullish rebound
Buy!
Comment and subscribe to help us grow!
Check out other forecasts below too!
Disclosure: I am part of Trade Nation's Influencer program and receive a monthly fee for using their TradingView charts in my analysis.

NZD/USD Recovery Stalls Ahead of November HighThe recovery in NZD/USD seems to have stalled ahead of the November high (0.6038) as it gives back the advance from the start of the week.
In turn, a move/close below the 0.5920 (61.8% Fibonacci extension) to 0.5930 (78.6% Fibonacci extension) region may push NZD/USD towards the 0.5740 (78.6% Fibonacci retracement) to 0.5760 (100% Fibonacci extension) zone, with the next area of interest coming in around the 2020 low (0.5470).
At the same time, a breach above the November high (0.6038) brings 0.6070 (61.8% Fibonacci extension) on the radar, with the next region of interest coming in around 0.6170 (50% Fibonacci extension).
--- Written by David Song, Senior Strategist at FOREX.com

NZDUSD: Bullish Forecast & Bullish Scenario
The recent price action on the NZDUSD pair was keeping me on the fence, however, my bias is slowly but surely changing into the bullish one and I think we will see the price go up.
Disclosure: I am part of Trade Nation's Influencer program and receive a monthly fee for using their TradingView charts in my analysis.
❤️ Please, support our work with like & comment! ❤️

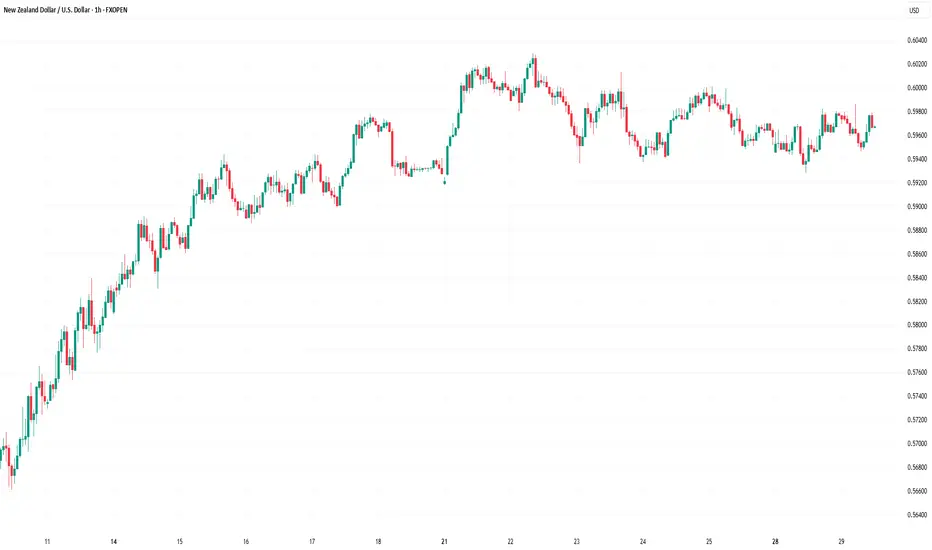
Market Analysis: NZD/USD DipsMarket Analysis: NZD/USD Dips
NZD/USD is trimming gains and struggling to stay above the 0.5945 pivot zone.
Important Takeaways for NZD/USD Analysis Today
- NZD/USD is declining from the 0.6030 resistance zone.
- There is a major bearish trend line forming with resistance near 0.5970 on the hourly chart of NZD/USD at FXOpen.
NZD/USD Technical Analysis
On the hourly chart of NZD/USD on FXOpen, the pair attempted another wave above the 0.6000 zone but failed. The New Zealand Dollar started another downward move from 0.6000 and dipped below 0.5980 against the US Dollar.
The pair settled below the 0.5970 level and the 50-hour simple moving average. It tested the 0.5930 zone and is currently consolidating losses near the 50% Fib retracement level of the downward move from the 0.6000 swing high to the 0.5928 low.
The NZD/USD chart suggests that the RSI is now well below 50 and signaling more downsides. On the downside, there is major support forming near 0.5945.
The next major support is near the 0.5920 level. If there is a downside break below the 0.5920 support, the pair might slide toward the 0.5880 support. Any more losses could lead NZD/USD in a bearish zone to 0.5840.
On the upside, the pair might struggle near 0.5970 and the 61.8% Fib retracement level of the downward move from the 0.6000 swing high to the 0.5928 low.
There is also a major bearish trend line forming with resistance near 0.5970. The next major resistance is near the 0.5985 level. A clear move above the 0.5985 level might even push the pair toward the 0.6000 level. Any more gains might clear the path for a move toward the 0.6030 resistance zone in the coming days.
This article represents the opinion of the Companies operating under the FXOpen brand only. It is not to be construed as an offer, solicitation, or recommendation with respect to products and services provided by the Companies operating under the FXOpen brand, nor is it to be considered financial advice.