Market Analysis: NZD/USD SlipsMarket Analysis: NZD/USD Slips
NZD/USD is struggling and might decline below the 0.5980 level.
Important Takeaways for NZD/USD Analysis Today
- NZD/USD is consolidating above the 0.5980 support.
- There is a connecting bearish trend line forming with resistance at 0.6010 on the hourly chart of NZD/USD at FXOpen.
NZD/USD Technical Analysis
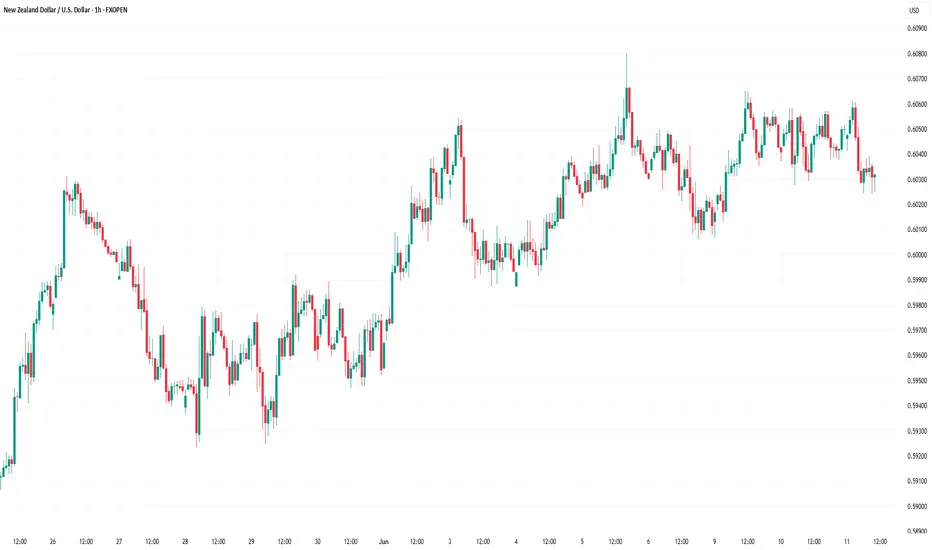
On the hourly chart of NZD/USD at FXOpen, the pair also followed AUD/USD. The New Zealand Dollar struggled above 0.6100 and started a fresh decline against the US Dollar.
There was a move below the 0.6050 and 0.6020 support levels. A low was formed at 0.5978 and the pair is now consolidating losses below the 50-hour simple moving average. The NZD/USD chart suggests that the RSI is back below 50 signalling a bearish bias.
On the upside, the pair is facing resistance near the 23.6% Fib retracement level of the downward move from the 0.6120 swing high to the 0.5978 low. There is also a connecting bearish trend line forming with resistance at 0.6010.
The next major resistance is near the 0.6065 level or the 61.8% Fib retracement level. A clear move above the 0.6065 level might even push the pair toward the 0.6120 level. Any more gains might clear the path for a move toward the 0.6150 resistance zone in the coming days.
On the downside, there is a support forming near the 0.5980 zone. If there is a downside break below 0.5980, the pair might slide toward 0.5940. Any more losses could lead NZD/USD in a bearish zone to 0.5910.
This article represents the opinion of the Companies operating under the FXOpen brand only. It is not to be construed as an offer, solicitation, or recommendation with respect to products and services provided by the Companies operating under the FXOpen brand, nor is it to be considered financial advice.
Nzdusddaily

NZDUSD Trade Idea. Key Levels for a Potential NZD/USD Short📉 NZD/USD is trending strongly bearish, and I’ve just posted a new breakdown on TradingView 🎥. The current price action looks overextended, and the pair remains under heavy selling pressure 🔻.
I’m watching for a potential retracement into the Fibonacci 50%–61.8% zone 🔄 — the equilibrium area where I’ll be eyeing a possible short entry 🎯.
The video covers entry ideas, stop-loss placement, and target levels 🎯📍.
⚠️ This is not financial advice — for educational purposes only.

NZD/USD Shows Bullish Hints, Can Gains Be Sustained?Market Analysis: NZD/USD Shows Bullish Hints, Can Gains Be Sustained?
NZD/USD is also rising and might aim for more gains above 0.6040.
Important Takeaways for NZD/USD Analysis Today
- NZD/USD is consolidating gains above the 0.6000 zone.
- There was a break above a major bearish trend line with resistance at 0.5970 on the hourly chart of NZD/USD at FXOpen.
NZD/USD Technical Analysis
On the hourly chart of NZD/USD at FXOpen, the pair started a steady increase from the 0.5880 zone. The New Zealand Dollar broke the 0.5920 resistance to start the recent increase against the US Dollar.
There was a break above a major bearish trend line with resistance at 0.5970. The pair settled above 0.5960 and the 50-hour simple moving average. It tested the 0.6040 zone and is currently consolidating gains.
The pair tested the 23.6% Fib retracement level of the upward move from the 0.5882 swing low to the 0.6040 high. However, the bulls are active above the 0.6000 level.
The NZD/USD chart suggests that the RSI is stable near 60. On the upside, the pair might struggle near 0.6040. The next major resistance is near the 0.6090 level.
A clear move above the 0.6090 level might even push the pair toward 0.6120. Any more gains might clear the path for a move toward the 0.6200 resistance zone in the coming days.
On the downside, immediate support is near the 0.5980 level. The first key support is near 0.5960. It is close to the 50% Fib retracement level.
The next major support is near 0.5920. If there is a downside break below the 0.5920 support, the pair might slide toward 0.5880. Any more losses could lead NZD/USD in a bearish zone to 0.5850.
This article represents the opinion of the Companies operating under the FXOpen brand only. It is not to be construed as an offer, solicitation, or recommendation with respect to products and services provided by the Companies operating under the FXOpen brand, nor is it to be considered financial advice.

NZD/USD Aims Steady IncreaseNZD/USD Aims Steady Increase
NZD/USD is also rising and might aim for more gains above 0.6080.
Important Takeaways for NZD USD Analysis Today
- NZD/USD is consolidating gains above the 0.6030 zone.
- There is a key bullish trend line forming with support at 0.6030 on the hourly chart of NZD/USD at FXOpen.
NZD/USD Technical Analysis
On the hourly chart of NZD/USD on FXOpen, the pair started a steady increase from the 0.5990 zone. The New Zealand Dollar broke the 0.6020 resistance to start the recent increase against the US Dollar.
The pair settled above 0.6030 and the 50-hour simple moving average. It tested the 0.6065 zone and is currently consolidating gains. The pair corrected lower below the 0.6050 level and the 23.6% Fib retracement level of the upward move from the 0.6006 swing low to the 0.6064 high.
However, the bulls are active above the 0.6030 level. The NZD/USD chartsuggests that the RSI is stable near 50. On the upside, the pair might struggle near 0.6065. The next major resistance is near the 0.6080 level.
A clear move above the 0.6080 level might even push the pair toward the 0.6120 level. Any more gains might clear the path for a move toward the 0.6200 resistance zone in the coming days.
On the downside, immediate support is near the 0.6030 level. There is also a key bullish trend line forming with support at 0.6030. It is close to the 61.8% Fib retracement level of the upward move from the 0.6006 swing low to the 0.6064 high.
The first key support is near the 0.6005 level. The next major support is near the 0.5990 level. If there is a downside break below the 0.5990 support, the pair might slide toward the 0.5970 support. Any more losses could lead NZD/USD in a bearish zone to 0.5950.
This article represents the opinion of the Companies operating under the FXOpen brand only. It is not to be construed as an offer, solicitation, or recommendation with respect to products and services provided by the Companies operating under the FXOpen brand, nor is it to be considered financial advice.
nzdusd sell signal. Don't forget about stop-loss.
Write in the comments all your questions and instruments analysis of which you want to see.
Friends, push the like button, write a comment, and share with your mates - that would be the best THANK YOU.
P.S. I personally will open entry if the price will show it according to my strategy.
Always make your analysis before a trade

NZDUSD Range Tightens – Breakout Setup BuildingNZDUSD continues to coil within a contracting triangle, forming a symmetrical wedge bounded by lower highs and higher lows. Price is approaching the resistance zone near 0.6028, with visible indecision and rejection wicks, signaling potential for either breakout or rejection.
Key Levels:
Resistance: 0.6028 (structural ceiling, key pivot)
Support: ~0.5800 (ascending support line of wedge)
Breakout Target (Bullish): 0.6150–0.6200
Breakdown Target (Bearish): 0.5650–0.5550
Scenarios to Watch:
🔹 Bearish Rejection
Price rejects off 0.6028 and returns inside range
Watch for momentum drop and move toward wedge base (0.5800)
Clean breakdown opens path toward April lows (~0.5509)
🔹 Bullish Breakout
Break and hold above 0.6028
Confirmation on 4H close + retest
Opens room for bullish extension toward 0.6150+
Outlook:
Price is nearing apex compression, suggesting breakout is imminent.
Bias is neutral until price breaks out of the current wedge structure.
Expect volatility spike around the 0.6028 test.

NZDUSD..SHORTPrice is nearing a critical level around .
** No setup, no trade. **
For me, a solid plan always comes before any prediction.
*****If the zone is broken and confirmed with a retest, I’ll adjust my plan accordingly for a possible reverse trade.
For detailed entry points, trade management, and high-probability setups, follow the channel:
ForexCSP

nzdusd sell signal. Don't forget about stop-loss.
Write in the comments all your questions and instruments analysis of which you want to see.
Friends, push the like button, write a comment, and share with your mates - that would be the best THANK YOU.
P.S. I personally will open entry if the price will show it according to my strategy.
Always make your analysis before a trade

#NZDUSD:DXY Gaining Its Strength Back, Is it end for the Bulls? The OANDA:NZDUSD DXY index shows a change in price character and momentum, indicating a possible price reversal for the shorter term. This aligns with our fundamental analysis, as there’s a likelihood of a China-US trade deal that could significantly influence the demand for the DXY.
There are two possible selling entries, allowing you to choose between a riskier or safer approach. Alongside these entries, we’ve set targets accordingly to your chosen entry.
Good luck and trade safely!
Thank you for your unwavering support! 😊
If you’d like to contribute, here are a few ways you can help us:
- Like our ideas
- Comment on our ideas
- Share our ideas
Team Setupsfx_
❤️🚀

Long on NZD/USDI am long on NZDUSD. We have a bottoming structure with an additional trendline break.
You can long from a retest of trendline or as close to 0.56500.
Target 1 - Golden Zone area between 0.59500 - 0.60500
Target 2 - 0.63

nzdusd sell signal. Don't forget about stop-loss.
Write in the comments all your questions and instruments analysis of which you want to see.
Friends, push the like button, write a comment, and share with your mates - that would be the best THANK YOU.
P.S. I personally will open entry if the price will show it according to my strategy.
Always make your analysis before a trade

#NZDUSD 1DAYNZDUSD (1D Timeframe) Analysis
Market Structure:
The price is approaching a significant support level, which has previously acted as a key area for price reversals. This level is important for identifying potential buying opportunities.
Forecast:
It is recommended to wait for the price to reach the support level. If bullish confirmation is observed, such as bullish candlestick patterns or increased buying momentum, a buy position can be considered.
Key Levels to Watch:
- Entry Zone: Monitor the price behavior near the support level and consider buying if a clear bounce or bullish signal is confirmed.
- Risk Management:
- Stop Loss: Placed below the support zone to protect against a potential breakdown.
- Take Profit: Target the next resistance levels for potential gains.
Market Sentiment:
Confirmation of bullish sentiment will depend on how the price reacts at the support level. A strong bounce would indicate potential for upward movement, while a breakdown may signal further downside. Waiting for confirmation will provide better trade accuracy.

NZDUSDThe price has touched this base once and is now unable to fall, so I expect the price to rise above the upper base.

nzdusd buy signal. Don't forget about stop-loss.
Write in the comments all your questions and instruments analysis of which you want to see.
Friends, push the like button, write a comment, and share with your mates - that would be the best THANK YOU.
P.S. I personally will open entry if the price will show it according to my strategy.
Always make your analysis before a trade

NZDUSD TRADE IDEA : SHORT | SELL (13/01/25)Very nice and easy setup. Nothing fancy with the opportunity of doubling the RR.
Following the order flow - no forcing whatsoever - I decided that the sell made most sense. Entry makes sense with the break of structure coming at the hands of a clear heavy imbalance.
RR1: 2.48
RR2: 4.21

nzdusd buy signal. Don't forget about stop-loss.
Write in the comments all your questions and instruments analysis of which you want to see.
Friends, push the like button, write a comment, and share with your mates - that would be the best THANK YOU.
P.S. I personally will open entry if the price will show it according to my strategy.
Always make your analysis before a trade

NZDUSD BUY | Idea Trading AnalysisNZD/USD is falling towards a support level which is a pullback support and could bounce from this level to our take profit.
We expect a decline in the channel after testing the current level which suggests that the price will continue to rise
Hello Traders, here is the full analysis.
I think we can soon see more fall from this range! GOOD LUCK! Great BUY opportunity NZDUSD
I still did my best and this is the most likely count for me at the moment.
-------------------
Traders, if you liked this idea or if you have your own opinion about it, write in the comments. I will be glad

#NZDUSD: On the Way to Yearly High! EURNZD
Price rejected at the major key level at 0.6360, where it had been rejected six times previously, showing a strong hold at that level. Since the price has dropped, we are now expecting a bullish reversal at 0.60. A great entry at that level can get you 700 pips in the long term.
Good luck!

nzdusd sell signal. Don't forget about stop-loss.
Write in the comments all your questions and instruments analysis of which you want to see.
Friends, push the like button, write a comment, and share with your mates - that would be the best THANK YOU.
P.S. I personally will open entry if the price will show it according to my strategy.
Always make your analysis before a trade

NZDUSD: Last Bullish Push ? Let's Find OutDear Traders,
We are witnessing a final bullish move on NZDUSD, as we are on the verge of bullish price exhaustion. Which will lead price to breakthrough previous price resistance zone. Good luck.

nzdusd sell signal. Don't forget about stop-loss.
Write in the comments all your questions and instruments analysis of which you want to see.
Friends, push the like button, write a comment, and share with your mates - that would be the best THANK YOU.
P.S. I personally will open entry if the price will show it according to my strategy.
Always make your analysis before a trade
