NZDUSD forecast on H5, potential double top formation!!**Disclaimer** the content on this analysis is subject to change at any time without notice, and is provided for the sole purpose of assisting traders to make independent investment decisions.
Traders!! if you like my ideas and do take the same trade like i do, please write it in comment so we can manage the trade together.
_____________________________________________________________________________________________________________________
Thank you for your support ;)
GWBFX
Nzdusdforecast

NZDUSD H4 H&Swe have up trend chart but candles are going weaker and change to dogi
for me that means the chart is changing his path!!!
on the other hand we have H&s patteren. I wait for breaking neckline
we have at least 1:1 risk/reward ratio. my first profit target will be 0.652
keep your eyes on this chart

NZDUSD forecast on daily Note : NZDUSD has reached an important resistance level right now, we will wait for the price rejection that will occur at that level ;)
**Disclaimer** the content on this analysis is subject to change at any time without notice, and is provided for the sole purpose of assisting traders to make independent investment decisions.
Traders!! if you like my ideas and do take the same trade like i do, please write it in comment so we can manage the trade together.
_____________________________________________________________________________________________________________________
Thank you for your support ;)
GWBFX


NZD/USD: Nice chance to sell!Hey tradomaniacs,
as you can see onm the weekly chart we are currently retesting the Trendline of the primary trend.
Additionally we are right at a horizontal key-resistance and should wait for a rejection and confirmation in the smaller time-frame here.
LEAVE A LIKE AND A COMMENT - I appreciate every support! =)
Peace and good trades
Irasor
Wanna see more? Don`t forget to follow me.
Any questions? PM me. :-)


NZDUSD: Key Resistance at 0.6436 - Barrier Triangle PossiblePrice may yield a rather interesting structure - a barrier triangle. For this to materialize, two things need to happen: (1) Price must respect key resistance at 0.6436 and, (2), the formation of wave E in the triangle must not overlap wave C, as this will be the invalidation point if the triangle plays out. We don't yet have a buy setup. Stay out and wait for confirmation.

NzdUsd towards 0.6600?From the beginning of September NadUsd has formed a H&S reversal pattern. Now the pair is consolidating just under the neckline resistance and it seems that is accumulating pressure.
A break here would expose 0.65 psychological level and 0.66 for a swing target.
Strategy:
Buy the market
SL @ 0.6360
Target 1 @ 0.65
Target 2 @ 0.66

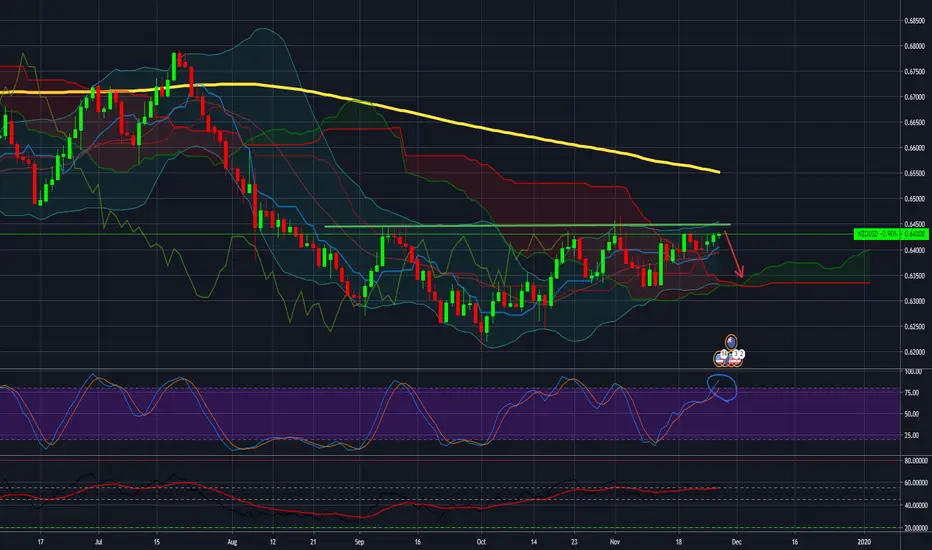
#NZDUSD, Returning to the ups?Upward trend on the daily chart.
Stochastic Indicator approaches the Overbought upper value.
We have drawn a resistance line at 0.6450 in the graph above as you can see the nzdusd has trouble breaking the above line.
Buy only having a resistance line break
By then Sell with a target of 0.6330
NZD/USD: Weekly Outlook and TradingplanHey tradimaniacs,
welcome to the weekly preparation of NZD/USD.
Check all the charts to see details. ;-)
-----------------------------
LEAVE A LIKE AND A COMMENT - I appreciate every support! =)
Peace and good trades
Irasor
Wanna see more? Don`t forget to follow me.
Any questions? PM me. :-)


NZDUSD Update: Watch out for this!NZDUSD been in a steady downtrend since 2018. The market is currently in a corrective phase. Here is what you should watch out for in order to catch the next probable impulsive move.


NZDUSD - Forex Majors | Elliott Wave Patterns | November 2019NZD/USD - Elliott Wave Technical Analysis
Structure & Degree: 3-swings Sequence in a Primary Degree Y (pink)
- Intermediate (A) (blue) - Sharp Zig-Zag
- Intermediate (B) (blue) - Complex Expanding Flat in Minors WXY (turquoise)
- Intermediate (C) (blue) - Bullish Impulse
Minor 1 (green): 5-swing sequence, decomposed as a 5-3-5-3-5 in Minutes i ii iii iv v (green)
Minor 2 (green): Complex Double Three in Minutes wxy (purple)
Current Position & Pattern:
- Minute y (purple), bearish 3-swings or 5-swings sequence
Expected Swing:
- Minor 3 (green) accumulation cylinder: 3 of 3's Impulse, Bullish Sequence
Technicals & Confirmations:
- 61.8 or 71.6% Fibonacci Retracements of Minor 1 (green)
- 161.8% or 200% Fibonacci Extensions of Minutes w & x (purple)
- Bullish Divergence at the Fibs
- Ascending Channel, lower trend-line support
- Bullish Harmonic Structure


NZDUSD Analysis* NZDUSD
> Chart: H4
> Trendency: Up
> TrendLine is broken
> Waiting for breakout the Resistance

NZDUSD - Monday Update - From last WeekANALYSIS ON NZDUSD
Welcome to my analysis
-
1 Hour Chart
-
Interesting Point of interest In the NZDUSD pair.
- Price below the 200 day EMA.
- Expecting more upward momentum.
- Price also seating on the 50% fib retracement level. Price could move the the 38.2% fib level so keep an eye out.
Stay Tuned

sell #nzdusd at 0.6433 and take profit at 0.6405 so 32 PIPS sell #nzdusd at 0.6433 and take profit at 0.6405 so 32 PIPS double top short term possibility but anyway overbought,small correction legit and face good resistance

NZDUSD LONG - LONG TERM INVESTMENT BUYERS LOOKING TO TEST OUT 0.64291 AS SUPPORT, SELLERS MIGHT TRY TO DEFEND THAT AREA AND TURN IT INTO RESISTANCE, BUT UNTIL THEN THE PRICE HAS REACHED A NEW LOW IN THE DOWN CHANNEL AND THE BULLS AREN'T FINISHED WITH THE PAIR YET
TP- 0.64291
SL- 0.62023

NZDUSD - Sell at TOPANALYSIS ON NZDUSD
Welcome to my analysis
-
15 Min Chart
-
Interesting Point of interest In the NZDUSD pair.
- Price still above 200 day EMA.
- Expecting more move to the downside.
- MACD showing bearish divergence.
Trade carefully, sell at top.
Stay Tuned
