NZD/USD: Market Structure Shifts in Favor of BullsFenzoFx—NZD/USD broke above the 0.597 immediate resistance, signaling a market structure shift. We expect the uptick in momentum to resume toward the middle line of the bullish channel.
However, for a low-risk entry, waiting for the price to near the FVG at 0.595 is recommended.
Nzdusdsignals

NZDUSD Excellent buy opportunity on the Channel Up bottom.Last time we looked at the NDUSD pair (May 27, see chart below), we gave a buy signal that in a few days hit our 0.60900 Target:
This time the price is trading exactly at the bottom of a 3-month Channel Up, with the 1D RSI entering its Support Zone. The true Support might be a little lower on the 1D MA200 (orange trend-line) and as long as it holds, the trend will remain bullish, but this is the first strong buy signal of the chart.
Our Target is 0.61450, which will be a +4.10% rise, exactly the same as both previous Bullish Legs.
-------------------------------------------------------------------------------
** Please LIKE 👍, FOLLOW ✅, SHARE 🙌 and COMMENT ✍ if you enjoy this idea! Also share your ideas and charts in the comments section below! This is best way to keep it relevant, support us, keep the content here free and allow the idea to reach as many people as possible. **
-------------------------------------------------------------------------------
Disclosure: I am part of Trade Nation's Influencer program and receive a monthly fee for using their TradingView charts in my analysis.
💸💸💸💸💸💸
👇 👇 👇 👇 👇 👇

"Vault Breached! NZD/USD Bullish Loot (Live Heist)"🚨 "THE KIWI BANK HEIST" 🏦💰
NZD/USD Bullish Raid – Loot Fast Before the Cops Arrive!
🌟 Greetings, Money Bandits! 🌟 (Hola! Bonjour! Ciao! Konnichiwa!)
🔥 Thief Trading Intel:
The Vault is Open! 🏦➡️📈 – Price is bullish, but overbought.
Red Zone = Police Trap! 🚨 (Resistance/Reversal Risk)
Escape Plan: Take profits near 0.62400 (or bail early if traps trigger).
🔐 ENTRY: "BREAK IN NOW!"
"Buy the dip!" – Use 15M/30M swing lows for stealthy entries.
Set Alerts! ⏰ (Don’t miss the heist!)
🛑 STOP-LOSS: "THIEF’S SAFETY NET"
"Hide at 0.59500 (4H Swing Low)" – Adjust based on your loot size!
🎯 TARGET: "GRAB & VANISH!"
"0.62400 or escape earlier!" – Don’t get greedy; cops (bears) are lurking.
⚡ SCALPERS’ NOTE:
"Only steal LONG!" – Use trailing SL to protect your bag.
"Rich? Charge in! Poor? Wait for swings!"
📡 FUNDAMENTAL BACKUP:
"Kiwi is bullish… but check the news!" 📰 (COT, Macro Data, Sentiment)
⚠️ ALERT: Avoid trading during high-impact news – cops (volatility) love chaos!
💥 BOOST THIS HEIST! (Like & Share = More Loot!)
🚀 "Support the crew! Hit 👍, and let’s rob this market blind!" 💸🤝
Next heist coming soon… Stay tuned, bandits! 🏴☠️🎭

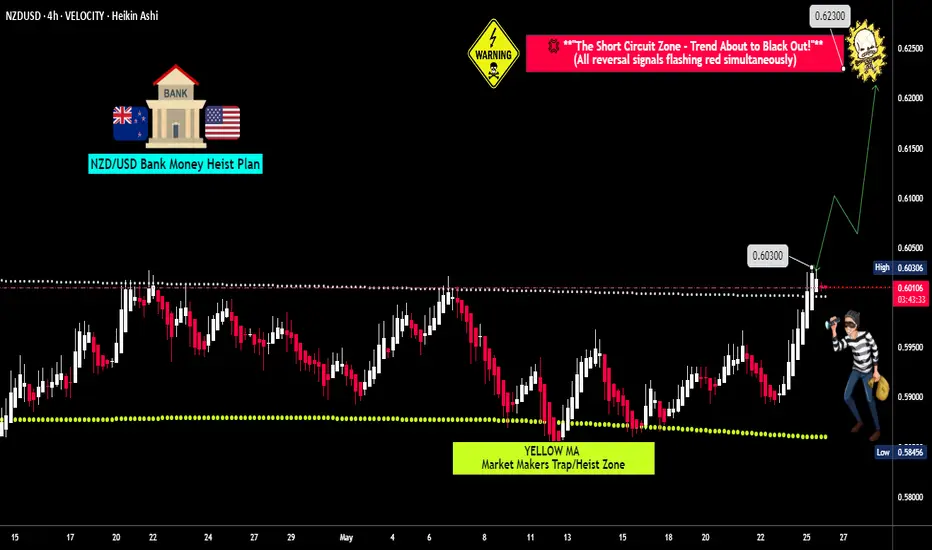
Is This the Next Big Heist? Thief Trader Eyes NZD/USD Long SetupThief Trader’s NZD/USD Heist Plan – Long Setup in Play!
🌍 **Hello Global Wealth Warriors!**
Hello, Bonjour, Ciao, Salut, Guten Tag, Ola!
📢 **Fellow Profit Pirates & Market Mavericks**, it’s time to set sail again! Get ready to loot the forex seas with our latest **Thief Trader Strategy** targeting the **NZD/USD (The Kiwi)** pair.
---
🔎 **Trade Overview**
💥 Setup: Long Entry Plan – Executing our cunning blueprint with Thief Trading's sharp technical & fundamental intel**.
🎯 Target: 0.62300 (or exit just before for safety).
⚠️ Danger Zone: Watch for traps at the RED Zone Level – signs of overbought conditions, consolidation, trend flips & bearish setups.
---
🟢 **Entry Signal** – *The Heist Begins!*
📈 **Primary Entry**:
> Breakout above **MA Line (0.60300)** = Bullish move → *Place a Buy Stop above ATR Line*
📉 **Pullback Option**:
> *Buy Limit* at recent swing low/high on **15 or 30-min TF**.
📌 **Pro Tip**:
Set an **Alert** on your chart to catch the breakout live. Timing is everything!
---
🛑 **Stop Loss – The Getaway Plan**
📍 **SL Recommendation**:
> Recent swing low on the **4H chart (0.59400)** for day/swing trades.
> 🎯 Customize your SL based on risk, lot size, and total orders.
---
🔐 **Scalpers vs. Swingers**
👀 **Scalpers**: Focus ONLY on long-side plays.
💰 Got deep pockets? Dive in.
😎 Otherwise, swing traders – this is your golden moment. Trail your SL to protect profits.
🌐 **Market Pulse** – Momentum Watch
📊 Kiwi is navigating a **MA Resistance Zone**, but bullish bias remains due to:
* **Fundamentals**
* **Macro Insights**
* **COT Reports**
* **Sentiment & Intermarket Trends**
* **Quant Analysis + Overall Score**
📎 Check the linkks for detailed breakdown.
📰 **News Warning!**
⚠️ Major releases ahead?
* Pause entries.
* Protect trades with **trailing SLs**.
---
🚨 **Join the Next Heist with Thief Trading!**
💥 Smash that **Boost** or **Like** to join our profit squad.
With **Thief Trader Style**, we dominate the markets DAILY.
Your support fuels our mission. ❤️💼
---
💸 Stay ready for the next move, money-makers.
🎯 Eyes on the chart – timing is profit.
NZD/USD – Bearish Reversal Expected Below 0.5990–0.5977 ResistanThe NZD/USD pair is approaching a key resistance zone at 0.5990–0.5977, which has been tested multiple times and aligns with the upper boundary of a potential corrective structure.
🔹 Elliott Wave Context:
The price action appears to be completing a corrective wave (C) structure, indicating that upside momentum may be limited.
This scenario suggests a potential bearish reversal from the resistance zone.
🔹 Targets & Levels:
Resistance: 0.5990–0.5977
First support target: 0.5885
Next major support: 0.5846
📌 Trading Plan:
Watching for bearish confirmation (rejection candlesticks or reversal pattern) below 0.5990–0.5977
Potential short entries targeting the support levels
A break above 0.5990 would invalidate the bearish setup and suggest continuation to the upside
This chart offers a clear bearish bias while price remains below the resistance zone, supported by Elliott Wave context and previous price action behavior.

NZDUSD 1D Golden Cross, final bull signal.The NZDUSD pair has been trading within a Channel Up pattern that only broke during the early April sell-off and has found Support near its 1D MA50 (blue trend-line) on its recent May consolidation.
As the 1D MACD just formed the 4th Bullish Cross of the year we expect this long with the emerging 1D Golden Cross to be the final buy signal before a long-term correction. Our Target is 0.60900 representing a +4.30% rise, the minimum previous within this pattern.
-------------------------------------------------------------------------------
** Please LIKE 👍, FOLLOW ✅, SHARE 🙌 and COMMENT ✍ if you enjoy this idea! Also share your ideas and charts in the comments section below! This is best way to keep it relevant, support us, keep the content here free and allow the idea to reach as many people as possible. **
-------------------------------------------------------------------------------
💸💸💸💸💸💸
👇 👇 👇 👇 👇 👇

NZDUSD potential 50 pip drop? NZDUSD 4h crossed the previous liquidity zone with strong false breakout giving a high probability for the price to form a potential inverted head & shoulder and may continue to drop to 0.5308 which may lead a 50 pip drop with market open as the market is in strong down trend.
A possible sell trade setup with market open is highly probable!

NZD/USD "The Kiwi" Forex Market Money Heist Plan🌟Hi! Hola! Ola! Bonjour! Hallo! Marhaba!🌟
Dear Money Makers & Thieves, 🤑 💰🐱👤✈️
Based on 🔥Thief Trading style technical and fundamental analysis🔥, here is our master plan to heist the NZD/USD "The Kiwi" Forex market. Please adhere to the strategy I've outlined in the chart, which emphasizes long entry. Our aim is the high-risk Red Zone. Risky level, overbought market, consolidation, trend reversal, trap at the level where traders and bearish robbers are stronger. 🏆💸Book Profits wealthy and safe trade.💪🏆🎉
Entry 📈 : "The heist is on! Wait for the MA breakout (0.57500) then make your move - Bullish profits await!"
however I advise to Place Buy stop orders above the Moving average (or) Place buy limit orders within a 15 or 30 minute timeframe most recent or swing, low or high level.
📌I strongly advise you to set an alert on your chart so you can see when the breakout entry occurs.
Stop Loss 🛑:
Thief SL placed at the recent/swing low or high level Using the 4H timeframe (0.56800) swing trade basis.
SL is based on your risk of the trade, lot size and how many multiple orders you have to take.
Target 🎯:
✂Primary Target - 0.58350 (or) Escape Before the Target
✂Secondary Target - 0.59600 (or) Escape Before the Target
🧲Scalpers, take note 👀 : only scalp on the Long side. If you have a lot of money, you can go straight away; if not, you can join swing traders and carry out the robbery plan. Use trailing SL to safeguard your money 💰.
📰🗞️Read the Fundamental, Macro, COT Report, Quantitative Analysis, Intermarket Analysis, Sentimental Outlook before start the plan.
NZD/USD "The Kiwi" Forex market is currently experiencing a Bullish 🐃 trend,., driven by several key factors.
🟡Fundamental Analysis
- Economic Indicators: New Zealand's GDP growth rate is 2.5%, inflation rate is 2.3%, and unemployment rate is 3.7%.
- Monetary Policy: The Reserve Bank of New Zealand's official cash rate is 3.25%.
- Fiscal Policy: The New Zealand government's budget deficit is 1.2% of GDP.
⚫Macroeconomic Factors
- Inflation Rate: The inflation rate in New Zealand is 2.3%, which is within the Reserve Bank's target range of 1-3%.
- Interest Rates: The Reserve Bank of New Zealand's official cash rate is 3.25%, which is relatively high compared to other developed economies.
- GDP Growth Rate: New Zealand's GDP growth rate is 2.5%, which is moderate compared to other developed economies.
- Trade Balance: New Zealand's trade balance is improving, with exports increasing.
🟠Global Market Analysis
- US Economic Indicators: The US GDP growth rate is 2.2%, inflation rate is 2.2%, and unemployment rate is 3.5%.
- Commodity Prices: The price of gold is $1,700 per ounce, and the price of oil is $65 per barrel.
- Global Economic Growth: The global economic growth rate is 3.5%, which is moderate.
🔴COT Data
- Non-Commercial Traders: Non-commercial traders, such as hedge funds and speculators, have been net long on the NZD, with 30,000 contracts.
- Commercial Traders: Commercial traders, such as banks and institutions, have been net short on the NZD, with 20,000 contracts.
- Open Interest: The total number of outstanding contracts in the futures market is 120,000.
🟣Intermarket Analysis
- Correlation with AUD/USD: The NZD/USD exchange rate has a strong positive correlation with the AUD/USD exchange rate, with a correlation coefficient of 0.8.
- Correlation with Gold: The NZD/USD exchange rate has a moderate positive correlation with gold prices, with a correlation coefficient of 0.5.
🟤Quantitative Analysis
- Moving Averages: The 50-day moving average is 0.5820, and the 200-day moving average is 0.5750.
- Relative Strength Index (RSI): The RSI is currently at 60, indicating bullish conditions.
- Bollinger Bands: The NZD/USD exchange rate is currently trading above its Bollinger Bands, indicating a strong uptrend.
🔵Market Sentimental Analysis
- Bullish Sentiment: 60% of market participants are bullish on the NZD/USD exchange rate.
- Bearish Sentiment: 40% of market participants are bearish on the NZD/USD exchange rate.
- Fear and Greed Index: The fear and greed index is currently at 70, indicating greed.
🟢Positioning
- Short-Term: Long NZD/USD, targeting 0.59000.
- Long-Term: Long NZD/USD, targeting 0.62000.
⚪Next Trend Move
- Upward: The NZD/USD exchange rate is expected to move upward in the short term.
🟡Overall Summary Outlook
- Bullish: The NZD/USD exchange rate is expected to move upward in the short term, driven by macroeconomic factors, global market analysis, and quantitative analysis.
📌Keep in mind that these factors can change rapidly, and it's essential to stay up-to-date with market developments and adjust your analysis accordingly.
⚠️Trading Alert : News Releases and Position Management 📰 🗞️ 🚫🚏
As a reminder, news releases can have a significant impact on market prices and volatility. To minimize potential losses and protect your running positions,
we recommend the following:
Avoid taking new trades during news releases
Use trailing stop-loss orders to protect your running positions and lock in profits
💖Supporting our robbery plan 💥Hit the Boost Button💥 will enable us to effortlessly make and steal money 💰💵. Boost the strength of our robbery team. Every day in this market make money with ease by using the Thief Trading Style.🏆💪🤝❤️🎉🚀
I'll see you soon with another heist plan, so stay tuned 🤑🐱👤🤗🤩

NZDUSD: Bullish Move After a Bearish Trap 🇳🇿🇺🇸
NZDUSD looks bullish after a false breakout of a key daliy support.
An intraday Change of Character on an hourly shows a strong local bullish sentiment.
I will expect a rise to 0.562
❤️Please, support my work with like, thank you!❤️

NZDUSD Short-term Channel Up aiming higher.The NZDUSD pair has been trading within a 20-day Channel Up and today hit its 4H MA50 (blue trend-line). Last time it did (February 18), it held and initiated a rebound marginally above the 1.236 Fibonacci extension.
Given that the current pull-back is almost as strong (-1.30%) as the previous, but more importantly the 4H RSI hit its 1-month Higher Lows trend-line, we expect a rebound. Our Target is again the 1.236 Fib ext, this time at 0.57900.
-------------------------------------------------------------------------------
** Please LIKE 👍, FOLLOW ✅, SHARE 🙌 and COMMENT ✍ if you enjoy this idea! Also share your ideas and charts in the comments section below! This is best way to keep it relevant, support us, keep the content here free and allow the idea to reach as many people as possible. **
-------------------------------------------------------------------------------
💸💸💸💸💸💸
👇 👇 👇 👇 👇 👇

NZD/USD Strength Persists: Dips Remain Buying OpportunitiesOver the past two weeks, I have drawn attention to major USD pairs, suggesting that a reversal could be imminent and that an upside correction might follow the downtrend from the last quarter of 2024.
NZD/USD is no exception. After finding strong support around the 0.5550 zone, the pair began to reverse to the upside. Following last week’s higher low, it broke resistance on Friday. After an initial correction and confirmation, bulls have regained control.
I expect NZD strength to continue, and as long as 0.5650 holds, there is a high probability of a move toward 0.58 or higher.
In conclusion, buying dips remains a favorable strategy, aiming for a risk-reward ratio of at least 1:2.
Disclosure: I am part of Trade Nation's Influencer program and receive a monthly fee for using their TradingView charts in my analyses and educational articles.

NZDUSD preparing massive rebound on the 5-year Support Zone.The NZDUSD pair rebounded last week exactly at the top of the 5-year Support Zone. This is the 3rd time in total and first since October 10 2022.
As you can see, both previous times that this Support Zone was touched, the price reacted with an immediate rebound and skyrocketed to the long-term Resistance Zone (0.65150 - 0.65850). Also on both those bottoms, the 1W RSI broke below the 30.00 oversold barrier and rebounded.
This time, we have the 1W MA200 (orange trend-line) to consider as the first long-term Resistance, so our Target is just below a potential extension of it at 0.6200.
-------------------------------------------------------------------------------
** Please LIKE 👍, FOLLOW ✅, SHARE 🙌 and COMMENT ✍ if you enjoy this idea! Also share your ideas and charts in the comments section below! This is best way to keep it relevant, support us, keep the content here free and allow the idea to reach as many people as possible. **
-------------------------------------------------------------------------------
💸💸💸💸💸💸
👇 👇 👇 👇 👇 👇

NZSDUSD Bottom of the 1-year Rectangle. Strong buy.The NZDUSD pair gave us a solid sell signal on our last idea (September 04, see chart below) as it respected the 1-year Rectangle pattern, stayed within its Resistance and Support levels and easily hit our 0.6000 Target:
The price hit yesterday the top of the 1-year Support Zone (0.58500) and is reacting today positively with the first green 1D candle in 6 days. The 1D RSI has double bottomed on the 30.00 oversold barrier as on April 14, so we have a strong case for going long with huge reward and limited risk. Notice how we are about to form a 1D Death Cross and the last two such patterns coincided with the bottoms on the Support Zone.
As a result, we are now long, targeting 0.6200, which is considerably below the 0.786 Fibonacci retracement, the level that all previous Bullish Legs hit.
-------------------------------------------------------------------------------
** Please LIKE 👍, FOLLOW ✅, SHARE 🙌 and COMMENT ✍ if you enjoy this idea! Also share your ideas and charts in the comments section below! This is best way to keep it relevant, support us, keep the content here free and allow the idea to reach as many people as possible. **
-------------------------------------------------------------------------------
💸💸💸💸💸💸
👇 👇 👇 👇 👇 👇

NzdUsd could rise above 0.65Much like its larger counterpart, the AUD, the NZD found a bottom against the USD in early August.
Since then, the pair has been trending upwards and is currently testing a key resistance level.
A breakout here could lead to further gains, with the 0.65 level as the next potential target.
I'm bullish on the pair as long as the price stays above last week's low.

NZDUSD Strong sell opportunity.The NZDUSD pair gave us last time (June 26, see chart below) a solid sell signal, even though the Target just fell short of being hit:
The price is giving yet again a sell signal as not only it fulfilled the 0.786 Fibonacci retracement level and got rejected but also the 1D RSI hit and got rejected exactly on the 70.00 overbought barrier, which is where all tops since late 2022 have been priced.
As a result, we expect the pair to initially hit at least 0.6000 towards the end of this month.
-------------------------------------------------------------------------------
** Please LIKE 👍, FOLLOW ✅, SHARE 🙌 and COMMENT ✍ if you enjoy this idea! Also share your ideas and charts in the comments section below! This is best way to keep it relevant, support us, keep the content here free and allow the idea to reach as many people as possible. **
-------------------------------------------------------------------------------
💸💸💸💸💸💸
👇 👇 👇 👇 👇 👇

NZDUSD Risky Short!NZD-USD is trading in
A downtrend and made a
Nice rebound but is
Now retesting the
Falling resistance
From where a move
Down is likely !

The NZDUSD price forecast update June 30thThe NZD/USD pair is trading around 0.60914. The price is currently below both the 100-period and 200-period moving averages, indicating a bearish trend.
There is a significant support zone around 0.60313 to 0.59926. This zone had previously acted as a support but has been broken and retested, indicating a potential shift to resistance. Immediate resistance is around 0.60824, just above the current price.
The price has recently broken through a significant support level (around 0.60824) and retested it, suggesting a potential continuation of the downtrend.
Summary: Right Now it indicates a bearish trend with the price trading below key moving averages and having recently broken a critical support level. Traders should look for selling opportunities on rallies to resistance levels, with potential downside targets near the descending support line around 0.59000. Always ensure proper risk management with stop-loss orders above key resistance levels.
What do you think ? Let me know in the comments
SIGNAL:
SELL: 0.60944 - 0.61085
STOP: 0.61168
TAKE PROFIT: 0.60295
TAKE PROFIT: 0.59948
NOTE: Trade at your own risk. Thank you

NZDUSD Is this 1D Golden Cross a bearish signal?The NZDUSD pair has been trading within a Channel Down on the 1D time-frame since the February 02 2023 High. The price almost reached the 0.786 Fibonacci retracement level, which has formed both previous Lower Highs.
As the pair completed a 1D Golden Cross today, traders might immediately think that this is a bullish signal, as theory suggests but in the past 18 months, both previous Golden Crosses have formed the Top.
At the same time, the 1D RSI completed a Double Top, similar to the December 27 2023 Top. As a result, we have strong evidence to sell this pair again, and target 0.57750 (Support 1).
-------------------------------------------------------------------------------
** Please LIKE 👍, FOLLOW ✅, SHARE 🙌 and COMMENT ✍ if you enjoy this idea! Also share your ideas and charts in the comments section below! This is best way to keep it relevant, support us, keep the content here free and allow the idea to reach as many people as possible. **
-------------------------------------------------------------------------------
💸💸💸💸💸💸
👇 👇 👇 👇 👇 👇

NZDUSD Still bullish but be aware of the sell opportunity above.The rebound we expected on NZDUSD came a little later than we expected two months ago (March 22, see chart below) but nonetheless it is being delivered now and the price is now very close to our medium-term target:
Since we observe though a shift on the Lower Highs trend-line of the long-term Channel Down, we decide to push the Target higher to 0.62600, which now represents the 0.786 Fibonacci retracement level and would be almost a +7.14% rise, similar to the July 14 2023 (Lower) High.
A 1D RSI Double Top would be a perfect sell entry signal like December 27 2023.
-------------------------------------------------------------------------------
** Please LIKE 👍, FOLLOW ✅, SHARE 🙌 and COMMENT ✍ if you enjoy this idea! Also share your ideas and charts in the comments section below! This is best way to keep it relevant, support us, keep the content here free and allow the idea to reach as many people as possible. **
-------------------------------------------------------------------------------
💸💸💸💸💸💸
👇 👇 👇 👇 👇 👇

NZDUSD Strong medium-term buy opportunity.The NZDUSD pair easily broke above the former Channel Down on our last buy signal (October 27 2023, see chart below) and then went on a slow long-term retrace:
The restructured pattern is close to forming a Death Cross on the 1D time-frame, which would be the first since July 06 2023, a formation that turned out to be a buy signal. As the 1D RSI broke below its former Higher Lows trend-line and went below 35.00, a bullish pattern arises. As you can see such RSI pattern priced the Lows of October 26 2023 and May 31 2023, which where bottom buy opportunities that targeted the 0.786 Fibonacci retracement level from the previous High of the Channel Down.
Assuming the price soon hits its Lower Lows trend-line, a projected 0.786 Fib is around 0.6280 but we are targeting marginally lower at the top of the Channel Down at 0.62350, as until it breaks, it remains the dominant pattern.
-------------------------------------------------------------------------------
** Please LIKE 👍, FOLLOW ✅, SHARE 🙌 and COMMENT ✍ if you enjoy this idea! Also share your ideas and charts in the comments section below! This is best way to keep it relevant, support us, keep the content here free and allow the idea to reach as many people as possible. **
-------------------------------------------------------------------------------
💸💸💸💸💸💸
👇 👇 👇 👇 👇 👇

NZDUSD Channel Down still holding. Prime short here.The NZDUSD pair hit the 0.60500 target (see chart below) we set on our most recent call (October 27):
As you can see, the price extended even higher to the top (Lower Highs trend-line) of the 12-month Channel Down where it has so far been rejected. This is technically the most optimal level to sell, as long as the trend-line holds of course. We are taking this opportunity and will target 0.57750 (Support 1). If however the 1D RSI hits the 30.00 oversold level before the target is materialized, we will take profit regardless, as this will be a sign of a potential bottom.
-------------------------------------------------------------------------------
** Please LIKE 👍, FOLLOW ✅, SHARE 🙌 and COMMENT ✍ if you enjoy this idea! Also share your ideas and charts in the comments section below! This is best way to keep it relevant, support us, keep the content here free and allow the idea to reach as many people as possible. **
-------------------------------------------------------------------------------
💸💸💸💸💸💸
👇 👇 👇 👇 👇 👇

NzdUsd is extremely bullish above 0.6050
Recently, I highlighted a potential reversal for NZD/USD on a few occasions. This anticipation was based on two primary factors: firstly, the occurrence of a false break, and secondly, the emergence of a notably large bullish engulfing pattern in mid-November.
As predicted, the pair successfully surpassed the 0.60 figure and the horizontal level at 0.6050, achieving a local high of 0.6221.
While the early part of the week is marked by a normal correction, there are indications that this correction may have concluded, paving the way for a potential continuation to the upside towards 0.64 next important level of resistance.
As the title suggests, NZD/USD is currently exhibiting strong bullish momentum above the 0.6050 support level.
The bullish sentiment prevails as long as this support is intact on a daily close basis.
In line with this analysis, my strategy for this pair is to capitalize on buying opportunities during market dips.

NZDUSD High probability buy at the bottom of the Channel Down.The NZDUSD pair has gone a long way since the previous successful buy signal we gave (see chart below):
The Channel Down shifted higher but the price is once again found on its bottom (Lower Lows trend-line) giving us a new high probability buy opportunity. On top of that, it appears to be repeating the May 31 bottom as the RSI is on an identical sequence. As a result we expect a rise towards the 0.618 Fibonacci Channel level at 0.60500, which would be as close as possible to the 1D MA200 (orange trend-line) to test it as a Resistance.
-------------------------------------------------------------------------------
** Please LIKE 👍, FOLLOW ✅, SHARE 🙌 and COMMENT ✍ if you enjoy this idea! Also share your ideas and charts in the comments section below! This is best way to keep it relevant, support us, keep the content here free and allow the idea to reach as many people as possible. **
-------------------------------------------------------------------------------
💸💸💸💸💸💸
👇 👇 👇 👇 👇 👇
