NZD/USD SHORT SELL OPPUTUNITY now......
Hello Traders, here is the full analysis for this pair,
let me know in the comment section below if you have any questions,
the entry will be taken only if all rules of the strategies will be
satisfied. I suggest you keep this pair on your watch list and see if
the rules of your strategy are satisfied.
Dear Traders,
If you like this idea, do not forget to support with a like and follow.
PLZ! LIKE COMMAND AND SUBSCRIBE
Nzdusdsignals

NZDUSD - H4 - Bearish Reversal short tradeNzdusd - H4 - I see a reversal coming on nzdusd now as the uptrend becomes exhausted on daiyl and H4 chart im looking for a decent drop back to the lows for a 200-300 pips target.

NZDUSD | Perspective for the new week | Follow-up detailsMy last speculation on this pair earned us over 200pips before the Bullish momentum began (see link below for reference purposes); Despite a long term Bullish perspective, I am beginning to see a short term opportunity to do a temporary sell on the Kiwi in the coming week as the Bears gear to step into the game.
Tendency: Downtrend (Bearish)
Structure: Supply & Demand | Reversal pattern (Double Top)
Observation: i. After breaking out of Double Bottom Neckline on the 14th of October 2021 (see daily chart), the Kiwi recorded a 3.42% growth over the Dollar to set the tone for a Bullish momentum in the long term.
ii. As it is now, it appears we are about to witness a correction phase into the Double Bottom Neckline (see daily chart) to incite a bullish trend continuation.
iii. Double Top: An extremely bearish technical reversal pattern forming after price tested a peak two consecutive times with a moderate decline between the two highs ($0.72100/0.71900) is an emphatic signal that awaits confirmation in the mode of a fall below the support level which is also equal to the low between the two prior highs (Neckline @ $0.71500).
iv. At this juncture, the Breakdown/Retest of the identified Neckline shall welcome an opportunity to open a position in the coming week.
v. In the midst of a potential Breakout/Retest of Neckline, there is a possibility that the price might do a climb to test the identified "New Supply level" within $0.71800/0.71500 in the early hours/days of the new week to incite further decline in price... Trade consciously!😊
Trading plan: SELL confirmation with a minimum potential profit of 150 pips.
Risk/Reward : 1:5
Potential Duration: 4 to 10days
NB: This speculation might be considered to make individual decisions on the lower timeframe.
Watch this space for updates as price action is been monitored.
Risk Disclaimer:
Margin trading in the foreign exchange market (including commodity trading, CFDs, stocks etc.) has a high risk and is not suitable for all investors. The content of this speculation (including all data) is organized and published by me for the sole purpose of education and assistance in making independent investment decisions. All information herein is for your reference only and I take no responsibility.
You are hereby advised to carefully consider your investment experience, financial situation, investment objective, risk tolerance level, and consult your independent financial adviser as to the suitability of your situation prior to making any investment.
I do not guarantee its accuracy and is not liable for any loss or damage which may result directly or indirectly from such content or the receipt of any instruction or notification therewith.
Past performance is not necessarily indicative of future results.

NZD/USD SELL OPPUTUNITY now......
Hello Traders, here is the full analysis for this pair,
let me know in the comment section below if you have any questions,
the entry will be taken only if all rules of the strategies will be
satisfied. I suggest you keep this pair on your watch list and see if
the rules of your strategy are satisfied.
Dear Traders,
If you like this idea, do not forget to support with a like and follow.
PLZ! LIKE COMMAND AND SUBSCRIBE

NZDUSD | Perspective for the new week | Follow-up detailsIt's over 300pips move in our direction since my last publication on this pair (see link below for reference purposes) and the appearance of a Double Top pattern is leaving me with no choice but to look out for Bearish momentum in the coming week(s). There is high hope for the Greenback in the nearest future as the focus remains on the Fed tapering timeline
Tendency: Downtrend (Bearish)
Structure: Supply & Demand | Reversal pattern (Double Top)
Observation: i. The Kiwi enjoyed a tremendous 5.33% gain over the Dollar in the last 3 weeks but appears to have found Resistance @ $0.71700 which gave rise to a Double Top structure.
ii. Double Top: An extremely bearish technical reversal pattern forms after price tested the peak ($0.717000/0.71600) two consecutive times with a moderate decline between the two highs with confirmation awaiting us if the price falls below the Demand level which is equal to the low between the two prior highs.
iii. The appearance of a couple of shooting star candlesticks on the last trading days of last week further emphasizes the expectation of a plunge in the coming week(s).
iv. Shooting star: the price tried to rise significantly during the last two days (9th/10th Sept 2021), but then the sellers took over and pushed the price back down.
iii. Even as we remain patient for confirmation in the Breakdown of Neckline, I am comfortable being in this trade anywhere below Key level @ $0.71200... Trade consciously!😊
Trading plan: SELL confirmation with a minimum potential profit of 150 pips.
Risk/Reward : 1:5
Potential Duration: 5 to 10days
NB: This speculation might be considered to make individual decisions on the lower timeframe.
Watch this space for updates as price action is been monitored.
Risk Disclaimer:
Margin trading in the foreign exchange market (including commodity trading, CFDs, stocks etc.) has a high risk and is not suitable for all investors. The content of this speculation (including all data) is organized and published by me for the sole purpose of education and assistance in making independent investment decisions. All information herein is for your reference only and I take no responsibility.
You are hereby advised to carefully consider your investment experience, financial situation, investment objective, risk tolerance level, and consult your independent financial adviser as to the suitability of your situation prior to making any investment.
I do not guarantee its accuracy and is not liable for any loss or damage which may result directly or indirectly from such content or the receipt of any instruction or notification therewith.
Past performance is not necessarily indicative of future results.

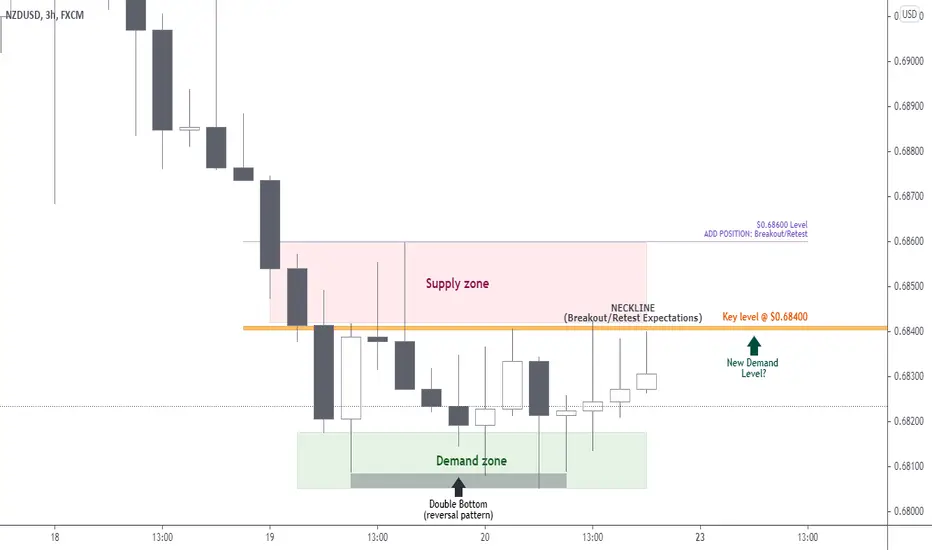
NZDUSD | Perspective for the new week | Follow-up detailsIt is over 200pips move in our direction since my last publication on this pair (see link below for reference purposes - the positive outcome from this speculation is indeed interesting as one of my client did not believe in our sell position hence he closed the trade😄and lost the opportunity to recover his account ) and it appears that we have milked the Bearish move to its end as the appearance of a reversal set-up at this juncture hints at a possible rally which might be a correction of the impulse leg we took advantage of. The Kiwi hit 10-month lows on Friday as coronavirus lockdowns undermined their economies and pushed out policy tightening hereby sparking a steep drop in bond yields.
After hitting a month low @ $0.68050 early in the week, the Kiwi bounced higher in a rangebound trade to post a slight gain at the end of the week with signs of a reversal in the air should price break and close above key level @ $0.68400.
Tendency: Uptrend (Bullish)
Structure: Supply & Demand | Reversal pattern (Double Bottom)
Observation: i. Since the beginning of the month of August 2021, we witnessed a spiral move downward as the price continued to find lower lows.
ii. After hitting bottom @ $0.68100, we witnessed multiple rejections of this level during the latter part of last week trading session which gave rise to the appearance of a Double Bottom pattern - a very strong reversal setup.
iii. Double Bottom: a charting pattern that describes a change in trend and a momentum reversal from prior leading price action shall be confirmed as soon as the price does a Breakout/Retest of the Neckline which is also my Key level at this juncture.
iv. Considering the Bearish momentum on this pair; it is advisable that we become patient for confirmation which shall be at the completion of reversal pattern to hop in the rally.
v. Please note that this reversal might be a correction of the bearish impulse leg (temporarily bullish) and if the price breaks above a 61.8/78.6% retracement then we can be looking at the possibility of an outright reversal... Trade consciously!😊
Trading plan: BUY confirmation with a minimum potential profit of 100 pips.
Risk/Reward : 1:5
Potential Duration: 3 to 7days
NB: This speculation might be considered to make individual decisions on the lower timeframe.
This is a long-term perspective and you might watch this space for speculation on lower time frames as price action is been monitored.
Risk Disclaimer:
Margin trading in the foreign exchange market (including commodity trading, CFDs, stocks etc.) has a high risk and is not suitable for all investors. The content of this speculation (including all data) is organized and published by me for the sole purpose of education and assistance in making independent investment decisions. All information herein is for your reference only and I take no responsibility.
You are hereby advised to carefully consider your investment experience, financial situation, investment objective, risk tolerance level, and consult your independent financial adviser as to the suitability of your situation prior to making any investment.
I do not guarantee its accuracy and is not liable for any loss or damage which may result directly or indirectly from such content or the receipt of any instruction or notification therewith.
Past performance is not necessarily indicative of future results.
NZD/USD BUY OPPUTUNITY VIEW .......
AronnoFX will not accept any liability for loss or damage as a result of
reliance on the information contained within this channel including
data, quotes, charts and buy/sell signals
If you like this idea, do not forget to support with a like and follow.
Traders, if you like this idea or have your own opinion about it,
write in the comments. I will be glad

NZDUSD | Perspective for the new week | Follow-up detailFollowing the fulfilment of a 120pips move in our direction (see link below for reference purposes), we witnessed a correction back into our precious key zone @ $0.71000 - a significant zone (Neckline of Double Top pattern on the weekly chart) for sellers with another opportunity to short the Kiwi against the Dollar in the coming week.
As the Kiwi continues to trade below $0.70000 after US inflation data, I anticipate a further breakdown of demand level in the coming week after observing the rate at which sellers continue to push the price down into the middle of the rectangle thereby revealing weakness in the value of the Kiwi ahead of US Nonfarm payrolls.
Tendency: Downtrend (Bearish)
Structure: Supply & Demand | Channel (Bearish rectangle)
Observation: i. Price has been caught within a 130pips range since mid - June 2021 to form a Bearish rectangle pattern.
ii. The price appears to have paused during a strong downtrend and temporarily keeps bouncing between two parallel levels $0.70500/0.69000 in the last 40days with anticipation of a trend continuation in the nearest future.
iii. The appearance of a Bearish rectangle at this juncture in the market might be seen as a bearish continuation pattern with extension into a 61.8/78.6% retracement of Impulse leg on the weekly chart (see weekly chart below for reference purposes).
iv. Price action has been at Key level @ $0.71000/0.70000 been at the Neckline of a Double Top pattern cited on the weekly chart (see chart below) is also a feat suggesting bearish possibilities.
v. In this regard and considering the bullish expectation in the long term perspective, our confirmation shall remain below Key level to be confident in this trade with opportunities to add position at break down of Demand zone... Trade consciously!😊
Trading plan: BUY confirmation with a minimum potential profit of 200 pips.
Risk/Reward : 1:4.5
Potential Duration: 4 to 8days
NB: This speculation might be considered to make individual decisions on the lower timeframe.
Watch this space for updates as price action is been monitored.
Risk Disclaimer:
Margin trading in the foreign exchange market (including commodity trading, CFDs, stocks etc.) has a high risk and is not suitable for all investors. The content of this speculation (including all data) is organized and published by me for the sole purpose of education and assistance in making independent investment decisions. All information herein is for your reference only and I take no responsibility.
You are hereby advised to carefully consider your investment experience, financial situation, investment objective, risk tolerance level, and consult your independent financial adviser as to the suitability of your situation prior to making any investment.
I do not guarantee its accuracy and is not liable for any loss or damage which may result directly or indirectly from such content or the receipt of any instruction or notification therewith.
Past performance is not necessarily indicative of future results.

NZDUSD | Perspective for the new week | Follow-up detailsSince my last publication on this pair (see link below for reference purposes; the price has moved a little above 50pips in our direction as we witnessed a transition into a consolidation phase which also explains the doubt/indecision in the market in the last 3 weeks. Despite observing multiple rejections from the $0.69200 area in the last week, I suspect that the Greenback is setting up for strong gains in the coming week(s).
Tendency: Downtrend (Bearish)
Structure: Supply & Demand | Reversal pattern (Double Top) | Trendline
Observation: i. The Bearish Trendline (see weekly chart) reflects that price has been caught within a Bearish scope since late May 2021 with strong tendencies of a risk of further decline for the Kiwi in the coming week(s).
ii. Conspicuously, multiple rejections of $0.70400 making a confluence with the Bearish Trendline during last week trading session validates my plan to shorting the Kiwi.
iii. Double Top: The appearance of an extremely bearish technical reversal pattern after the price reached a peak two consecutive times ($0.70450 & $0.70390 respectively) with a moderate decline between the two highs further support a Bearish bias as I look forward to a Breakdown/Retest of Bullish Trendline (indicated on shart) in the coming week.
iv. Please note that below the Key level @ $0.70100 remains a yardstick to shorting.
v. A Breakdown/Retest of Neckline @ $0.69750 might welcome addition to the existing position.
vi. And a successful Breakdown/Retest of $0.69200 ( a level that held price "supported" in the last week) might be the straw that will break the camel's back for significant sell continuation.
vii. CAUTION : A breakout and retest of the $0.70400 area shall render the narrative invalid and I shall be switching position for a rally!... Trade consciously!😊
Trading plan: SELL confirmation with a minimum potential profit of 120 pips.
Risk/Reward : 1:6
Potential Duration: 2 to 5days
NB: This speculation might be considered to make individual decisions on the lower timeframe.
Watch this space for updates as price action is been monitored.
Risk Disclaimer:
Margin trading in the foreign exchange market (including commodity trading, CFDs, stocks etc.) has a high risk and is not suitable for all investors. The content of this speculation (including all data) is organized and published by me for the sole purpose of education and assistance in making independent investment decisions. All information herein is for your reference only and I take no responsibility.
You are hereby advised to carefully consider your investment experience, financial situation, investment objective, risk tolerance level, and consult your independent financial adviser as to the suitability of your situation prior to making any investment.
I do not guarantee its accuracy and is not liable for any loss or damage which may result directly or indirectly from such content or the receipt of any instruction or notification therewith.
Past performance is not necessarily indicative of future results.

NZD/USD SHORT SELL OPPUTUNITY now......
💹NZD/USD ⏬SELL @ 0.72772
✅TP-1# 0.72400
✅TP-2# 1.71994
AronnoFX will not accept any liability for loss or damage as a result of
reliance on the information contained within this channel including
data, quotes, charts and buy/sell signals
PLZ! LIKE COMMAND AND SHARE
Traders, if you like this idea or have your own opinion about it,
write in the comments. I will be glad

NZDUSD Got Rejected From a Strong resistance Zone
Welcome back Traders, Investors, and Community!
Hi Traders, NZDUSD on H1 has got a Rejection at 0.7095 which is a strong Resistance zone by several long wicked candles, I’m expecting it to go lower.
⬇️Sell now or Sell at 0.7095
⭕️SL @ 0.7116
✅TP1 @ 0.705
✅TP2 @ 0.7024
✅TP3 @ 0.6956
We will have more FREE forecasts in TradingView soon
❤️ Your Support is really appreciated!❤️
Have a Profitable Day

NZDUSD | Perspective for the week | Follow upWe experienced over 250pips move in our direction since my last publication on this pair (see link below for reference purposes) and I suspect that price-action is going through a Correction phase that we are yet to decipher when it will stall.
Last week trading session saw the Kiwi close in the positive territory for four straight days and continued to find higher highs that culminated at $0.7070 on Friday. Market participants still remain optimistic for the Greenback ahead of the June Nonfarm Payrolls report. At the time being, market expectations point to a 600,000 increase in the headline number, while the unemployment rate is foreseen contracting from 5.8% to 5.7%.
Tendency: Downtrend (Bearish)
Structure: Breakdown | Supply & Demand | Harmonic pattern (AB = CD)
Observation: i. Since hitting a peak at $0.74500 on February 25th 2021, the price continued to find lower lows hereby transposing into what looks like a Descending channel.
ii. DESCENDING CHANNEL: Connecting the lower highs and lower lows of price action with parallel trendlines reveals the prevailing downward trend since February 2021.
iii. A successful Breakdown of $0.71200 on the 16th of June 2021 confirms the Bearish momentum.
iv. With the current structure, Correction phase is happening and I am yet to decipher where and when it will stall in anticipation of a decline continuation.
v. In this regards, I have identified a selling niche around $0.71000/0.78000 area.
vi. I expect a transition into a Harmonic pattern (AB = CD) in the coming week with parameters explained below;
a. Impulse A-to-B is expected to be in harmony with the potential C-to-D leg.
b. The B- to-C leg is expected to fall around 61.8% with the potentials of extending to 78.6% Fibonacci retracement of the A-to-B leg.
c. The C-to-D leg is expected to fall within 127.2 - 1.414% Fib. ext . of the A-to-B @ $0.68000 area.
iv. Should price refuse to climb into the selling niche, anywhere below my Key level remains a yardstick for selling opportunity in the coming week(s).
v. A Further plunge below $0.69400 (breakdown/retest) might welcome addition to the existing position.... Trade consciously! 😊
Trading plan: SELL confirmation with a minimum potential profit of 250 pips.
Risk/Reward : 1:5
Potential Duration: 7 to 15days
NB: This speculation might be considered to make individual decisions on the lower timeframe.
Watch this space for updates as price action is been monitored.
Risk Disclaimer:
Margin trading in the foreign exchange market (including commodity trading, CFDs, stocks etc.) has a high risk and is not suitable for all investors. The content of this speculation (including all data) is organized and published by me for the sole purpose of education and assistance in making independent investment decisions. All information herein is for your reference only and I take no responsibility.
You are hereby advised to carefully consider your investment experience, financial situation, investment objective, risk tolerance level, and consult your independent financial adviser as to the suitability of your situation prior to making any investment.
I do not guarantee its accuracy and is not liable for any loss or damage which may result directly or indirectly from such content or the receipt of any instruction or notification therewith.
Past performance is not necessarily indicative of future results.


NZDUSD | Perspective for the new week | Follow-upWith approximately 300pips move in our direction since my last publication on this pair (see link below for reference purposes); It appears we are at a juncture for a trading opportunity in the market as I suspect a risk of further decline for the Kiwi as Breakdown/Retest of Neckline which is also my Key level @ $0.71500 becomes imminent.
The US Bureau of Labor Statistics reported on Friday that Nonfarm Payrolls rose by 559,000 in May and despite figures reported to be below expectations, the Greenback appears to be on the verge of soaring in the nearest future.
Tendency: Downtrend (Bearish)
Structure: Breakdown | Supply & Demand | Harmonic pattern (AB = CD)
Observation: i. The $0.7300 area appears to be a very strong supplication area since the beginning of the year 2021 as an attempt from buyers to break above this level in February was followed by an emphatic bearish run that lasted a whole month!
ii. It is also obvious that the $0.73000 level became a stalling zone (approximately 61.8% retracement of AB leg) for the correction of the Impulse leg AB as it was met with multiple rejections hereby emphasizing the strength of sellers at this juncture.
iii. In this regard, I shall look forward to a transition into an ABCD pattern with parameters explained below;
a. Impulse A-to-B is expected to be in harmony with the potential C-to-D leg.
b. The B- to-C leg is currently at 61.8% Fibonacci retracement (with the possibility of a 78.6%) of the A-to-B leg.
c. The C-to-D leg is expected to fall within 127.2 - 1.414% Fib. ext . of the A-to-B move @ $0.67500.
iv. The Breakdown of $0.71000 (Demand zone) in March 2021 reveals that sellers are beginning to creep in at this level for future investment in the Greenback.
v. This critical observation led to the identification of a New Supply level of around $0.72000/0.71500 for a future selling opportunity.
vi. Conscious trading shall anticipate a Breakdown/Retest of Key level @ $0.71500 in the coming week for confirmation.
Trading plan: SELL confirmation with a minimum potential profit of 300 pips.
Risk/Reward : 1:5
Potential Duration: 5 to 10days
NB: This speculation might be considered to make individual decisions on the lower timeframe.
Watch this space for updates as price action is been monitored.
Risk Disclaimer:
Margin trading in the foreign exchange market (including foreign exchange trading, CFDs, etc.) has a high risk and is not suitable for all investors. The content of this speculation (including all data) is organized and published by me for the sole purpose of education and assistance in making independent investment decisions. All information herein is for your reference only and I take no responsibility.
You are hereby advised to carefully consider your investment experience, financial situation, investment objective, risk tolerance level, and consult your independent financial adviser as to the suitability of your situation prior to making any investment.
I do not guarantee its accuracy and is not liable for any loss or damage which may result directly or indirectly from such content or the receipt of any instruction or notification therewith.
Past performance is not necessarily indicative of future results.

NZDUSD | Perspective for the new week Kiwi clung to early gains during the Friday trading session which is represented on the chart with a Bullish engulfing candle from the $0.70100 level and it does not appear it is ready to let go in the nearest future considering the obvious - we are in a long term Bullish perspective (see weekly chart below)!
The Greenback has been on a pedestal from mid-February 2021 till last month (March 2021) when it appears to have lost the momentum and found Bottom @ $0.69500 which was immediately followed by Higher Highs that resulted in a Breakout of my Key level @ $0.70250 during last week trading session; A feat that signifies the completion of a simple reversal set-up paving the way for possible gains in the coming week(s) amidst falling US Treasury bond yields.
Tendency: Uptrend ( Bullish )
Structure: Breakout | Supply & Demand | Reversal pattern (Double Bottom)
Observation: i. The appearance of a Double Bottom pattern on the chart describes the reversal or change in trend and momentum from prior leading price action.
ii. Breakout of Key level @ $0.70250 during last week trading session is a clue that Buyers are gradually gaining momentum and strength at this juncture in the market.
iii. A Bullish engulfing candle appearing at the $0.70250 zone (1st of April 2021) which has been a Supplication area in the last 10 days signals that market participants are tending towards changing preference to support the Kiwi.
iv. There is a possibility that price might do a correction after the Neckline Breakout that might dip into $0.69850/0.70300 zone - a new Demand level for future buys.
v. This been said, conscious traders might be patient to confirm sellers are no more viable at this juncture in the market by waiting for a Breakout/Retest of $0.70400 (Supplication area) to join the rally... Trade consciously :)!
Trading plan: BUY confirmation with a minimum potential profit of 350 pips.
Risk/Reward : 1:8
Potential Duration: 7 to 12days
NB: This speculation might be considered to make individual decisions on the lower timeframe.
Watch this space for updates as price action is been monitored.
Risk Disclaimer:
Margin trading in the foreign exchange market (including foreign exchange trading, CFDs, etc.) has a high risk and is not suitable for all investors. The content of this speculation (including all data) is organized and published by me for the sole purpose of education and assistance in making independent investment decisions. All information herein is for your reference only and I take no responsibility.
You are hereby advised to carefully consider your investment experience, financial situation, investment objective, risk tolerance level, and consult your independent financial adviser as to the suitability of your situation prior to making any investment.
I do not guarantee its accuracy and is not liable for any loss or damage which may result directly or indirectly from such content or the receipt of any instruction or notification therewith.
Past performance is not necessarily indicative of future results.


NZDUSD | Perspective for the new week | Follow-upPrice continues to play out in accordance with expectations as it moved over 300pips in our direction since my last publication (see link below for reference purposes). As the majority foretell a risk of further decline in the Kiwi in the coming week(s), I beg to take the opposite direction and maintain a Bullish bias on this pair.
Tendency: Uptrend ( Bullish )
Structure: Breakout | Supply & Demand | Harmonic (AB = CD) pattern
Observation: i. In the last 13 weeks, Buyers have found a niche around NZ$0.71000/0.70500 hereby making this area a strong Demand level.
ii. We have experienced a sharp decline in price in the last two weeks after the Kiwi hit a peak of NZ$0.74650 in late Feb. 2021.
iii. At this juncture in the market, it is impossible to ignore the pattern the decline has formed on its way down to the Demand zone - a Harmonic (AB = CD) structure.
iv. ABCD pattern with parameters explained below;
a. Leg A-to-B appears to be in harmony with the C-to-D leg.
b. The B- to-C leg falls at 38.2% Fibonacci retracement of the A-to-B leg.
c. The C-to-D leg is expected to fall within 127.2 - 1.414% Fib. ext. of the A-to-B move @ NZ$0.71000/0.70500 area.
iv. Considering the stronghold of NZ$0.71000/0.70500 area by buyers in the past, the AB = CD pattern makes a "good" reversal set-up at this juncture in the market as I anticipate a Breakout/Retest of my Key level @ NZ$0.71850 to join the rally (any area above Demand area is good for me).
v. If the price moves as expected and reaches the Supply zone, It is advisable to lock in profit to avoid getting caught up with selling pressure and note that a further Breakout of NZ$0.73000 might confirm a rally continuation.
Trading plan: BUY confirmation with a minimum potential profit of 150 pips.
Risk/Reward : 1:3
Potential Duration: 4 to 10days
NB: This speculation might be considered to make individual decisions on the lower timeframe.
Watch this space for updates as price action is been monitored.
Risk Disclaimer:
Margin trading in the foreign exchange market (including foreign exchange trading, CFDs, etc.) has a high risk and is not suitable for all investors. The content of this speculation (including all data) is organized and published by me for the sole purpose of education and assistance in making independent investment decisions. All information herein is for your reference only and I take no responsibility.
You are hereby advised to carefully consider your investment experience, financial situation, investment objective, risk tolerance level, and consult your independent financial adviser as to the suitability of your situation prior to making any investment.
I do not guarantee its accuracy and is not liable for any loss or damage which may result directly or indirectly from such content or the receipt of any instruction or notification therewith.
Past performance is not necessarily indicative of future results.

NZDUSD | Perspective for the new weekWe did not get to see a rejection of our neckline in my last publication (see link below for reference purposes) as the price continues to find new highs. Since the beginning of the year 2021; price has consistently been dominant above the Key level with tendencies of finding new highs as price breaks out of Bearish trendline.
Tendency: Uptrend ( Bullish )
Structure: Trendline | Breakout | Supply & Demand
Observation: i. A successful Breakout of Trendline (20th Jan 2021) followed by a rejection of this line 8 days after is a sign that we might be on to experience a temporary/permanent rally soon.
ii. The rejection of Bearish trendline shall be a yardstick to look for buying opportunity in the coming week.
Trading plan: BUY confirmation with a minimum potential profit of 150 pips.
Risk/Reward : 1:3
Potential Duration: 2 to 6 days
NB: This speculation can be considered to make decisions on lower timeframes.
Watch this space for updates as price action is been monitored.
Risk Disclaimer:
Margin trading in the foreign exchange market (including foreign exchange trading, CFDs, etc.) has a high risk and is not suitable for all investors. The content of this speculation (including all data) is organized and published by me for the sole purpose of education and assistance in making independent investment decisions. All information herein is for your reference only and I take no responsibility.
You are hereby advised to carefully consider your investment experience, financial situation, investment objective, risk tolerance level, and consult your independent financial adviser as to the suitability of your situation prior to making any investment.
I do not guarantee its accuracy and is not liable for any loss or damage which may result directly or indirectly from such content or the receipt of any instruction or notification therewith.
Past performance is not necessarily indicative of future results.

NZDUSD | Perspective for the new weekIt is fascinating to see how the Key level @ $0.71600 appears to be a decision-maker for traders in the last 30days as Breakdown/Breakout of this level points at the prevailing direction of the price. Looking beyond this... We are now at a juncture in the market where the chart formation that predicts a bullish-to-bearish trend reversal becomes a unique tool for us to make a trading decision.
On the chart is a baseline with three peaks, with the outside two close in height and the middle is highest (Head and Shoulder).
Tendency: Downtrend ( Bearish )
Structure: Reversal pattern (H & S) | Breakdown | Supply & Demand
Observation: i. After making a peak @ $0.73100, Price have continue to risk further decline as it keeps finding Lower Lows.
ii. A significant breakdown of my Key Level @ $0.71600 (Neckline) last week confirms the completion of a Head and Shoulder pattern.
iii. My attention in the coming week shall be shifted to Selling opportunities and the Neckline area shall be the risk limit.
Trading plan: SELL confirmation with a minimum potential profit of 200 pips.
Risk/Reward : 1:5
Potential Duration: 5 to 10 days
NB: This speculation can be considered to make decisions on lower timeframes.
Watch this space for updates as price action is been monitored.
Risk Disclaimer:
Margin trading in the foreign exchange market (including foreign exchange trading, CFDs, etc.) has a high risk and is not suitable for all investors. The content of this speculation (including all data) is organized and published by me for the sole purpose of education and assistance in making independent investment decisions. All information herein is for your reference only and I take no responsibility.
You are hereby advised to carefully consider your investment experience, financial situation, investment objective, risk tolerance level, and consult your independent financial adviser as to the suitability of your situation prior to making any investment.
I do not guarantee its accuracy and is not liable for any loss or damage which may result directly or indirectly from such content or the receipt of any instruction or notification therewith.
Past performance is not necessarily indicative of future results.

NZDUSD SELL ON DIPSAs i can see this pair is making a H & S pattern and had already done a break on strong support zone which is now not valid
now are looking for the given TP incoming week Friends push like and comments we love and appreciate ur comments
Follow us for more updates to stay alert

NZD/USD EWT on the Hourly and 15m TimeframeNZD/USD made the bullish Elliott wave pattern. I have shown this on both the time frame hourly (Left) and 15m (Right). It started on the 21st of December 2020, and the 5th wave is remaining. It has to cross 0.7226 - 0.7236 -0.7260 , to make the fifth wave.

Will NZD/USD Break the HurdleHere's the 1H chart of the NZD/USD. And it's moving downwards. Here, I have applied the indicators - Volume, Stoch RSI, and RSI.
RSI and Stoch RSI both are showing a downtrend. It's falling in the uptrend. It will fall up to support. If the trend breaks the support, it will hit the hurdle( 0.7136 ). If it breaks the hurdle( 0.7136 ), then the target will be the following 0.7116 - 0.7088 .
But, if NZD/USD takes a U-turn and starts to move upwards, it will hit 0.7216 .

