SPX Top Down Analysis 9/27/22We are trading within a range near the most recent low on the daily after a big move to the downside. Definitely still overall bearish but we are trading into HTF points of interest to the downside, basically buy to sell setup's in the making. Missed the trade yesterday off of the range high but that's okay. Lots of news today so I won't be so quick to pull the trigger and just be more reactive today.
7:30am
USD
Fed Chair Powell Speaks
8:30am
USD
Core Durable Goods Orders m/m
0.3% 0.2%
USD
Durable Goods Orders m/m
0.1% -0.1%
9:00am
USD
HPI m/m
0.0% 0.1%
USD
S&P/CS Composite-20 HPI y/y
17.1% 18.6%
9:35am
GBP
MPC Member Pill Speaks
9:55am
USD
FOMC Member Bullard Speaks
10:00am
USD
CB Consumer Confidence
104.0 103.2
USD
New Home Sales
500K 511K
USD
Richmond Manufacturing Index
-10 -8
OB

SPX 9/26/22 No new entries so far So far no new entries on anything today and I'll probably leave it that way. We have had a confirmed response to the +OB and the +FVG after opening up the week to the downside. That said, we are still heavy and holding within a range (3704.10-3657.90) for now.
10:00am
USD
FOMC Member Collins Speaks
4:00pm
USD
FOMC Member Mester Speaks
These two news events are going to likely drive us for the day so I'll likely hold on for those and look for a response to whatever POI we are near at those given times.
SPX

SPX setup 9/23/22Looking for a retracement at this area for rejection and continuation.
No reason for us to move higher than this but if we do the A/S range left a FVG, an -OB, TDO, and the daily open as supply.
Going to be waiting for the times & sales to show the entry. The pass few days NAS has shown all the order flow except for the afternoon entry on SPX.
Projected low from daily fib level
End of the week so the risk will be reduced and no trades will be at a risk of more than 0.25% for the total of all trades entered.

SPX EOD day order flowWe got a sell off at the end of the day to close out today.
Just before the close, we had an order to the down side of over 70k between the daily open, the -FVG(L) price 3790, and a small -OB
At the level we saw definite follow through from that point on and near the daily lows at 3748.50

SPX neutral with a bias to the downsideAfter yesterday's drop that hit my 3770 target, we are holding near the weekly lows in discount. On the LTF the buying started in A/S sessions on through London session to take out some on the short term price imbalances.
Last POI was a reaction off of a -FVG that can be seen on the 15m and 1H charts. We will need to see if the fresh +FVG (not noted but its there on the same charts), the A/S session range, the DO, or the TDO holds up, else we continue down for the day. There's even a +OB at the 2:30 candle on the 15m, so I'll definitely be watching out for these +POIs.
The unemployment claim release at 8:30 is a good catalyst for a decision on the move today and that's where I'll be focused in on. The forecast is for higher claims and I am in agreement with that but I'll be patient in my bias.
Terms:
LTF: Lower Time Frame
POI: Point Of Interest
A/S: Asian Sydney session
-FVG: Bearish Fair Value Gap
+FVG: Bullish Fair Value Gap
DO: Daily Open
TDO: True Day Open
+OB:Bullish Order Block

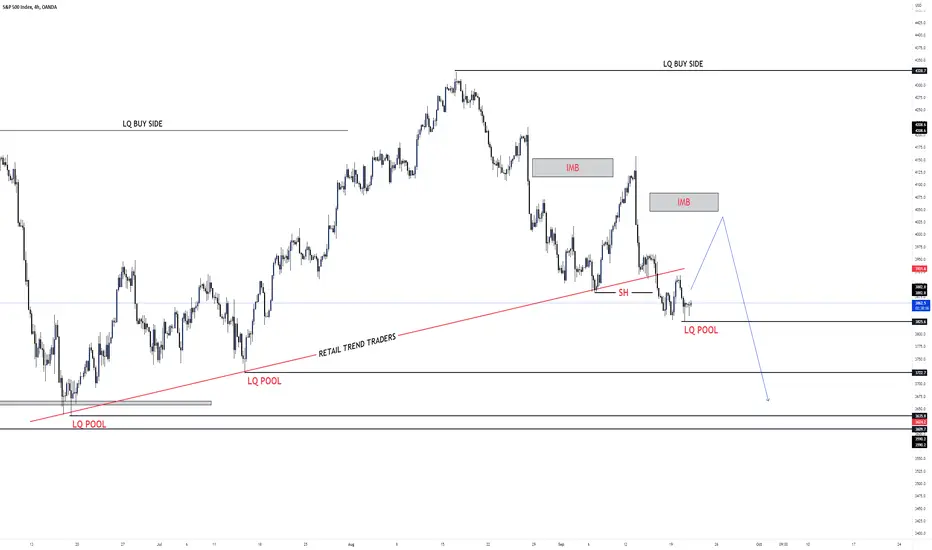
S&PUS500 SHORT TERM BUY TO SELL BIAS DRILLExpacting price to fill the IMB short term BUY and move for the low Resistance LQ pools on the down side or Expect BIG sell without refilling the IMB
SPX setup 9/20/22Trading inside yesterday's move up and near the weekly opening price.
Currently inside a 15m+FVG on no volume so I'll be paying attention to this area for the time being. The times and sales and level 2 aren't showing anyone big trading for now, so we wait.
I'm neutral to bullish for the short term but if we trade near the daily and the 15m-FVG and reject, I don't mind reversing the position in the opposite direction.

US30 into the Fed rate Light news week going into the Sunday opening until Wednesday when the interest rate is released. We could have one or two thing happen until the Wednesday release:
1) We see priced in data and a direction chosen into the lead up
2) We see price stall out until we enter the day into the rate release.
This is a market moving data release so this is one to take with precaution after the CPI data implied a 75-100 bp increase.

NAS 100 into the Fed Rate Light news week going into the Sunday opening until Wednesday when the interest rate is released. We could have one or two thing happen until the Wednesday release:
1) We see priced in data and a direction chosen into the lead up
2) We see price stall out until we enter the day into the rate release.
This is a market moving data release so this is one to take with precaution after the CPI data implied a 75-100 bp increase.

SPX trading into Fed rate releaseLight news week going into the Sunday opening until Wednesday when the interest rate is released. We could have one or two thing happen until the Wednesday release:
1) We see priced in data and a direction chosen into the lead up
2) We see price stall out until we enter the day into the rate release.
This is a market moving data release so this is one to take with precaution after the CPI data implied a 75-100 bp increase.

EURUSD LONG TRADE IDEAEURUSD just fell massively. A good level to look to buy is the 0.99740 to 0.99420 level. Target is the 1.00337 level. A short retracement is expected to happen at the stated levels. Hence looking to take advantage of the levels.


Gold. Its OB, And more importantly where its CHoCH? 9/Sept/22Gold. As a “contribution” to tradingview ( many thanks to tradingview for providing such a good free charting platform) community ( Today I’m going to share my own interpretation of OB ( order blocks), and most importantly where is the “exact “ location/pivot/level of CHoCH ( change of character)?. A concept with BOS ( break of structure) which has been used by advanced naked/ Price action trading traders without any indicators. . It will cut “novice traders” learning curve from 3-5 years even 10 years where they are searching for “holy grail “ trading system/indicators..The biggest question for this concept of trading will be “where” is the exact location of CHoCH? ( change of character = change of “previous underlying trend” )..The “ANSWER” is! = at subwave b of any last leg of impulsive wave which is wave 5. < p/s unlike conventional Elliottwave rule there is ONLY abc subwaves “inside” any impulsive wave..> Last but least many thanks to @makuchaku and @Efe for coding the such a great “super OrderBlock..” script/ indicator which help us/traders to “visualize “ where is OB, FVG Although we still need to find where is “CHoCH” “manually”..

Liquidity Taken, FVG on 5min, London Killzone, Sellside Aiming🔥GBPUSD today.. a beautiful setup that is highly probable.. consider it on your own risk...

EURUSD to the Ground, DXY to the Moon!I've called out stronger Dollar for months, and all targets have been reached. Go through my old posts to see previous markets being called out. And now, lets do it again... :)
DXY ANALYSIS:
Interest Rates:
The FED just raised the Interest Rates from 1,750 % up to 2,500 %. That gives us a Long-Term view on how Banks and Institutions are positioned in the marketplace.
The Interest Rates Market is the biggest and most important market, so that's why we follow it. It's like the father of all markets, whereas the forex market, stock market, futures market, crypto markets are its kids.
Bonds & Yields:
The Bond Market is inversely correlated with DXY.
Bonds just rebalanced and fully filled its Monthly Premium FVG. The Monthly candle also closed below a Bullish candle, and that Bullish candle should act as an OB for price to remain below.
If Bonds are poised to go Lower, Yields will increase. And price chases yield. I'm seeing the US30Y Yield reach up to 4,0 % and then potentially up to the equal highs at 4,852 %.
So in short:
I'm Bearish on the Bonds, and Bullish on the Yield - which both indicate that DXY will go higher.
Commodities :
Using the Gold Futures chart (GC1!), I'm expecting the Equal Lows to get taken out to at least around 1680.
If Golds go DOWN, DXY will then go UP...
(I didn't include the Bond Market/Yield, nor Golds in this chart as it took up too much space on the chart. Go to your own chart yourself and you'll see what I'm pointing at in these markets).
DXY :
On DXY chart, next target is a FVG where we might see some sensitivity, and should it get breached to the upside - the next target for DXY is the Equal Highs (they also have a LRLR signature, meaning itæs easy to go to and through them).
123.00 looks like a good area to sweep. I'd be content with that.
-------
EURUSD:
Obviously, EURUSD and DXY are inversely correlated. So when one goes up the other one goes down.
So again, I have a strong bias for DXY to go UP, which means EURUSD should go DOWN...
Nice Sellside Liquidity Pool at 0.83540. I wanna see it sweep and reach down into 0,8000.
As of from today where price currently is, I have a 2100+ pip target for EURUSD.
...
So travel to USA before it's too late when the Dollar is super expensive lol


GTC/USDT 15 LONG SETUP😎😍HIIII 😎
This is my opinion. I hope it reaches the second target as well.
what do you think?

$EURGBP SHORT. 3D INTO OB. EurGbp short plan entry here with stop loss & target.
3 drives into strong 4h resistance.
Setup taken on the 30m tf.

#analysis 73 - Run into the weekendSo now we had this breakout of the range. As usual, won't do much on the weekend till Monday range forms.
As the price hangs in the middle of two liquidity pockets, I don't have a bias now. But from the Fibonacci extension the target is still far down. So maybe it will run to the bottom to H1 liquidity pockets down below about 18.5k - 19k.
But for the upside bias, I think only if it ranges for a short period of time here or below, will it run up. For this I look forward to shorting at around 21.6k. It depends on the PA in near future.

GJ Long 15 Min. TF First looking for OB to be filled down below, if we can respect the area without breaking below the Gann box, I will take a long entry up to the top of the previous Asia session high.

BTCUSDTJust chart analysis. Not for buy or sell.
Retail traders - retail traders, technical analysis traders.

AU shortBOS on 15 minute, looking for price to retrace to either void above before taking a short down to fill the asia session.

#analysis 59 - Weekends endSo the weekend has finally come to an end, and we can see there's not much altcoin flied far. Now Bitcoin has come to a consolidation phase.
Not pretty sure how it go, so flat now. But I did check the chart of FTT. It seems that pretty good if we reach the lower part inside the range. Look forward to going to the range high if we made a bounce down below. However, the SL should be at around the range low, not below the OB for safety.
Why?
The range low has already tested for 3 times, which is not pretty good for general cases. Also, now not pretty sure how Bitcoin go in the new week. We'll set it when Monday ends.
So let's take a rest for another day.
