CRUDE OIL Risky Long! Buy!
Hello,Traders!
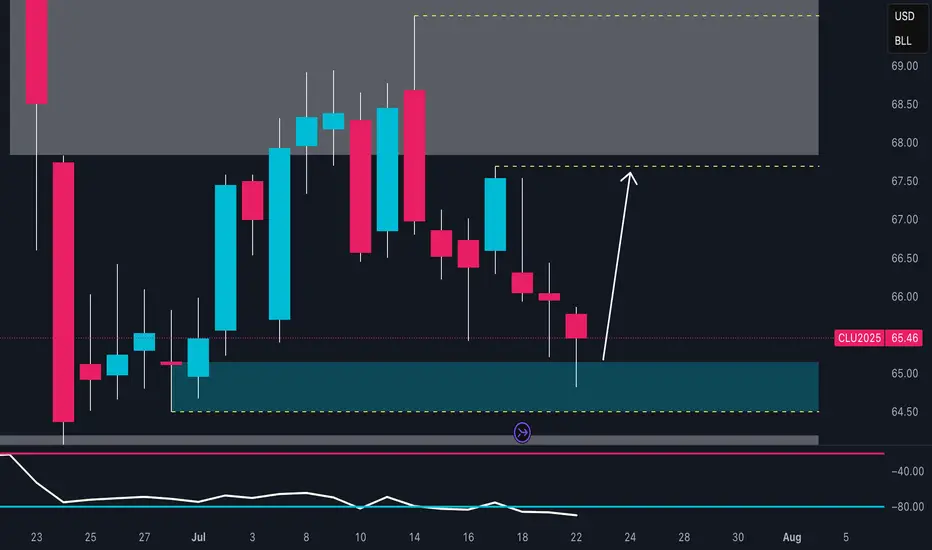
CRUDE OIL will soon hit
A horizontal support
Of 64.50$ and as it is
A strong level we will be
Expecting a local bullish
Rebound on Monday
Buy!
Comment and subscribe to help us grow!
Check out other forecasts below too!
Disclosure: I am part of Trade Nation's Influencer program and receive a monthly fee for using their TradingView charts in my analysis.
Oil

USOILBullish senaorio
"BUY Call / Long – Strong upside trend across most timeframes, supported by disrupted supply, elevated oil prices due to real production losses, and renewed geopolitical risk."

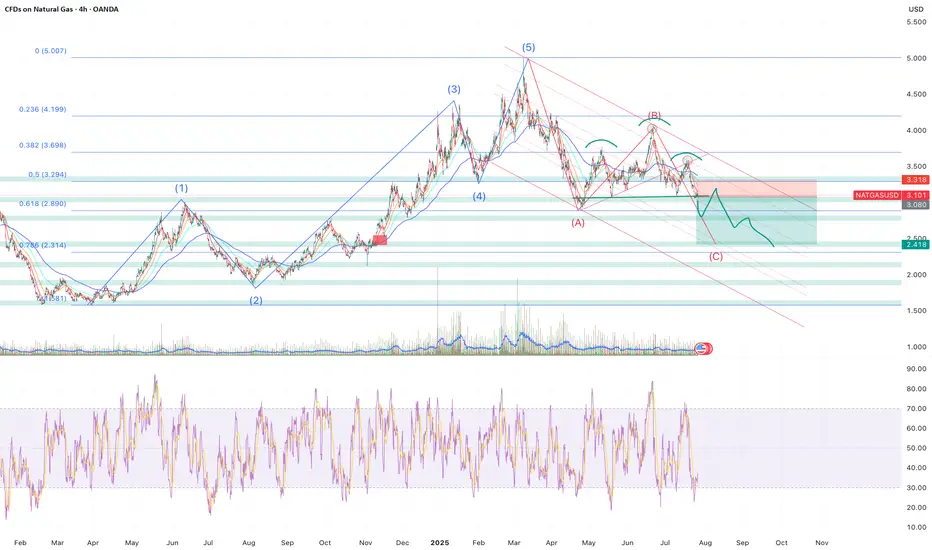
Sell NATGAS into OCT/NOVNatalie has fromed a H&S and has broke through all of the supporting EMAs leading to most of the indicators turning bearish.
My approach for the forseeable is seeling bounces until the winter season approaches.
Of course Natalie is extremely susceptible to trend changes due to economical data and has to be monitored closely. Currenlty I'm a bear.
Only selling once it breaks and retests, where I will once again reasses based on economics such as storage, production, imports and demand.
Target around $2.5 where interestingly a gap (red rectangle) sits from Nov - 24.
Elliot Wave (although not a great fan) kind of aligns as well as the 0.786 fib level which began forming at the beginning of 2024.
Storage | Volatility | Price Outlook
U.S. natural gas markets are stabilizing as volatility trends back toward seasonal norms.
📉 Volatility has dropped from 81% in Q4 2024 to 69% in mid-2025
🏪 Storage is currently at 3,075 Bcf,
🔻 4.7% lower YoY
🔺 5.9% higher than the 5-year average
🚢 LNG exports remain strong—up 22% YoY and 74% above the 5-year average
🔌 Domestic demand is seasonally weaker but steady
➡️ Despite being below last year’s levels, storage surplus vs. the 5-year average acts as a soft ceiling on price.
➡️ Historical analogs suggest a fair value range between $2.50–$3.20/MMBtu in the short term.
📊 Current price action around $3.00–$3.40 looks slightly overheated unless a fresh catalyst emerges (heatwave, export spike, etc.).
🧭 Watching for:
Injection trends over the next few weeks
Cooling demand in power sector
Resistance around $3.40
Support near $2.80
CRUDE OIL REBOUND AHEAD|LONG|
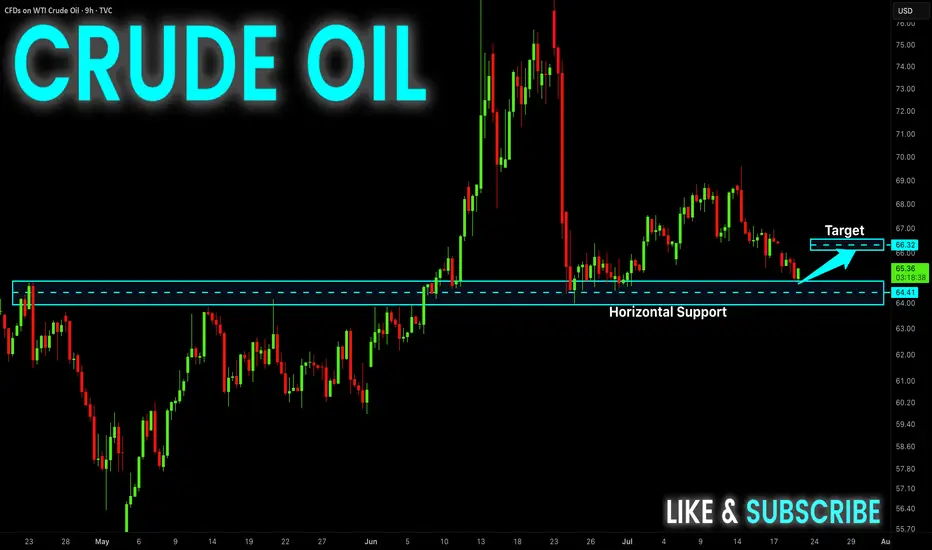
✅CRUDE OIL is going down now
But a strong support level is ahead at 64.69$
Thus I am expecting a rebound
And a move up towards the target of 65.50$
LONG🚀
✅Like and subscribe to never miss a new idea!✅
Disclosure: I am part of Trade Nation's Influencer program and receive a monthly fee for using their TradingView charts in my analysis.

USOIL: Long Trade with Entry/SL/TP
USOIL
- Classic bullish setup
- Our team expects bullish continuation
SUGGESTED TRADE:
Swing Trade
Long USOIL
Entry Point - 65.00
Stop Loss - 64.67
Take Profit - 65.55
Our Risk - 1%
Start protection of your profits from lower levels
Disclosure: I am part of Trade Nation's Influencer program and receive a monthly fee for using their TradingView charts in my analysis.
❤️ Please, support our work with like & comment! ❤️
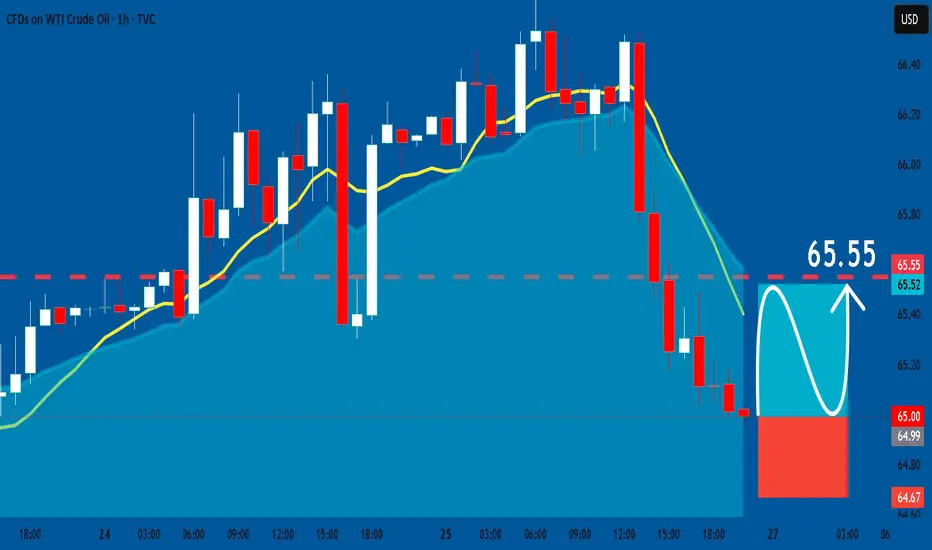
USOIL: Next Move Is Up! Long!
My dear friends,
Today we will analyse USOIL together☺️
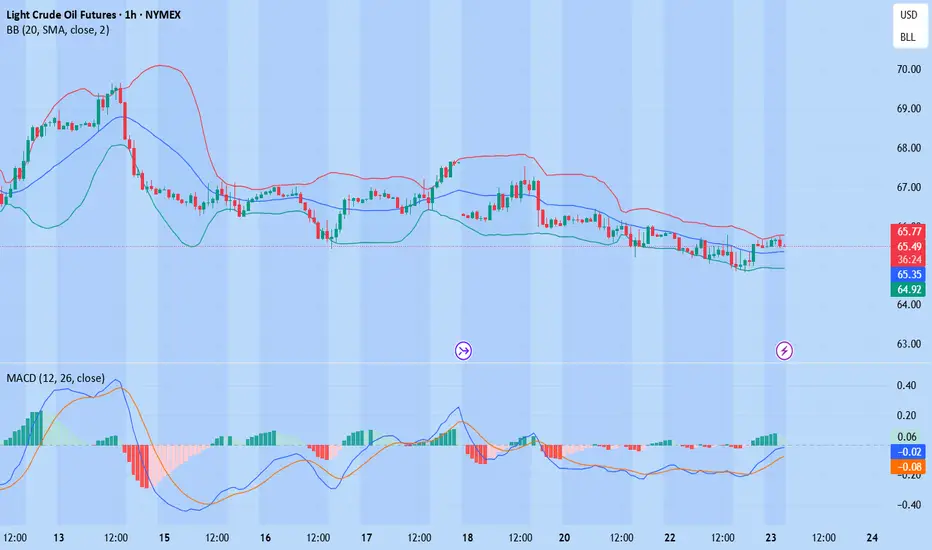
The market is at an inflection zone and price has now reached an area around 65.029 where previous reversals or breakouts have occurred.And a price reaction that we are seeing on multiple timeframes here could signal the next move up so we can enter on confirmation, and target the next key level of 65.579.Stop-loss is recommended beyond the inflection zone.
❤️Sending you lots of Love and Hugs❤️
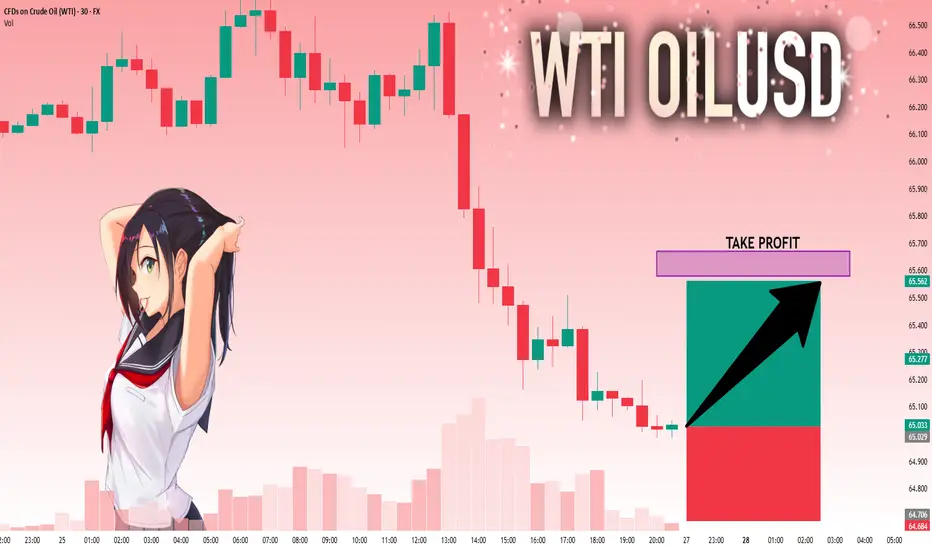
USOIL My Opinion! BUY!
My dear friends,
Please, find my technical outlook for USOIL below:
The instrument tests an important psychological level 65.00
Bias - Bullish
Technical Indicators: Supper Trend gives a precise Bullish signal, while Pivot Point HL predicts price changes and potential reversals in the market.
Target - 65.50
Recommended Stop Loss - 64.75
About Used Indicators:
Super-trend indicator is more useful in trending markets where there are clear uptrends and downtrends in price.
Disclosure: I am part of Trade Nation's Influencer program and receive a monthly fee for using their TradingView charts in my analysis.
———————————
WISH YOU ALL LUCK
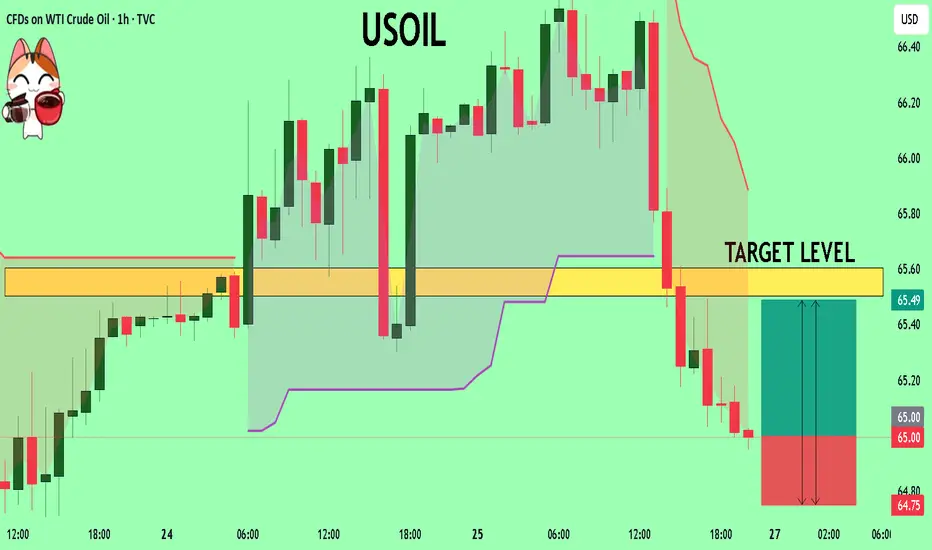
USOIL LONG FROM SUPPORT
USOIL SIGNAL
Trade Direction: long
Entry Level: 65.00
Target Level: 66.37
Stop Loss: 64.09
RISK PROFILE
Risk level: medium
Suggested risk: 1%
Timeframe: 2h
Disclosure: I am part of Trade Nation's Influencer program and receive a monthly fee for using their TradingView charts in my analysis.
✅LIKE AND COMMENT MY IDEAS✅

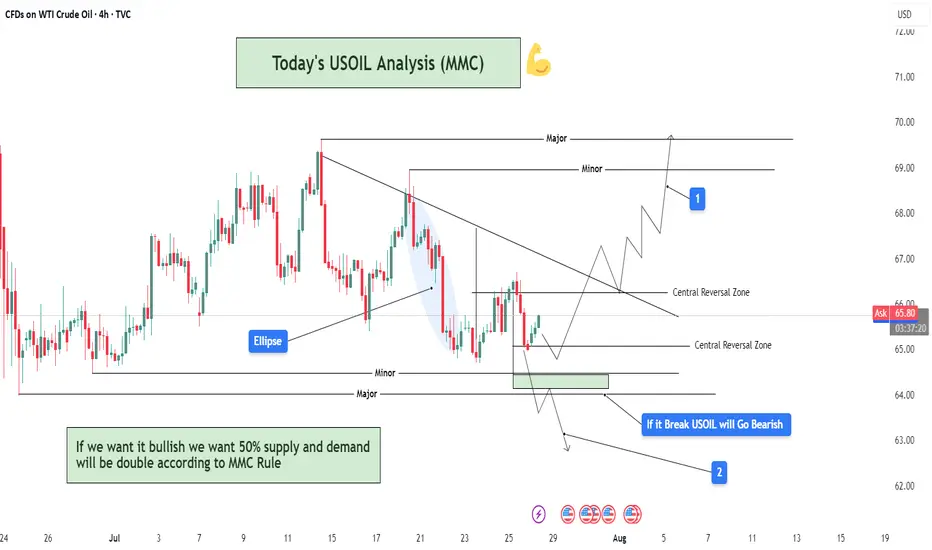
USOIL Analysis : MMC Bullish Setup Building on USOIL – Target🧠 Introduction & Trade Philosophy
In today’s 4H USOIL chart analysis, we are at a critical decision-making zone, where price action is preparing to make a major move in either direction, based on the response to a central demand zone. We are applying the MMC Rule, which emphasizes mirroring supply-demand behavior and validating market moves through structural confirmation.
The current price structure presents a classic MMC scenario, where price must either confirm a bullish double demand reaction or invalidate the setup by breaking the key zone and moving bearish.
📍 Chart Structure Explained
🔷 1. Central Reversal Zones (CRZs)
There are two CRZs highlighted:
The upper CRZ around 65.90–66.20, where price was previously rejected.
The lower CRZ, where price is currently consolidating, is around 64.80–65.50.
These zones are liquidity-rich areas where big players react—either by absorbing positions or driving directional moves.
🟢 2. Bullish Scenario – MMC Rule In Play (Path 1)
"If we want it bullish, we want 50% supply and demand will be double according to MMC Rule"
According to MMC, a bullish move must be confirmed by a strong reaction from demand, showing double the pressure of the last bearish move. Here's how that plays out:
Price respects the lower CRZ, bouncing near the 65.00 mark.
If this bounce gains momentum and breaks above the trendline resistance, the first target is the minor resistance at $69.00, followed by the major resistance zone near $70.50–$71.00.
A retest of broken structure, followed by bullish continuation, is expected. This is marked with the white zigzag projection labeled as “1” on the chart.
Watch for a clear higher high formation, which would indicate a shift in structure and validate bullish momentum.
🔻 3. Bearish Scenario – Breakdown Confirmation (Path 2)
"If it breaks, USOIL will go bearish"
If price fails to hold the current demand and closes below $64.80–64.50, it signals that demand has been absorbed, and MMC reversal has failed. In that case:
A clean breakdown below the demand zone will confirm bearish control.
The next downside target becomes $62.00, as labeled “2” on the chart.
The downward move is likely to follow a steep path as marked with the sharp downward trendline extension, especially if supported by volume and news catalysts.
🔄 Mirror Concept Highlight – Ellipse Area
The ellipse shape on the chart marks a previous compression zone followed by a breakout. This area represents an imbalance in supply that led to a sell-off. The MMC principle suggests the market tends to mirror these zones—if that was previous supply, and the current demand zone mirrors its positioning and structure, we can anticipate a similar reaction, but to the upside.
This is where the "50% double reaction" rule comes in—demand needs to show twice the strength to overcome the previous sell-side pressure.
🔧 Technical Levels Summary
Zone Type Price Range Notes
Major Resistance 70.50 – 71.00 Final target if bullish scenario plays out
Minor Resistance 68.80 – 69.20 First bullish checkpoint
Upper CRZ 65.90 – 66.20 Key structure to break for bulls
Lower CRZ (Support) 64.80 – 65.50 Demand base for bullish setup
Bearish Target Zone 62.00 – 61.80 Projected zone if support breaks
🧭 Trader’s Mindset & Risk Notes (MMC Style)
Wait for clear confirmation and price behavior near the CRZs before entering.
Use trendline breaks, candlestick confirmation, and volume to validate direction.
Avoid guessing the direction—let price tell the story.
Stick to MMC rules: No confirmation, no position.
✅ Bullish Criteria Checklist:
✔️ Price respects lower CRZ
✔️ Breakout above trendline
✔️ Closes above $66.20
✔️ Higher highs + strong bullish candles
✔️ MMC Double Demand Reaction Confirmed
❌ Bearish Breakdown Triggers:
❌ Breaks below $64.50
❌ Weak bounce + lower highs
❌ Volume increases on downside
❌ Clean breakdown structure
🚀 Trade Plan & Outlook
We’re now at a critical zone where market sentiment will soon be clear. Based on your MMC analysis, the bias remains bullish as long as price holds above $64.80. Be patient and let the setup complete with structure confirmation.
This is not just a technical play—it's a psychological zone, where institutional traders also make decisions. Follow the MMC logic and react with confirmation.
Crude oil-----sell near 67.00, target 65.00-63.00Crude oil market direction:
The recent daily crude oil line has been hovering, and it feels like it is falling or not falling. The daily crude oil line is still bearish. Let's continue to sell it on the rebound. For crude oil today, we focus on the suppression of 67.00. Consider selling it at this rebound position. The daily crude oil line needs to break the 64.00 position to see real selling force, otherwise it is a repair shock with a very small amplitude.
Fundamental analysis:
The latest news is that the United States and the European Union have reached a 15% tariff agreement, which overall supports the US dollar and suppresses gold. In addition, this week, pay attention to ADP employment data, non-agricultural employment data, and the Federal Reserve's interest rate decision and speech.
Operation suggestions:
Crude oil-----sell near 67.00, target 65.00-63.00

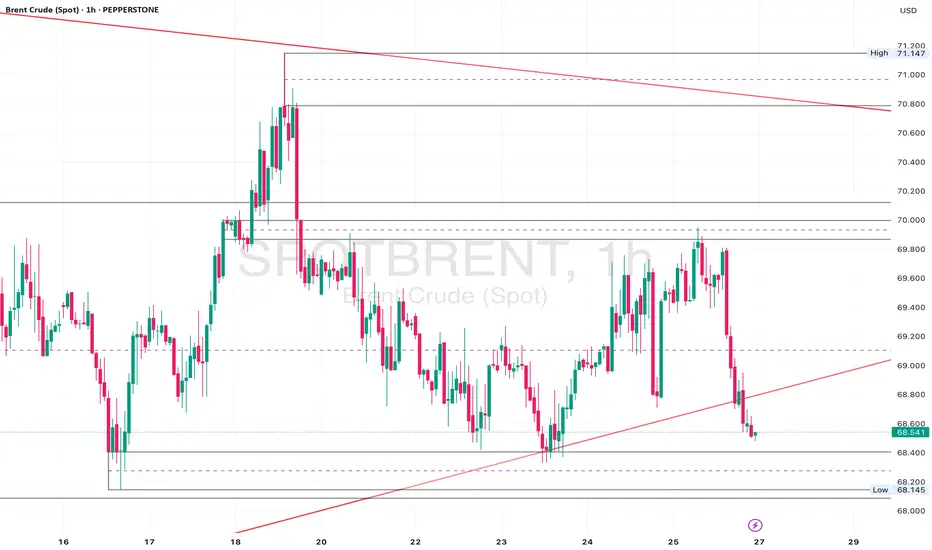
Brent Crude Sitting at Key Support – 69.20 Hold for a Rebound?Daily Analysis:
Price is holding above the ascending trendline and forming higher lows. Multiple rejections from the 68.00 region suggest strong demand. As long as we remain above the trendline, bulls stay in control.
4H Analysis:
Pullback after rejecting 71.00. Now sitting inside the 69.60–69.20 demand area. Bullish channel is still valid unless we break below 68.50.
1H Analysis:
Price broke the rising channel but is now hovering near key support. Bullish re-entry possible if lower timeframe aligns around 69.60.
Confirmation & Entry:
If we see bullish engulfing or pin bar at 69.60–69.20, this could signal a long setup back to 71.00. Invalidated on clean break below 68.50.
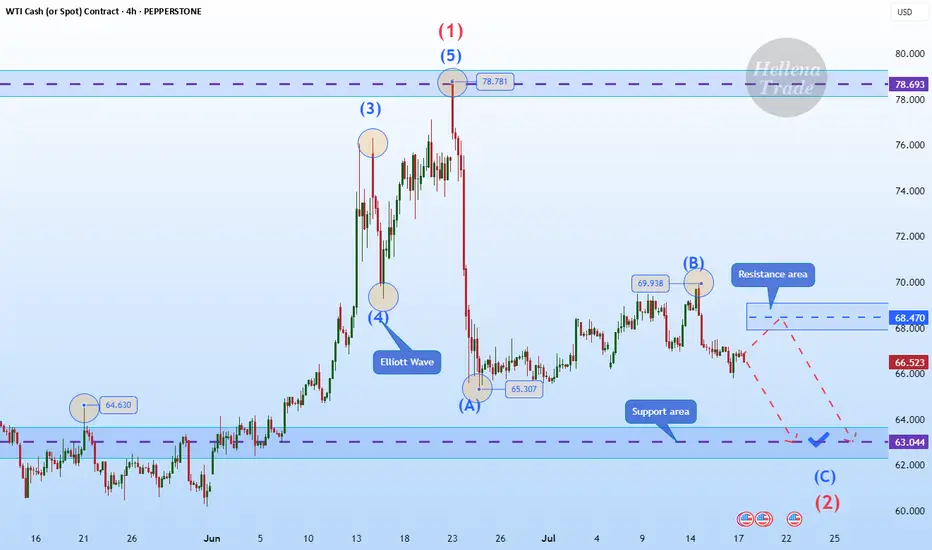
Hellena | Oil (4H): SHORT to support area of 63.000.Colleagues, I believe that wave “B” has formed at the level of 69.938, and now we expect the downward movement to continue with the aim of completing wave ‘C’ of the middle order and wave “2” of the higher order in the support area of 63,000.
It is quite possible that the price could reach the 60,000 level, but I think that for now it is worth focusing on the nearest targets.
Manage your capital correctly and competently! Only enter trades based on reliable patterns!
Crude oil market analysis: Crude oil has not moved much, but it Crude oil market analysis:
Crude oil has not moved much, but it is a good short-term operation opportunity. Sell small when it rebounds, sell big when it rebounds. Crude oil will basically not trap you. It is difficult to end the selling in the short term. It will basically decline in the future. You can sell when it rebounds near 67.00 today. If it breaks 64.00, it will directly dive. The daily line of crude oil has formed a shock pattern. You can sell at the break position of 64.00.
Operation suggestions:
Crude oil---sell near 67.00, target 65.00-63.00

Crude oil trading reminder: triple positive support
💡Message Strategy
After three consecutive days of sluggishness, both U.S. and Brent crude oil remained above the 100-day moving average on Thursday (July 24). U.S. crude oil is currently up 0.4%, trading around 65.46; Brent crude oil is currently up 0.1%, trading around US$68.67 per barrel. The three engines of trade negotiations, unexpected decline in inventories, and geopolitical games are ignited at the same time. Oil prices showed signs of stabilizing, allowing bulls to "smell" the long-awaited rebound opportunity.
1. The trade war breaks the ice: the US, Japan and Europe have reached a series of agreements to ignite market hopes.
2. Inventories plummeted by 3.2 million barrels! The balance of supply and demand suddenly tilted.
3. Geopolitical black swan: The war between Russia and Ukraine burns the energy supply chain
📊Technical aspects
The short-term (4H) trend of crude oil fluctuated upward slightly. The moving average system gradually formed a bullish arrangement, and the short-term objective trend direction was upward. In terms of momentum, the MACD indicator opened upward above the zero axis, and the bullish momentum was sufficient.
In terms of form, the oil price broke through the neckline, and the head and shoulders bottom reversal pattern was established. It is expected that after the intraday crude oil trend retests the neckline position, the probability of forming another upward rhythm is high.
💰Strategy Package
Long Position:65.50-66.50,SL:64.00,Target:67.75-68.00

Crude oil ----- Sell near 67.50, target 65.00-63.00Crude oil market analysis:
Crude oil has been falling recently, but the decline is not large, and the rebound will not be large. Consider selling crude oil if it rebounds slightly. The crude oil idea is bearish. It is difficult for crude oil to rise sharply without fundamentals, but we insist on taking losses in operation. If there is no loss, a piece of news will make it take off directly. Crude oil focuses on 64.00 support, and suppresses 67.50 and 69.50. Consider selling opportunities when the Asian session rebounds to 67.50.
Fundamental analysis:
Tariffs have not affected the market recently, and no major news has been announced. The market is relatively calm.
Operational suggestions:
Crude oil ----- Sell near 67.50, target 65.00-63.00

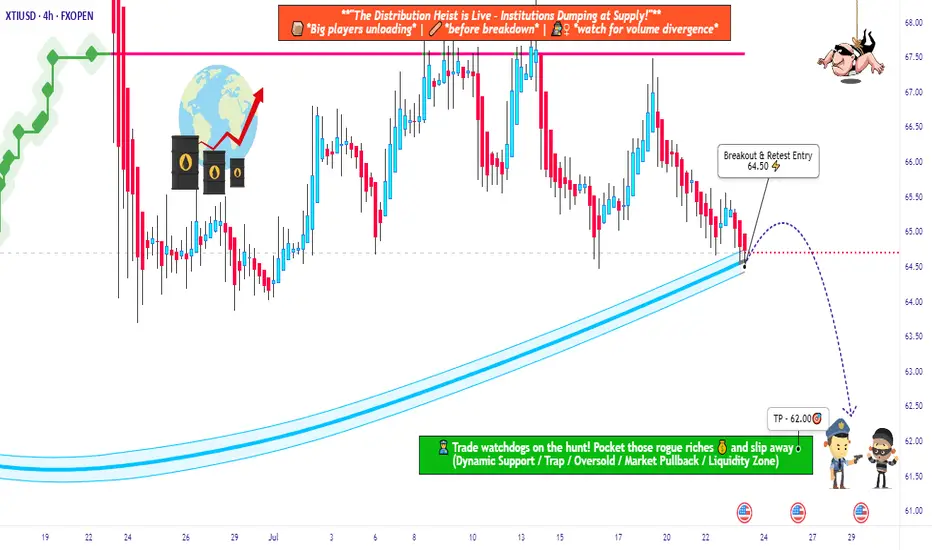
USOIL Robbery Alert! Smart Entry Plan Below Key MA Level🔐💥 “WTI Energy Heist: Thief Trader’s Bearish Master Plan” 💥🔐
The Official Robbery Blueprint for Smart Traders
🌟 Hi! Hola! Ola! Bonjour! Hallo! Marhaba! 🌟
💸 Welcome, Money Makers & Market Robbers! 💸
🚨 Get ready to break into the "US Oil Spot/WTI" market with precision-crafted bearish strategy from the one and only — Thief Trader Style!
📉💣 THE HEIST IS ON: SHORT PLAN LOADED! 💣📉
We’ve analyzed the charts using Thief Technicals + Fundamental Lockpick Tools and spotted a high-risk GREEN zone – a consolidation trap where greedy bulls usually get caught. This is where we strike.
🔑 ENTRY:
"Wait for the Neutral Moving Average to Break — Then Make Your Move!"
🎯 Focus zone: 64.50
☠️ Wait for the breakout – do NOT enter before it happens.
✅ Use sell stop orders above the MA line or place sell limit orders on the pullback after the breakout (target within the 15–30 min candle near swing high/low).
🧠 Thief Tip: Layer in entries using the DCA (layered attack strategy) to catch price on its way down. Set a chart alert so you don’t miss the strike moment.
🛑 STOP LOSS:
"Set it smart or don’t set it at all — you choose the fire you want to play with!"
📍 SL only gets placed AFTER breakout.
🎯 Recommended SL at 66.00 on the 4H swing level.
☠️ DO NOT place any orders or SL before confirmation breakout.
📊 Your SL depends on your risk %, lot size, and number of entries stacked.
🎯 TARGET ZONE: 62.50
💸 Lock profits before the bulls wake up. This level is based on market exhaustion zones and historical bounce areas.
🧠 WHY WE'RE SHORTING THIS?
This isn’t just a chart move — it’s backed by full-scale robbery research:
📰 COT Reports
📈 Macro & Seasonal Trends
🛢️ Crude Oil Inventories
💹 Sentiment & Intermarket Correlation
📉 Supply-Demand Dynamics
📚 Before pulling the trigger, educate yourself with the fundamentals. Dive into COT, Seasonal, and Macro reports. Don’t rob blindly — rob smart.
⚠️ Risk Management Alert:
Major news releases? Step back.
Trailing stops? Lock it in.
Position sizing? Know your risk.
Trade like a professional robber, not a street pickpocket.
💥💖 SUPPORT THE ROBBERY PLAN 💖💥
🧨 Smash that BOOST button to support this trading style and help more traders rob the market clean. Every like, every boost makes this community stronger.
💬 Drop a comment, share your entry levels, or post your winning trades.
This is a trading crew – we rob together, we profit together.
🔔 Stay tuned — more heist plans dropping soon.
Until then... Rob Smart. Trade Hard. Take Profits. 💰💪🎯
Crude oil-----sell near 66.00, target 65.00-63.00Crude oil market analysis:
The recent daily crude oil line has been fluctuating slightly. It is still bearish to sell at a high price. Crude oil is unlikely to rebound or rise sharply without fundamental support. The hourly crude oil suppression position is 66.40 and 67.50. Today we are close to 66.00 to consider selling opportunities. The daily moving average of crude oil is starting to go down. If 64.00 is broken, it will start to fall sharply.
Operational suggestions
Crude oil-----sell near 66.00, target 65.00-63.00

WTI(20250723)Today's AnalysisMarket news:
White House officials plan to visit the Federal Reserve headquarters on Thursday local time.
Technical analysis:
Today's buying and selling boundaries:
65.22
Support and resistance levels:
66.22
65.85
65.61
64.84
64.60
64.22
Trading strategy:
If the price breaks through 65.61, consider buying, the first target price is 65.85
If the price breaks through 65.22, consider selling, the first target price is 64.84
A Sleeping Giant in the Energy Sector?While everyone’s chasing the next hot AI stock, a quiet opportunity might be taking shape in the energy sector; and it could be a big one.
🔋 As AI data centers explode in size and number, the demand on our power grid is rising fast. Nuclear is still years away, and renewables are struggling to scale in time. That leaves oil and gas as the most reliable players; and one U.S. company may be perfectly positioned to ride that wave.
📊 Technical Analysis
NASDAQ:PROP PROP has been in a steady downtrend, moving within a falling wedge pattern (marked in green). Right now, it’s retesting the bottom of that wedge, typically where things get oversold.
Even more interesting, PROP bounced off a major monthly demand zone last week, a signal that buyers may be stepping in.
In the short term, if the blue demand zone holds, we could see a push toward the $7 mark, which lines up with the top of the wedge.
But to really confirm a medium-term reversal, we’ll need a clean break above the $8.3 resistance. If that happens, the door could open to a rally toward $15, a key level from early 2024.
🛢️ Why PROP? A Hidden Play With Room to Run
Prairie Operating Co. (NASDAQ: PROP) isn’t your typical small-cap oil stock. They own 65,000 acres in Colorado’s DJ Basin and use modern drilling tech to stay lean and efficient. That means they can still make money even when oil prices dip.
As energy demand continues to climb, PROP could be sitting in the sweet spot , especially with the world so focused on tech stocks. But behind every AI boom is a growing energy need, and companies like PROP are the ones powering it.
One well-known Wall Street firm recently gave PROP a Buy rating with a $21.75 price target; that’s a potential 281% upside from where it stands today. And that’s not even counting the potential boost from energy-friendly policies under the current administration.
📌 One to Watch in 2025
PROP might just be one of the most under-the-radar energy plays going into the new year.
The biggest moves often start quietly; and this one has all the ingredients to surprise.
➡️ As always, speak with your financial advisor and do your own research before making any investment decisions.
📚 Always follow your trading plan => including entry, risk management, and trade execution.
Good luck!
All strategies are good, if managed properly.
~ Richard Nasr

USOIL POTENTIAL LONG|
✅CRUDE OIL has retested a key support level of 65.00$
And as the pair is already making a bullish rebound
A move up to retest the supply level above at 66.27$ is likely
LONG🚀
✅Like and subscribe to never miss a new idea!✅
Disclosure: I am part of Trade Nation's Influencer program and receive a monthly fee for using their TradingView charts in my analysis.

Crude Oil Rebound Incoming? Key Demand Zone 📈 1. Technical Analysis – Daily Chart (CL1!)
The price has returned to a demand zone between 64.60 and 65.30, an area that previously triggered strong bullish reactions.
The July 22nd candle shows a clear lower wick, indicating potential buyer absorption and a possible short-term reversal.
The next key resistance lies between 67.80 and 68.80, which aligns with a well-defined supply zone.
Daily RSI remains weak but shows signs of bullish divergence, suggesting potential accumulation.
Bias: bullish from current levels, targeting 67.50 – 68.00. Invalidation on a daily close below 64.40.
2. Institutional Sentiment – COT Report (CFTC, July 15, 2025)
Non-Commercials (Speculators)
Long: 308,915 (↓ -24,223)
Short: 146,488 (↑ +22,724)
Net Position: sharply declining → bearish divergence in speculative sentiment
Commercials (Hedgers)
Long: 857,803 (↑ +66,342)
Short: 1,046,199 (↑ +18,118)
Net Position: still negative, but improving → reduced hedging = less downside pressure
📉 Interpretation:
Funds are closing longs and adding shorts, showing bearish positioning. However, commercials are slowly reducing their hedging exposure, which could indicate short-term stabilization if the technical support holds.
3. Seasonality
Periods analyzed: 20, 15, 10, 5, and 2 years
July historically shows negative average returns:
-0.71% (20Y)
-1.26% (15Y)
-1.37% (10Y)
The seasonal pattern indicates continued cyclical weakness into August.
📌 Interpretation:
The summer period typically brings seasonal bearish pressure, which aligns with current 2025 performance.
🌐 4. Macro & Fundamentals
EIA inventory builds for 3 consecutive weeks → demand weakness in the U.S.
No additional OPEC+ cuts announced → supply remains ample
Stable inflation data in the U.S. and China → no uptick in energy demand
Overall macro data is neutral with a slightly bearish short-term bias
USOIL Long From Support! Buy!
Hello,Traders!
USOIL made a retest of
The horizontal support
Level of 64.86$ from where
We are already seeing a bullish
Reaction so we will be expecting
A further local move up
Buy!
Comment and subscribe to help us grow!
Check out other forecasts below too!
Disclosure: I am part of Trade Nation's Influencer program and receive a monthly fee for using their TradingView charts in my analysis.
WTI OIL Extreme 1D MA50-200 squeeze to deliver break-out!WTI Oil (USOIL) has been consolidating for almost the past 30 days within the 1D MA50 (blue trend-line) and 1D MA200 (orange trend-line). The squeeze is now so tight that the trend will be revealed soon with a break-out.
Based on the 2-year Channel Down, that should be bearish, resembling the May 2024 consolidation that broke downwards and almost hit the 0.786 Fibonacci retracement level. Notice also the similar Sell Zone rejection on the 1W RSI.
As a result, we expect WTI to decline and target $61.00.
-------------------------------------------------------------------------------
** Please LIKE 👍, FOLLOW ✅, SHARE 🙌 and COMMENT ✍ if you enjoy this idea! Also share your ideas and charts in the comments section below! This is best way to keep it relevant, support us, keep the content here free and allow the idea to reach as many people as possible. **
-------------------------------------------------------------------------------
Disclosure: I am part of Trade Nation's Influencer program and receive a monthly fee for using their TradingView charts in my analysis.
💸💸💸💸💸💸
👇 👇 👇 👇 👇 👇
