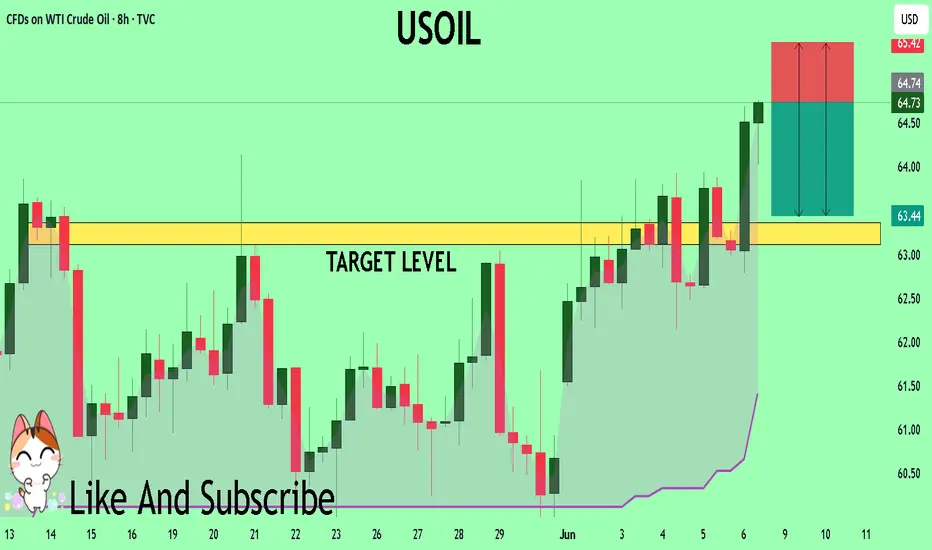
USOIL Will Go Down From Resistance! Sell!
Here is our detailed technical review for USOIL.
Time Frame: 6h
Current Trend: Bearish
Sentiment: Overbought (based on 7-period RSI)
Forecast: Bearish
The market is trading around a solid horizontal structure 64.869.
The above observations make me that the market will inevitably achieve 63.448 level.
P.S
Please, note that an oversold/overbought condition can last for a long time, and therefore being oversold/overbought doesn't mean a price rally will come soon, or at all.
Disclosure: I am part of Trade Nation's Influencer program and receive a monthly fee for using their TradingView charts in my analysis.
Like and subscribe and comment my ideas if you enjoy them!
Oil

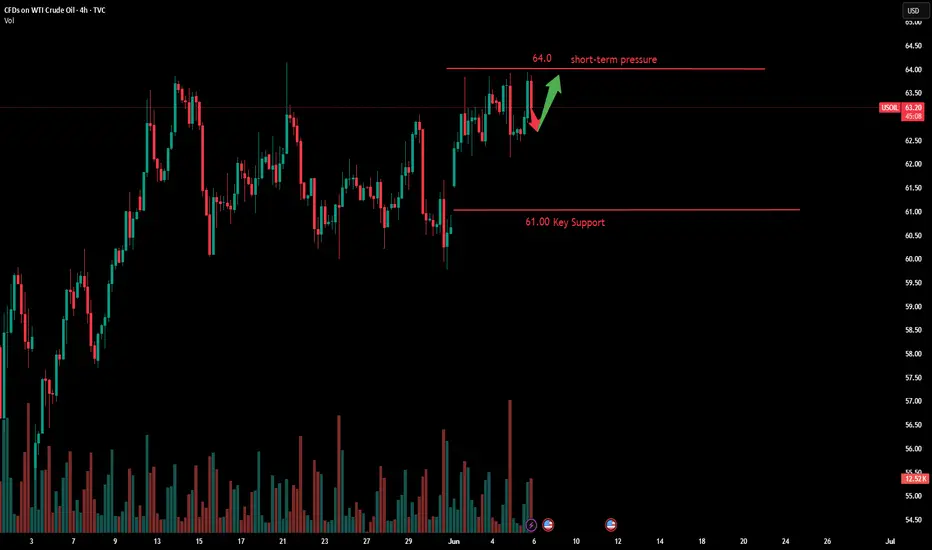
USOIL:Wait 63.6-64 to go long
Affected by last week's data, crude oil directly broke through the short-term pressure 64, technical point of view of the daily track upward opening, 64.8 position basically can not hold, and once the break open the space for rise, the rise has just begun;
After breaking from the early continuous shock to a strong unilateral, the market will at least continue a wave of strength, pay attention to 63.6-64 range to do more, or the European market force to rise, the United States is also more, now is to see a strong break.
Trading Strategy:
BUY@63.6-64
TP: 65-65.2
↓↓↓ More detailed strategies and trading will be notified here ↗↗↗
↓↓↓ Keep updated, come to "get" ↗↗↗

WTI Oil H1 | Falling toward a pullback supportWTI oil (USOIL) is falling towards a pullback support and could potentially bounce off this level to climb higher.
Buy entry is at 63.76 which is a pullback support that aligns with the 23.6% Fibonacci retracement.
Stop loss is at 62.70 which is a level that lies underneath a swing-low support and the 38.2% Fibonacci retracement.
Take profit is at 65.44 which is a resistance that aligns with the 78.6% Fibonacci projection.
High Risk Investment Warning
Trading Forex/CFDs on margin carries a high level of risk and may not be suitable for all investors. Leverage can work against you.
Stratos Markets Limited (tradu.com ):
CFDs are complex instruments and come with a high risk of losing money rapidly due to leverage. 63% of retail investor accounts lose money when trading CFDs with this provider. You should consider whether you understand how CFDs work and whether you can afford to take the high risk of losing your money.
Stratos Europe Ltd (tradu.com ):
CFDs are complex instruments and come with a high risk of losing money rapidly due to leverage. 63% of retail investor accounts lose money when trading CFDs with this provider. You should consider whether you understand how CFDs work and whether you can afford to take the high risk of losing your money.
Stratos Global LLC (tradu.com ):
Losses can exceed deposits.
Please be advised that the information presented on TradingView is provided to Tradu (‘Company’, ‘we’) by a third-party provider (‘TFA Global Pte Ltd’). Please be reminded that you are solely responsible for the trading decisions on your account. There is a very high degree of risk involved in trading. Any information and/or content is intended entirely for research, educational and informational purposes only and does not constitute investment or consultation advice or investment strategy. The information is not tailored to the investment needs of any specific person and therefore does not involve a consideration of any of the investment objectives, financial situation or needs of any viewer that may receive it. Kindly also note that past performance is not a reliable indicator of future results. Actual results may differ materially from those anticipated in forward-looking or past performance statements. We assume no liability as to the accuracy or completeness of any of the information and/or content provided herein and the Company cannot be held responsible for any omission, mistake nor for any loss or damage including without limitation to any loss of profit which may arise from reliance on any information supplied by TFA Global Pte Ltd.
The speaker(s) is neither an employee, agent nor representative of Tradu and is therefore acting independently. The opinions given are their own, constitute general market commentary, and do not constitute the opinion or advice of Tradu or any form of personal or investment advice. Tradu neither endorses nor guarantees offerings of third-party speakers, nor is Tradu responsible for the content, veracity or opinions of third-party speakers, presenters or participants.

WTI(20250609)Today's AnalysisMarket news:
Fed Harker: Amid uncertainty, the Fed may still cut interest rates later this year. Musallem: There is a 50% chance that the trade war will lead to a sustained inflation outbreak. Tariffs may push up inflation within one or two quarters. The ECB cut three key interest rates by 25 basis points. Lagarde hinted that the rate cut cycle will end, and the market is no longer fully pricing in another 25 basis point rate cut this year.
Technical analysis:
Today's buying and selling boundaries:
63.43
Support and resistance levels:
65.29
64.60
64.14
62.71
62.26
61.56
Trading strategy:
If the price breaks through 64.14, consider buying in, with the first target price of 64.60
If the price breaks through 63.43, consider selling in, with the first target price of 62.71

Weekly Market Forecast: BUY Stock Indices & Oil! Sell Gold! In this Weekly Market Forecast, we will analyze the S&P 500, NASDAQ, DOW JONES, Gold and Silver futures, for the week of June 9 - 13th.
Stock Indices are looking more bullish. Valid buys only!
Gold is weak. Sells only until there is a market structure shift upwards.
Oil prices have room to go higher. Buy it.
Silver is a wait and see. Should start to pull back this week, as it closed last week stronger than Gold.
CPI Wednesday. After the news is announced, the market should be very tradeable for the rest of the week.
Enjoy!
May profits be upon you.
Leave any questions or comments in the comment section.
I appreciate any feedback from my viewers!
Like and/or subscribe if you want more accurate analysis.
Thank you so much!
Disclaimer:
I do not provide personal investment advice and I am not a qualified licensed investment advisor.
All information found here, including any ideas, opinions, views, predictions, forecasts, commentaries, suggestions, expressed or implied herein, are for informational, entertainment or educational purposes only and should not be construed as personal investment advice. While the information provided is believed to be accurate, it may include errors or inaccuracies.
I will not and cannot be held liable for any actions you take as a result of anything you read here.
Conduct your own due diligence, or consult a licensed financial advisor or broker before making any and all investment decisions. Any investments, trades, speculations, or decisions made on the basis of any information found on this channel, expressed or implied herein, are committed at your own risk, financial or otherwise.

Natural Gas | Oil | Dollar | Silver | Gold Price Forecast.Natural Gas | Oil | Dollar | Silver | Gold Price Forecast.
OANDA:XAGUSD COMEX:SI1! NYMEX:NG1! COMEX:GC1!

USOIL What Next? SELL!
My dear friends,
USOIL looks like it will make a good move, and here are the details:
The market is trading on 64.73 pivot level.
Bias - Bearish
Technical Indicators: Supper Trend generates a clear short signal while Pivot Point HL is currently determining the overall Bearish trend of the market.
Goal - 63.36
Recommended Stop Loss - 65.42
About Used Indicators:
Pivot points are a great way to identify areas of support and resistance, but they work best when combined with other kinds of technical analysis
Disclosure: I am part of Trade Nation's Influencer program and receive a monthly fee for using their TradingView charts in my analysis.
———————————
WISH YOU ALL LUCK
Analysis of Upward/Downward Trends in Monday's Opening MarketBoosted by the telephone conversation between leaders of the world's two largest economies, oil prices maintained their upward momentum on Friday. Brent crude stabilized at around $65 per barrel, notching its first weekly rebound since mid-May; WTI crude also held near $63. "Against the backdrop of gradually easing macro uncertainties, the risk of panic selling in the market has significantly diminished," analysts said. "With the arrival of the summer peak demand season and the superimposition of geopolitical tensions in the Middle East and Russia, the downside for oil prices has been notably constrained."
The recent steady rebound in oil prices indicates that the market has gradually digested macro uncertainties, though the underlying supporting factors remain fragile. While trade concerns have temporarily subsided, whether OPEC+ will continue to release capacity as expected by the market will be key to determining whether oil prices can sustain their rebound. Meanwhile, the options market reflects expectations of a year-end supply glut, which will test the coordination capabilities of oil-producing countries.
Overall, for next week's crude oil trading strategy, it is recommended to prioritize buying on dips and supplement with shorting on rebounds. In the short term, monitor resistance at the $66.0-$67.0 level, while short-term support lies at the $63.5-$62.5 level.
Humans need to breathe, and perfect trading is like breathing—maintaining flexibility without needing to trade every market swing. The secret to profitable trading lies in implementing simple rules: repeating simple tasks consistently and enforcing them strictly over the long term.
Trading Strategy:
buy@62.0-62.5
TP:64.5-65.0

USOIL: Strong Bullish Sentiment! Long!
My dear friends,
Today we will analyse USOIL together☺️
The recent price action suggests a shift in mid-term momentum. A break above the current local range around 64.706 will confirm the new direction upwards with the target being the next key level of 65.295. and a reconvened placement of a stop-loss beyond the range.
❤️Sending you lots of Love and Hugs❤️

USOIL: Short Signal Explained
USOIL
- Classic bearish pattern
- Our team expects retracement
SUGGESTED TRADE:
Swing Trade
Sell USOIL
Entry - 64.73
Stop - 66.13
Take - 62.38
Our Risk - 1%
Start protection of your profits from lower levels
Disclosure: I am part of Trade Nation's Influencer program and receive a monthly fee for using their TradingView charts in my analysis.
❤️ Please, support our work with like & comment! ❤️

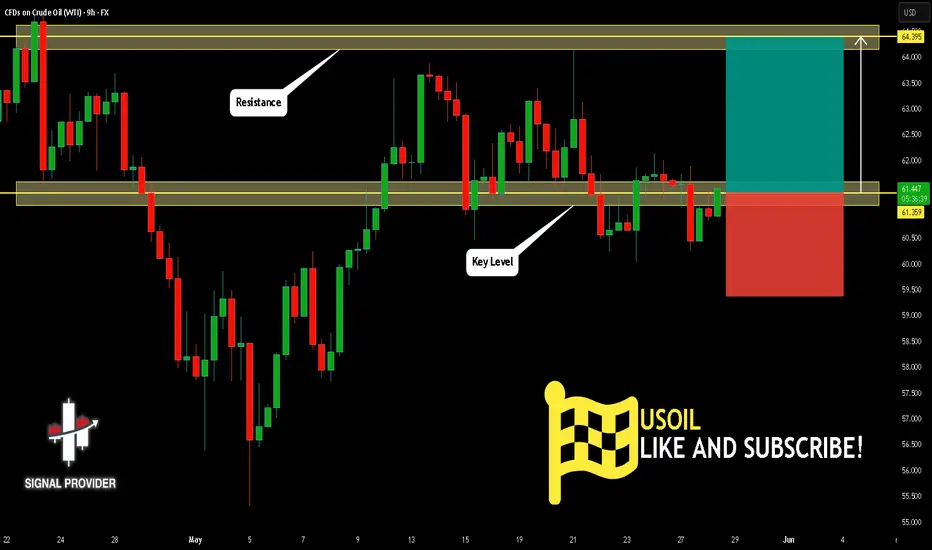
USOIL Will Go Up! Long!
Here is our detailed technical review for USOIL.
Time Frame: 9h
Current Trend: Bullish
Sentiment: Oversold (based on 7-period RSI)
Forecast: Bullish
The market is approaching a significant support area 61.359.
The underlined horizontal cluster clearly indicates a highly probable bullish movement with target 64.395 level.
P.S
We determine oversold/overbought condition with RSI indicator.
When it drops below 30 - the market is considered to be oversold.
When it bounces above 70 - the market is considered to be overbought.
Disclosure: I am part of Trade Nation's Influencer program and receive a monthly fee for using their TradingView charts in my analysis.
Like and subscribe and comment my ideas if you enjoy them!
USOIL Will Go Higher From Support! Buy!
Take a look at our analysis for USOIL.
Time Frame: 9h
Current Trend: Bullish
Sentiment: Oversold (based on 7-period RSI)
Forecast: Bullish
The market is testing a major horizontal structure 60.773.
Taking into consideration the structure & trend analysis, I believe that the market will reach 64.119 level soon.
P.S
Overbought describes a period of time where there has been a significant and consistent upward move in price over a period of time without much pullback.
Disclosure: I am part of Trade Nation's Influencer program and receive a monthly fee for using their TradingView charts in my analysis.
Like and subscribe and comment my ideas if you enjoy them!

USOIL SHORT FROM RESISTANCE
USOIL SIGNAL
Trade Direction: short
Entry Level: 64.71
Target Level: 56.98
Stop Loss: 69.85
RISK PROFILE
Risk level: medium
Suggested risk: 1%
Timeframe: 1D
Disclosure: I am part of Trade Nation's Influencer program and receive a monthly fee for using their TradingView charts in my analysis.
✅LIKE AND COMMENT MY IDEAS✅

Crude. Daily Internal to External Range Liquidity. 06.06.25Covering the crude expansion from daily internal towards the first external range liquidity

Crude oil-----Sell near 64.00, target 63.00-62.00Crude oil market analysis:
Crude oil is still bearish, and we will continue to sell on rebounds. If it does not break 65.00, it will fluctuate. The general trend is bearish. If it breaks, we will adjust our thinking. Today's crude oil is the key. Will it start to take off before the data? The previous crude oil inventory data did not allow crude oil to break the position. The crude oil fluctuation range is 60.00-65.00. If it breaks this range, we will adjust our thinking on fluctuations.
Operational suggestions
Crude oil-----Sell near 64.00, target 63.00-62.00

USOIL:The strategy of going short
USOIL: Same thinking, still maintain the short strategy. Friends with short orders at 63.3-63.5 continue to wait, can increase short orders near 63.8, the target is 62.5-62.3 unchanged
↓↓↓ More detailed strategies and trading will be notified here ↗↗↗
↓↓↓ Keep updated, come to "get" ↗↗↗

WTI(20250606)Today's AnalysisMarket news:
The European Central Bank cut three key interest rates by 25 basis points. Lagarde hinted that the rate cut cycle will end, and the market is no longer fully pricing in another 25 basis point rate cut this year.
Technical analysis:
Today's buying and selling boundaries:
62.58
Support and resistance levels:
63.97
63.45
63.12
62.05
61.71
61.19
Trading strategy:
If the price breaks through 63.12, consider buying, and the first target price is 63.45
If the price breaks through 62.58, consider selling, and the first target price is 62.05

Short Crude Oil for The LeapRisk free trade for $100 on MCL
Scaling out of the trade from 4 hour supply to 4 hour demand.
Using the TrendCloud Trading System and it's working great.
So far I'm in the top 7% for this competition.
Focusing on managing this crude oil trade and also the opening range on the MNQ and NQ
Huge win on day 1 for $4000 on NQ opening range using the TrendCloud Trading Strategy.
Backtesting data shows great results. Super proud of this. It took me a month to program everything properly and optimize specifically for the NQ.

WTI CRUDE OIL: Going for a LH rejection. Sell signal.WTI Crude Oil is practically neutral on its 1D technical outlook (RSI = 55.991, MACD = 0.160, ADX = 24.748) as it's on the 3rd straight day of flat consolidation on the 1D MA50. The last time it did this was on April 2nd, which resulted in a LH rejection to the S1 level. As the presence of the R1 level (64.90) is just above, we expect the market to get rejected and aim for the S1 again (TP = 56.00).
## If you like our free content follow our profile to get more daily ideas. ##
## Comments and likes are greatly appreciated. ##

Crude Oil is Building Momentum for a BreakoutDuring the U.S. trading session on Thursday, international oil prices fluctuated higher, with U.S. crude oil currently trading near $63.55 per barrel. Despite the intraday volatility, international oil prices remain under downward pressure, primarily influenced by two key factors.
First, data from the U.S. Energy Information Administration (EIA) showed that as of last week, U.S. gasoline and distillate inventories increased more than expected, signaling weakening refined product demand in the world’s largest economy. This development has sparked investor concerns about whether the U.S. summer driving season can sustain demand growth, leading to a ~1% decline in oil prices on Wednesday.
The current crude oil market is caught between supply and demand headwinds:
Supply-side pressures: OPEC+’s production increase plan and Saudi Arabia’s strategic price cuts have created short-term bearish sentiment.
Demand-side uncertainties: The unexpected rise in U.S. refined product inventories has amplified market doubts about the vigor of global consumption recovery.
Additionally, the escalation of international trade frictions has further dampened risk appetite, exacerbating downward pressure on prices.
In the short term, oil prices are likely to continue oscillating within the $60–$65 per barrel range. Market participants should closely monitor U.S. macroeconomic data and OPEC+’s compliance with its production policies for directional cues.
Humans need to breathe, and perfect trading is like breathing—maintaining flexibility without needing to trade every market swing. The secret to profitable trading lies in implementing simple rules: repeating simple tasks consistently and enforcing them strictly over the long term.
Trading Strategy:
buy@61.5-62.0
TP:63.0-63.5
USOIL:Go short first today
USOIL: Crude oil downward momentum gradually stronger, the day's trend is weak, trading ideas first short.
Trading Strategy:
SELL@63.3-63.5
TP: 62.5-62.3
↓↓↓ More detailed strategies and trading will be notified here ↗↗↗
↓↓↓ Keep updated, come to "get" ↗↗↗

Crude oil----sell near 64.00, target 63.00-60.00Crude oil market analysis:
Yesterday's crude oil still failed to rise. The buying price still failed to stand above 65.00 and was still fluctuating. Today, we continue to look at the range wave. We still consider selling it when it is close to 64. The crude oil inventory data does not give us much room for imagination. In addition, the recent fundamentals of crude oil are not strong, and they do not support the long position of crude oil, which has caused crude oil to fluctuate and hover. The current fluctuation range we see is 65.00-60.00.
Operation suggestions:
Crude oil----sell near 64.00, target 63.00-60.00

USOIL Will Grow! Buy!
Take a look at our analysis for USOIL.
Time Frame: 1D
Current Trend: Bullish
Sentiment: Oversold (based on 7-period RSI)
Forecast: Bullish
The market is testing a major horizontal structure 62.890.
Taking into consideration the structure & trend analysis, I believe that the market will reach 68.865 level soon.
P.S
The term oversold refers to a condition where an asset has traded lower in price and has the potential for a price bounce.
Overbought refers to market scenarios where the instrument is traded considerably higher than its fair value. Overvaluation is caused by market sentiments when there is positive news.
Disclosure: I am part of Trade Nation's Influencer program and receive a monthly fee for using their TradingView charts in my analysis.
Like and subscribe and comment my ideas if you enjoy them!
