CRUDE OIL LONG SIGNAL|
✅CRUDE OIL is trading in a
Strong uptrend and was making
A local bearish correction but
A horizontal support level was
Hit at 71.00$ so we can go
Long on with the TP of 71.72$
And the SL of 70.59$
LONG🚀
✅Like and subscribe to never miss a new idea!✅
Disclosure: I am part of Trade Nation's Influencer program and receive a monthly fee for using their TradingView charts in my analysis.
Oil

OIL - Key Fibonacci Levels and Potential Market MovesThis chart presents a detailed technical analysis of Crude Oil Futures on the 1D timeframe, highlighting key Fibonacci levels, Fair Value Gaps (FVGs), and potential price movements.
Key observations:
- The price is currently around $71.44, moving towards a key decision zone.
- A significant Fibonacci retracement zone (0.618 - 0.65) is marked near $74, aligning with a key resistance area.
- The "Golden Pocket" from the greater downtrend remains a crucial area to watch for a potential reversal.
- Two Fair Value Gaps (FVG & IFVG) are identified, which could act as liquidity zones.
Possible Scenarios:
🟢 Option 1: Bullish breakout, price moves above $74 and continues toward $78+ levels.
🔴 Option 2: Rejection from resistance, leading to a potential pullback below $70.
🔴 Option 3: Strong rejection, price drops back towards the Fibonacci 0 level (~$64).
Which option do you think is most likely? Let me know your thoughts! 🚀📉

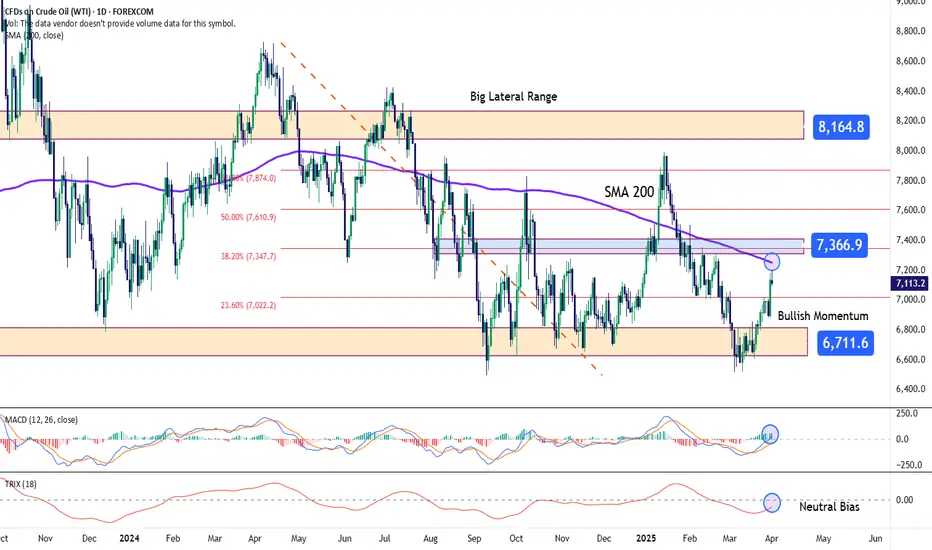
Crude Oil: WTI Recovers Slightly Above the $70 ZoneSince touching the key support level at $67 , WTI crude oil has posted a notable recovery of more than 7% in recent weeks, and is now hovering slightly above the $70 per barrel mark. For now, the bullish bias remains intact as comments from the White House suggest potential tariffs ranging from 25% to 50% on countries that choose to trade Russian oil. According to President Trump, Russia has failed to implement a ceasefire in the short term and this could lead to additional tarrifs. Although this new tariff strategy has no official date, if enacted, it could significantly disrupt global oil supply, reinforcing short-term bullish expectations for crude.
Wide Sideways Range:
For several months now, oil has been moving within a stable sideways range between $81 (resistance) and $67 (support) per barrel. So far, there hasn't been any significant breakout from this channel, making it the dominant structure on the chart in the short term.
MACD:
The MACD histogram continues to oscillate just above the zero line, but recent sessions have shown slight bearish momentum, possibly signaling a pause in the upward movement as the dominance of the moving averages appears to be neutralizing.
TRIX:
A similar situation is developing in the TRIX indicator, with the line hovering just below the neutral 0 level. This suggests that the strength of the 18-period moving average has entered a zone of balance, lacking a clear directional force.
The behavior of both indicators implies that momentum is gradually weakening as the price approaches resistance levels.
Key Levels:
$73: A key resistance level located near the midpoint of the sideways range, also aligning with the 200-period moving average. A breakout above this level could trigger a solid short-term bullish trend.
$81: A distant resistance level marking the top of the current range. Price action reaching this level could be decisive in confirming a long-term bullish breakout.
$67: A significant support level , marking the lower boundary of the range. A return to this level could revive previously dormant bearish pressure and potentially resume a longer-term downtrend that began several weeks ago.
By Julian Pineda, CFA – Market Analyst
USOIL Daily Analysis: Bullish Reversal from Key Support USOIL (WTI Crude Oil) daily chart showing price action analysis.
Key Observations:
Support Zone:
A strong demand zone is marked around $65-$66, which has acted as a reversal area in the past.
The price has recently bounced off this zone, indicating potential buyer interest.
Current Price Action:
Price is currently trading at $68.25.
A bullish move started from the support region, with a higher low formation suggesting potential upside momentum.
Potential Scenario:
The chart suggests a pullback before continuation to the upside.
If the support holds, $70-$72 could be the next target.
If price fails to hold above $66, further downside towards $64 may be possible.
Outlook:
Bullish Bias 📈 as long as the price remains above the demand zone.
Watch for a higher low confirmation before entering a long trade.
Breakout above $70 could signal a stronger rally.

USOIL BUY!!!Hello friends
Given that the price has reached good support, we now see that the price has made a good comeback...
We can enter the trade with capital and risk management and move towards the specified goals.
*Trade safely with us*

USOIL:The bullish momentum demonstrates strong performanceRecently, the United States has stepped up its sanctions against Iran. It also made threatening remarks indicating that if the peace talks between Russia and Ukraine fail to reach an agreement, it will further intensify sanctions against Russia. Such actions have heightened the market's concerns about the future supply side.
Meanwhile, the short-term and phased decline in the United States' domestic oil production, combined with its temporary abstention from taking additional measures to suppress oil prices, has led to a certain increase in the supporting strength of the oil market recently. Yesterday, the upward trend of oil prices continued.
Take a long position at $71.05 for the oil price. Set a stop-loss of 30 basis points and a take-profit at $72.70.
Trading Strategy:
buy@70.8-71.05
TP:72.20-72.50
Get daily trading signals that ensure continuous profits! With an astonishing 90% accuracy rate, I'm the record - holder of an 800% monthly return. Click the link below the article to obtain accurate signals now!

OIL - CL - Long scalping OIL - CL - Long scalping
If price break resistence zone we can have an new long wave to complete the 3° wave

WTI OIL Approaching a potential rejection level.Our last short-term analysis (March 18, see chart below) on WTI Oil (USOIL) hit the $70.00 Target and is currently extending the uptrend:
We believe however that this uptrend may be coming to a temporary end as not only does it approach the 1D MA200 (orange trend-line) that has been intact since February 03, but also the 73.40 Symmetrical Resistance that kick started the -7.70% September 24 2024 rejection.
As you can this this is also where the 1D RSI 67.00 Resistance is, which has also caused 2 rejections.
Based on that, we will wait for a short on the 1D MA200 to target $68.00.
-------------------------------------------------------------------------------
** Please LIKE 👍, FOLLOW ✅, SHARE 🙌 and COMMENT ✍ if you enjoy this idea! Also share your ideas and charts in the comments section below! This is best way to keep it relevant, support us, keep the content here free and allow the idea to reach as many people as possible. **
-------------------------------------------------------------------------------
💸💸💸💸💸💸
👇 👇 👇 👇 👇 👇

Oil - Expecting The Price To Bounce Higher FurtherH1 - Price has created series of higher highs, higher lows structure
Strong bullish momentum
Higher highs based on the moving averages of the MACD indicator
Expecting retraces and further continuation higher until the two strong support zones hold.
If you enjoy this idea, don’t forget to LIKE 👍, FOLLOW ✅, SHARE 🙌, and COMMENT ✍! Drop your thoughts and charts below to keep the discussion going. Your support helps keep this content free and reach more people! 🚀
--------------------------------------------------------------------------------------------------------------------
Disclosure: I am part of Trade Nation's Influencer program and receive a monthly fee for using their TradingView charts in my analysis.

USOIL Is Bullish! Long!
Please, check our technical outlook for USOIL.
Time Frame: 8h
Current Trend: Bullish
Sentiment: Oversold (based on 7-period RSI)
Forecast: Bullish
The market is approaching a key horizontal level 71.913.
Considering the today's price action, probabilities will be high to see a movement to 73.911.
P.S
We determine oversold/overbought condition with RSI indicator.
When it drops below 30 - the market is considered to be oversold.
When it bounces above 70 - the market is considered to be overbought.
Disclosure: I am part of Trade Nation's Influencer program and receive a monthly fee for using their TradingView charts in my analysis.
Like and subscribe and comment my ideas if you enjoy them!

CRUDE OIL (WTI): More Growth Ahead
After a 4-days long accumulation on a key daily resistance,
WTI Oil bounced strongly on Monday, violating a key daily resistance.
The market is likely to continue advancing.
Next resistance is 72.5
❤️Please, support my work with like, thank you!❤️

WTI Oil H4 | Falling to pullback supportWTI oil (USOIL) is falling towards a pullback support and could potentially bounce off this level to climb higher.
Buy entry is at 71.06 which is a pullback support.
Stop loss is at 69.80 which is a level that lies underneath a pullback support and the 23.6% Fibonacci retracement.
Take profit is at 72.94 which is a multi-swing-high resistance.
High Risk Investment Warning
Trading Forex/CFDs on margin carries a high level of risk and may not be suitable for all investors. Leverage can work against you.
Stratos Markets Limited (www.fxcm.com):
CFDs are complex instruments and come with a high risk of losing money rapidly due to leverage. 63% of retail investor accounts lose money when trading CFDs with this provider. You should consider whether you understand how CFDs work and whether you can afford to take the high risk of losing your money.
Stratos Europe Ltd (www.fxcm.com):
CFDs are complex instruments and come with a high risk of losing money rapidly due to leverage. 63% of retail investor accounts lose money when trading CFDs with this provider. You should consider whether you understand how CFDs work and whether you can afford to take the high risk of losing your money.
Stratos Trading Pty. Limited (www.fxcm.com):
Trading FX/CFDs carries significant risks. FXCM AU (AFSL 309763), please read the Financial Services Guide, Product Disclosure Statement, Target Market Determination and Terms of Business at www.fxcm.com
Stratos Global LLC (www.fxcm.com):
Losses can exceed deposits.
Please be advised that the information presented on TradingView is provided to FXCM (‘Company’, ‘we’) by a third-party provider (‘TFA Global Pte Ltd’). Please be reminded that you are solely responsible for the trading decisions on your account. There is a very high degree of risk involved in trading. Any information and/or content is intended entirely for research, educational and informational purposes only and does not constitute investment or consultation advice or investment strategy. The information is not tailored to the investment needs of any specific person and therefore does not involve a consideration of any of the investment objectives, financial situation or needs of any viewer that may receive it. Kindly also note that past performance is not a reliable indicator of future results. Actual results may differ materially from those anticipated in forward-looking or past performance statements. We assume no liability as to the accuracy or completeness of any of the information and/or content provided herein and the Company cannot be held responsible for any omission, mistake nor for any loss or damage including without limitation to any loss of profit which may arise from reliance on any information supplied by TFA Global Pte Ltd.
The speaker(s) is neither an employee, agent nor representative of FXCM and is therefore acting independently. The opinions given are their own, constitute general market commentary, and do not constitute the opinion or advice of FXCM or any form of personal or investment advice. FXCM neither endorses nor guarantees offerings of third-party speakers, nor is FXCM responsible for the content, veracity or opinions of third-party speakers, presenters or participants.

USOil Key Resistance Hit: Is WTI Crude Due for a Correction?WTI crude oil appears overextended after a strong bullish rally, trading into a key resistance level amid heightened geopolitical tensions and market volatility. The current price action suggests a potential retracement, with equilibrium around the 50% Fibonacci level being a likely target for correction 📉. Given the reactionary nature of the market, traders should remain cautious as political developments could drive further instability ⚠️. While the technical setup supports a pullback, external factors may disrupt this scenario, so risk management is essential. 📊
Disclaimer: This analysis is for informational purposes only and does not constitute financial advice. Always conduct your own research before making trading decisions.

01.04.25 Morning ForecastPairs on Watch -
FX:GBPAUD
TVC:USOIL
A short overview of the instruments I am looking at for today, multi-timeframe analysis down to what I will be looking at for an entry. Enjoy!

Today analysis for Nasdaq, Oil, and GoldNasdaq
The Nasdaq closed lower with a gap-down amid growing recession fears. Although it did not reach the 20-month moving average (MA) on the monthly chart, last month’s long bearish candlestick has resulted in a sell signal on the monthly futures chart—the first time in three years since February 2022. From a monthly perspective, the 16,900–17,500 range appears to be a good buying zone, but it is important to monitor whether the index reaches this level within this month’s candle. The 20-month MA is likely to be briefly breached, even if a lower wick forms.
On the weekly chart, the Nasdaq is currently finding short-term support around 19,000, but given the large gap between the 3-week and 5-week MAs, a rebound remains a possibility. On the daily chart, a sell signal has not yet been confirmed. If further declines confirm a bearish crossover, the Nasdaq could enter a third wave of selling, with a target of 17,300. The key question is whether the market experiences another sharp drop.
However, given the significant distance from the 5-day MA, the more likely scenario is sideways movement for a few days, allowing the moving averages to catch up before a potential further decline. In this case, it is advisable to trade within the range but always use stop-losses. The 240-minute chart also shows strong downward movement. While the market is in oversold territory, making short-selling more favorable, there is also the possibility of a range-bound pattern forming on the daily chart. If taking buy positions at the lows, strict stop-loss management is essential.
Crude Oil
Oil closed higher following news of tariffs imposed on Russian oil. The price successfully broke above the key resistance at $70, also surpassing the 240-day MA. On the monthly chart, oil has now entered a range where further upside potential exists, and there is a possibility that the MACD could attempt a bullish crossover with the signal line.
On the daily chart, the MACD has moved above the zero line, pulling the signal line upward. If the price stays above the 240-day MA, it may form a strong trend reversal pattern with accelerated gains. On the 240-minute chart, the MACD remains above the zero line and is crossing above the signal line, indicating continued buying momentum.
Overall, it is best to focus on buying dips, as April’s first trading session could see the price gapping above the 240-day MA. Holding overnight short positions carries risk, so caution is advised.
Gold
Gold closed higher, driven by strong demand for safe-haven assets. On the monthly chart, gold formed a long bullish candlestick. However, given the large gap between the price and the 3-month & 5-month MAs, a pullback remains a possibility. The key question is whether gold will continue rising before a correction or correct first before resuming its uptrend. It is best to monitor the price action closely.
On the daily chart, the MACD is forming a third wave of buying pressure, opening the possibility for a price target around 3,216. Thus, it is advisable to focus on buying dips, while being cautious about chasing highs due to potential volatility. The 240-minute chart indicates that strong buying momentum continues, as gold remains in overbought territory.
Since this is the beginning of a new month, key economic reports—including the ISM Manufacturing PMI and the U.S. Jobs Report—could significantly impact gold’s volatility. For both buy and sell positions, it is essential to set stop-loss levels, as increased volatility is expected.
With Trump’s tariff policies increasing the risk of a global recession, liquidity in global equity markets is drying up, reducing the attractiveness of stocks. The clear contrast between Nasdaq and gold’s performance is likely to persist for some time.
As we enter April’s first trading session, trade cautiously and adapt to market conditions.
Wishing you a successful trading day!
If you like my analysis, please follow me and give it a boost!
For additional strategies for today, check out my profile. Thank you!

USOIL My Opinion! BUY!
My dear subscribers,
This is my opinion on the USOIL next move:
The instrument tests an important psychological level 68.97
Bias - Bullish
Technical Indicators: Supper Trend gives a precise Bullish signal, while Pivot Point HL predicts price changes and potential reversals in the market.
Target - 69.31
About Used Indicators:
On the subsequent day, trading above the pivot point is thought to indicate ongoing bullish sentiment, while trading below the pivot point indicates bearish sentiment.
Disclosure: I am part of Trade Nation's Influencer program and receive a monthly fee for using their TradingView charts in my analysis.
———————————
WISH YOU ALL LUCK

WTI CRUDE OIL: 1M MA100 providing huge buying pressure to $77.50WTI Crude Oil has reclaimed its bullish technical outlook on 1D (RSI = 62.688, MACD = -0.001, ADX = 49.608) as is about to end the month on a strong green 1M candle and a huge 1M RSI bullish divergence. The most important development here is that the current 1M candle (March) marginally hit the 1M MA100 and immediately rebounded. This trendline has been the market's major long term support since April 2021, so essentially for the last 4 years. We believe that this is enough to cause a medium term rebound to the LH Zone and possibly even just outside of it to test the 1M MA50. For now however, our target is contained inside this zone (TP = 77.50).
## If you like our free content follow our profile to get more daily ideas. ##
## Comments and likes are greatly appreciated. ##

CRUDE OIL Bullish Breakout! Buy!
Hello,Traders!
CRUDE OIL is trading in an
Uptrend and the pair made
A bullish breakout of the key
Level of 70.30$ and the
Breakout is confirmed so we
Are bullish biased and we
Will be expecting a further
Move up after a potential
Local pullback
Buy!
Comment and subscribe to help us grow!
Check out other forecasts below too!
Disclosure: I am part of Trade Nation's Influencer program and receive a monthly fee for using their TradingView charts in my analysis.

USOIL: Next Week's Blueprint for Profit Amid VolatilityDuring the US trading session on Friday, March 28th, international oil prices fluctuated slightly and declined. However, both Brent crude oil and WTI crude oil remained firmly near their one - month highs and were projected to register "three consecutive weekly gains" on the weekly chart. The ongoing tug - of - war between the supply tightness instigated by geopolitical unrest and the latent concerns regarding an economic downturn has placed oil prices in a volatile state of being "caught between a rock and a hard place".
From the perspective of the USOIL daily chart, following the medium - term trend's breach of the lower edge of the range, it has predominantly fluctuated around lower levels. The oil price has experienced consecutive short - term increases, breaking through the suppression of the moving average system, and the medium - term objective trend has entered a transition phase. Nevertheless, in terms of kinetic energy, neither the bulls nor the bears have demonstrated a clear - cut inclination to overpower the other. It is anticipated that the medium - term trend will persist in its volatile rhythm for a while, awaiting the establishment of a distinct trend direction.
The short - term (1H) trend of USOIL has not continuously set new highs and has exhibited a pattern of high - level consolidation. The short - term objective trend remains upward. In the early trading session, the oil price underwent a narrow adjustment at a high level, presenting an overall secondary rhythm with a sound internal rhythm. The fundamental objective trend during the week has been upward in sync, and it is highly likely that the short - term trend of USOIL will continue its upward trajectory next week.
USOIL
buy@68-68.5
tp:69.5-70
I will share trading signals every day. All the signals have been accurate for a whole month in a row. If you also need them, please click on the link below the article to obtain them.

USOIL: GO short positions during the oscillation at a high levelThe short-term trend of crude oil has been oscillating and declining at a high level. The oil price has broken below the moving average system, and the objective short-term trend has entered a transition period. The bearish momentum is gradually intensifying, and the oil price dropped below 70 in the early trading session. In the 4-hour chart, the objective short-term trend direction within this week still remains upward. The trading strategy for crude oil still mainly focuses on the oscillation and decline at a high level.
Trading Strategy:
Sell@69.8-70
TP:69-68.5
Get daily trading signals that ensure continuous profits! With an astonishing 90% accuracy rate, I'm the record - holder of an 800% monthly return. Click the link below the article to obtain accurate signals now!

Today analysis for Nasdaq, Oil, and GoldNasdaq
The Nasdaq closed sharply lower, forming a long bearish candlestick, as recession fears intensified. The index fell toward the lower Bollinger Band on the daily chart, while the MACD moved closer to the signal line, indicating a correction.
On the weekly chart, the Nasdaq faced resistance slightly above the 5-week MA, forming an upper wick and closing lower. The MACD is falling steeply, and the signal line is also in a downtrend, suggesting the potential for an overshooting move downward before forming a bottom. From a daily perspective, key support zones to watch are around 19,000 (first level) and 18,500 (second level). The MACD has not yet crossed below the signal line, but if a bearish crossover (death cross) occurs, a strong third wave of selling pressure could emerge. Therefore, caution is advised for long positions. However, since the MACD has not yet confirmed a bearish crossover, there is also the possibility of a rebound off the signal line. It is crucial to wait for a confirmed trend reversal before taking long positions.
On the 240-minute chart, strong sell signals have emerged, leading to a steep decline. The current price action resembles the movement seen on February 21, but since the bottom is not yet clear, it is best to adopt a conservative approach. For short positions, the 3-day moving average can be used as a reference level. For long positions, the lower Bollinger Band may provide a short-term buying opportunity. As today marks the last trading day of the month, watch closely to see if the Nasdaq reaches the 20-month MA or ends the month with a lower wick.
Crude Oil
Oil closed lower, facing resistance at $70. It has fallen back below the 5-day MA, trapping the price within a range-bound structure. On the weekly chart, oil was rejected at the 10-week MA, and since the MACD has not yet formed a bullish crossover, there is a chance that oil could retest its previous double-bottom level. A consolidation phase between the 5-week and 10-week MAs appears likely.
On the daily chart, as the price corrected, the MACD began converging with the signal line. If oil retraces to around $68, a short-term buying opportunity may arise. For oil to resume its uptrend, it needs to pull back toward $68, rebound, and break above $70 with strong momentum. However, this move would likely require a global catalyst. On the 240-minute chart, both the MACD and signal line remain above the zero line, suggesting a higher probability of a rebound and a golden cross formation. Overall, the best approach is to focus on dip-buying opportunities during this phase.
Gold
Gold closed higher, breaking to a new all-time high on the daily chart. Last week, there was a possibility of a pullback toward the 5-week MA, but the MACD has turned upward, surpassing its previous high, reducing the likelihood of a bearish divergence and increasing the probability of further upside. However, since gold has not yet tested the 5-week MA, a short-term correction remains a possibility. On the daily chart, buying opportunities were available at the 3-day MA following a strong bullish candle. A pullback to the 5-day MA within the next few days remains possible, and if this happens, it could present another dip-buying opportunity. Based on wave analysis, gold could target around 3,216. To confirm this upside scenario, the daily chart must show stronger bullish momentum, eliminating the risk of MACD divergence.
On the 240-minute chart, gold has been experiencing strong upward momentum, making it a buy-on-dips market. However, for a more comfortable long position, the MACD needs to exceed its previous peak. Overall, a long-only strategy remains preferable. For short positions, it is difficult to pinpoint the exact peak, so strict stop-loss management is essential. This week, key economic events include the ISM Manufacturing & Services PMIs and Friday's U.S. jobs report, which could increase gold's volatility. Stay cautious.
Today marks the final trading session of March. Tariff-related news and gold’s record highs indicate rising market volatility. Stay adaptive to the market’s movements and trade safely as we close the monthly candle.
Wishing you a successful trading day!
If you like my analysis, please follow me and give it a boost!
For additional strategies for today, check out my profile. Thank you!

$KRE CRASH COMING ... Not yet tho..we'll find out..Regional Banks seem to be heading on a slippery path identical to the most previous crash pattern back when they needed all the loan Bailouts. Now that all the loans have stopped, I'm sure some banks may be heading towards loan restructuring perhaps, maybe defaults, I'm not sure honestly. I just know that the chart never lies and I've been watching and waiting for a long while. I predicted the first crash back then and I currently have no doubts with the current chart ahead of me. As always, I will do my best to provide the best insight possible into these speculations. Currently we have the Daily breaking trend and the bar count getting close to the previous 141 bars. The only difference is that we bounce off the 100% retracement. If we continue to lose the 1.27, we'll be headed for the 1.61..... updates soon.

BRIEFING Week #13 : ETH offers perfect opportunityHere's your weekly update ! Brought to you each weekend with years of track-record history..
Don't forget to hit the like/follow button if you feel like this post deserves it ;)
That's the best way to support me and help pushing this content to other users.
Kindly,
Phil
