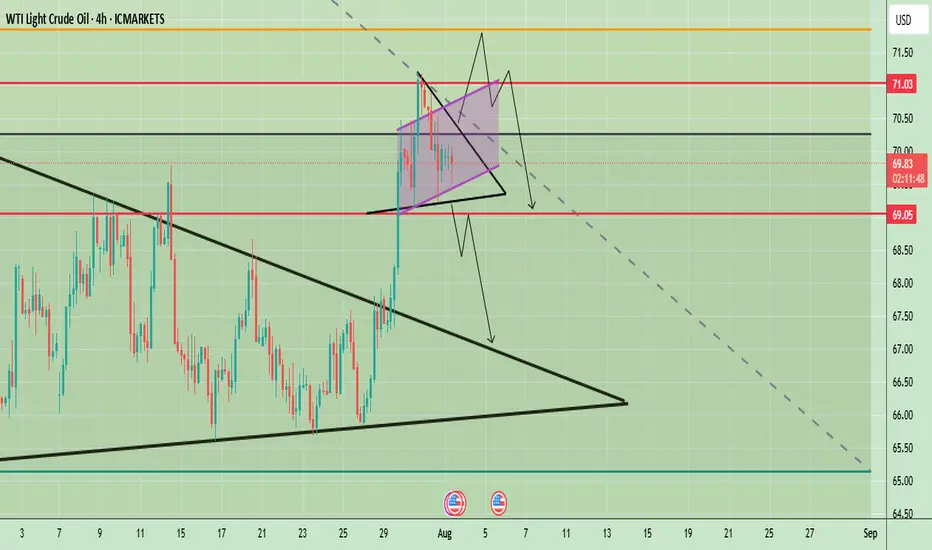
WTI Crude Oil Technical Outlook – Key Breakout or BreakdownWTI Crude Oil 4-hour chart suggests a potential inflection point after a strong bullish breakout from a larger symmetrical triangle pattern in late July. The price surged past key resistance levels and is now consolidating in a smaller symmetrical triangle formation just below the psychological $70 mark. This indicates a phase of indecision following a strong move, with market participants awaiting further confirmation.
Price is currently hovering around $69.82, with key levels marked at $71.03 (resistance) and $69.05 (support). The short-term price action within the tight triangle could determine the next move, with both bullish continuation and bearish reversal scenarios on the table.
Prices remain supported by supply concerns after Trump threatened to impose 100% secondary tariffs on buyers of Russian crude and warned China, a major oil consumer of severe penalties if it continues its purchases of Russian oil.
🔍 Potential Scenarios
- Bullish Breakout Scenario
If price breaks out of the smaller symmetrical triangle to the upside and clears the $70 resistance level with strong momentum, it may quickly test the $71.03 zone. A clean break above $71.03 would confirm the continuation of the previous uptrend, potentially opening room toward $72.50 and beyond in the medium term. The pattern would resemble a bullish pennant — a continuation pattern following the late July rally.
-Bearish Rejection and Breakdown
Conversely, a failure to sustain above $70 followed by a break below the lower boundary of the smaller triangle could lead to a sharper decline. The first critical level to watch would be $69.05; a break below this would likely invalidate the bullish setup and initiate a retest of the previously broken upper trendline of the larger triangle near $67.50. A further breakdown could lead price towards the larger support zone around $65–$66.
📈 Trend Outlook
- Short-Term: Neutral to Bullish — Consolidation in a smaller symmetrical triangle suggests a pause before continuation. However, the structure is still technically bullish unless $69.05 is broken.
- Medium-Term: Bullish Bias — The breakout from the large symmetrical triangle in late July indicates a shift in market sentiment, favoring higher prices unless the price fails to hold above $67.50.
- Long-Term: Cautiously Bullish — As long as WTI holds above the $65–$66 structural support area, the longer-term outlook remains constructive.
Note
Please risk management in trading is a Key so use your money accordingly. If you like the idea then please like and boost. Thank you and Good Luck!
Oilanalysis
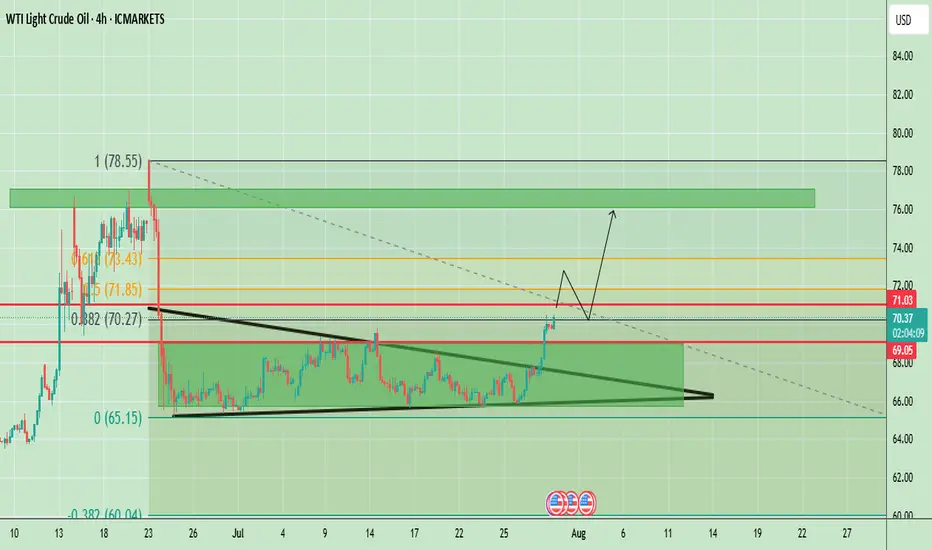
WTI Crude Oil Breaks Out of Symmetrical Triangle, $73-$76 ZoneThe WTI Crude Oil chart shows a strong breakout from the symmetrical triangle pattern that was forming for several weeks. Price has decisively broken above the descending resistance trendline and is now testing the $70–$71 area, which aligns with the 0.382 Fibonacci retracement level (around $70.27) and an important horizontal resistance ($71.03). This breakout indicates strong bullish momentum, supported by the recent series of higher lows and a sharp upward move in recent sessions.
If price sustains above $69.05 (previous breakout zone), we could see a bullish continuation towards $73.40 (0.118 Fibonacci) and potentially to $76.00–$76.50, which is the upper resistance block marked on the chart. However, if the price fails to hold above $69.00, there could be a pullback to retest the broken triangle resistance around $67–$68 before any next bullish leg.
Weekly Chart
The weekly chart of WTI Crude Oil is showing a long-term downtrend channel, where price has been consistently making lower highs and lower lows since mid-2023. Currently, oil is trading around $69.96, showing a sharp bullish push of 6.13% for the week. However, the price is still inside the broader descending channel, which keeps the long-term trend bearish unless a confirmed breakout occurs.
Key Resistance Levels:
- $70.27, $71.03, $73.43
Support Levels:
- $69.05 (previous breakout zone)
- $67.00–$68.00 (triangle retest area)
Trend Outlook:
- Short-Term: Bullish momentum; pullbacks likely to hold above $69.05.
- Medium-Term: If $71.85 breaks, price may target $76.00–$76.50 resistance.
Note
Please risk management in trading is a Key so use your money accordingly. If you like the idea then please like and boost. Thank you and Good Luck!
Crude Oil Trades in Range with Bullish PotentialCrude Oil trades above key support at $64.6, hovering near $66.83. If buyers maintain control, the next upside target is $69.45.
However, a bearish breakdown below $62.42 would invalidate this bullish outlook.

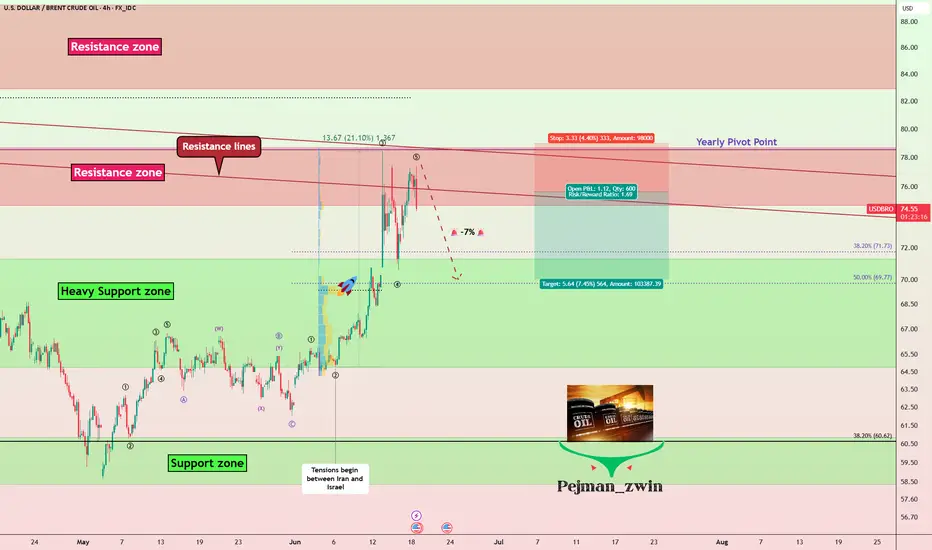
Geopolitics vs. Technical: Will Oil Correct -7%?Oil ( FX_IDC:USDBRO ) rose more than +20% after the start of tensions between Iran and Israel on Friday . I hope this tension ends as soon as possible because tensions have no winners.
The behavior and price movements of oil will certainly depend on the increase or decrease of tensions in the Middle East , but for the coming hours we can have a technical view .
Oil is currently moving in the Resistance zone($78.70-$74.70) and near the Resistance lines and the Yearly Pivot Point .
In terms of Elliott Wave theory , it seems that Oil has completed the second five-impulse waves . So that wave 5 is Truncated .
I expect Oil to decline in the coming hours, this decline could be -7% .
Note: If the USA is added to the Middle East tensions, Oil prices could rise again, so pay more attention to capital management.
Note: Stop Loss: $79.00
Please respect each other's ideas and express them politely if you agree or disagree.
U.S. Dollar/ BRENT CRUDE OIL (USDBRO), 4-hour time frame.
Be sure to follow the updated ideas.
Do not forget to put a Stop loss for your positions (For every position you want to open).
Please follow your strategy and updates; this is just my Idea, and I will gladly see your ideas in this post.
Please do not forget the ✅' like '✅ button 🙏😊 & Share it with your friends; thanks, and Trade safe.
OIL 2 Best Places For Buy Very Clear , Don`t Miss This 1000 PipsHere is my opinion on oil , we have a very aggressive movement to upside and this is normal right now , i`m looking to buy this Pair if the price go back to retest my support and this will be the best place to buy it for me , and if the price moved directly without retest it i will wait the price to break the other res and then i can enter a buy trade and targeting the highest level the price touch it , also if the price go back to retest my support and go up and closed above the other res i will add one more entry with the same target.

Oil Price Rally Stalls at $77.72, Just Below 2025 HighFenzoFx—Oil prices resumed their bullish trend, accelerating after geopolitical tensions in the Middle East. The rally paused at $77.72, just below the 2025 high.
RSI 14 indicates an overbought market, while volume accumulation at $73.7 suggests possible sell orders. A consolidation phase is likely before further gains.
If oil pulls back, key demand zones at $64.00 and $66.00 offer bullish opportunities, with a potential move toward the 2025 high at $80.59.

Crude Oil Tests Monthly High—Bullish or Liquidity Grab? FenzoFx—Crude Oil broke above its previous monthly high at $64.61, trading around $65.27. While a bullish trend is indicated by a 23,000 increase in buy-side contracts, technical signals suggest caution.
RSI 14 shows bearish divergence, and the Stochastic Oscillator remains overbought. Oil could consolidate before resuming its uptrend. Buying breakouts isn’t advised. A dip toward $63.02 may offer a discounted entry.

Liquidity Hunt: Crude Oil's Next TargetFenzoFx—Crude Oil remains below the $64.19 resistance level. The Stochastic Oscillator is in overbought territory, and RSI 14 signals bearish divergence, suggesting a possible price dip.
Oil could briefly surpass $64.19 to grab liquidity before facing selling pressure. In this case, a drop toward the $61.72 support level may occur to fill the bullish fair value gap.
However, if Oil stabilizes above $64.19, the bearish outlook becomes invalid.
>>> Trade Crude Oil without swap and low spread at FenzoFx

Crude Oil is in Buy Side Discount LevelFenzoFx—Crude Oil formed a hammer candlestick pattern near weekly support after losing 4.0% of its value on Thursday. The London session began with a bullish FVG in the lower time frame, with support at $60.55.
The price is expected to target the immediate resistance at $61.3.

Oil Prices Up as Trump Delays EU Tariffs (Temporary Relief?) The global oil market, a sensitive barometer of economic health and geopolitical stability, registered a slight uptick in prices following the news that the Trump administration would extend the deadline for imposing new tariffs on a range of European Union goods. This minor rally, however, comes against a backdrop of a broader downtrend that has characterized the oil markets since mid-January. The persistent downward pressure has been largely attributed to the chilling effect of existing and threatened tariffs, not just between the US and the EU, but on a global scale, which have cast a long shadow over the outlook for global energy demand.
To understand the significance of this deadline extension and its nuanced impact on oil prices, it's crucial to first appreciate the environment in which it occurred. For several months, the dominant narrative surrounding oil has been one of demand-side anxiety. President Trump's "America First" trade policy, which has seen the imposition of sweeping tariffs on goods from various countries, most notably China, and the persistent threat of more to come against allies like the European Union, has injected a significant dose of uncertainty into the global economic system.
Tariffs, at their core, are taxes on imported goods. Their imposition typically leads to a cascade of negative economic consequences. Businesses that rely on imported components face higher input costs, which can either be absorbed, thereby reducing profit margins, or passed on to consumers in the form of higher prices. Higher consumer prices can dampen spending, a key driver of economic growth. Furthermore, the uncertainty created by an unpredictable trade policy environment often leads businesses to postpone investment decisions and hiring, further stagnating economic activity.
This economic slowdown, or even the fear of it, directly translates into weaker demand for oil. Manufacturing activity, a significant consumer of energy, tends to decline. Global shipping and freight, which rely heavily on bunker fuel and diesel, slow down as trade volumes shrink. Consumer demand for gasoline and jet fuel can also wane if economic hardship leads to reduced travel and leisure activities. The retaliatory measures often taken by targeted nations – imposing their own tariffs on US goods – only serve to exacerbate this negative feedback loop, creating a tit-for-tat escalation that further erodes business confidence and global trade flows.
It is this overarching concern about a tariff-induced global economic slowdown that has been weighing heavily on oil prices since the middle of January. Market participants, from large institutional investors to commodity traders, have been pricing in the potential for significantly reduced oil consumption in the months and years ahead if these trade disputes were to escalate or become entrenched. Every new tariff announcement or threat has typically sent ripples of concern through the market, often pushing oil prices lower.
Against this gloomy backdrop, the news of an extension to the tariff deadline on EU goods, while not a resolution, acts as a momentary pause button on further immediate escalation. It offers a temporary reprieve, a brief window where the worst-case scenario of new, damaging tariffs being instantly applied is averted. This is likely why oil prices "edged higher."
The market's reaction can be interpreted in several ways. Firstly, it reflects a slight easing of immediate downside risk to the European economy. The EU is a massive economic bloc and a significant consumer of oil. The imposition of new US tariffs on key European goods, such as automobiles or luxury products, would undoubtedly have a detrimental impact on European industries, potentially tipping already fragile economies closer to recession. An extension of the deadline pushes this immediate threat further down the road, offering a sliver of hope that a negotiated solution might yet be found, or at least that the economic pain is deferred. This deferral, however slight, can lead to a marginal upward revision of short-term oil demand expectations from the region.
Secondly, the extension can be seen as a signal, however faint, that dialogue and negotiation are still possible. In the fraught world of international trade diplomacy, any indication that parties are willing to continue talking rather than immediately resorting to punitive measures can be interpreted positively by markets. It reduces, fractionally, the "uncertainty premium" that has been built into asset prices, including oil.
However, it is crucial to temper any optimism. The fact that oil only "edged higher" rather than surged indicates the market's deep-seated caution. An extension is not a cancellation. The underlying threat of tariffs remains very much on the table. The fundamental disagreements that led to the tariff threats in the first place have not been resolved. Therefore, while the immediate pressure point has been alleviated, the chronic condition of trade uncertainty persists.
The oil market is acutely aware that this extension could simply be a tactical move, buying time for political reasons without altering the fundamental trajectory of trade policy. If, at the end of the extended period, no agreement is reached and tariffs are indeed imposed, the negative impact on oil demand expectations would likely resurface with renewed force. The market is therefore likely to adopt a "wait and see" approach, with traders hesitant to make significant bullish bets based solely on a deadline postponement.
Furthermore, the US-EU trade dynamic is just one piece of a larger global puzzle. The ongoing trade tensions with China, for instance, continue to be a major drag on global growth projections and, by extension, oil demand. Progress, or lack thereof, on that front often has a more substantial impact on oil prices than developments in the US-EU relationship, given the sheer scale of US-China trade and China's role as the world's largest oil importer.
The slight rise in oil prices also needs to be seen in the context of other market-moving factors. Supply-side dynamics, such as OPEC+ production decisions, geopolitical events in major oil-producing regions like the Middle East, and fluctuations in US shale output, constantly interact with demand-side sentiment. A deadline extension on EU tariffs might provide a small boost, but it can be easily overshadowed by a surprise inventory build, an unexpected increase in OPEC production, or signs of weakening economic data from other major economies.
In conclusion, the decision by the Trump administration to extend the tariff deadline on EU goods offered a moment of temporary relief to an oil market that has been under duress from trade war anxieties. This relief manifested as a marginal increase in oil prices, reflecting a slight reduction in immediate perceived risk to global economic activity and oil demand, particularly from Europe. However, this should not be mistaken for a fundamental shift in market sentiment or a resolution to the underlying trade disputes. The threat of tariffs remains, and the broader concerns about a global economic slowdown fueled by protectionist policies continue to loom large. The oil market's cautious reaction underscores the prevailing uncertainty, suggesting that while this extension provides a brief breathing space, the path ahead for oil prices will continue to be heavily influenced by the unpredictable currents of international trade policy.

WTI crude (USOUSD) short continuation .. the week of 12 MayWill price retest the support/resistance zone one more time? That is what I am hoping for. Note that we have been seeing consistently lower highs. Price then broke below the zone, did one retest already and seems to be trying to retest it once again. I am looking for price to enter the zone and then give me some bearish evidence.
Stop – above the zone
1st target can be at 57.00 with the possibility to take this down to 52.00
This is not a trade recommendation; it’s merely my own analysis. Trading carries a high level of risk, carefully manage your capital and risk. If you like my idea, please give a “boost” and follow me to get even more.
It’s not whether you are right or wrong, but how much money you make when you are right and how much you lose when you are wrong – George Soros

Oil - Short Term Sell Trade Update!!!Hi Traders, on April 17th I shared this idea "Oil - Looking To Sell Pullbacks In The Short Term"
I expected to see bearish continuation until the two Fibonacci resistance zones hold. You can read the full post using the link above.
Price moved lower as per the plan here!!!
Price respected the first Fibonacci resistance zone, created a false break of it and moved lower as expected!!!
If you enjoy this idea, don’t forget to LIKE 👍, FOLLOW ✅, SHARE 🙌, and COMMENT ✍! Drop your thoughts and charts below to keep the discussion going. Your support helps keep this content free and reach more people! 🚀
-------------------------------------------------------------------------------------------------------------------
Disclosure: I am part of Trade Nation's Influencer program and receive a monthly fee for using their TradingView charts in my analysis.

Crude oil------sell near 61.60, target 60.00-58.00Crude oil market analysis:
Crude oil has also started to fluctuate recently. Yesterday's daily line finally began to decline. Crude oil is bearish in both the big and small trends. Continue to sell when it rebounds to the moving average. The crude oil pattern is still weak on the daily line. The current suppression position has begun to move down. Crude oil 61.68 is an opportunity to sell. The daily moving average has begun to rush down. Don't intercept it.
Fundamental analysis
Today, we will start to pay attention to the ADP data, as well as PCE data and EIA crude oil inventory data.
Operation suggestions
Crude oil------sell near 61.60, target 60.00-58.00

Oil : April Could Be the Worst Month in Three and a Half YearsOil Prices: April Could Be the Worst Month in Three and a Half Years
As the XTI/USD chart shows:
→ at the beginning of April, WTI crude was trading above $71 per barrel;
→ this morning, on the last day of the month, the price has fallen below $60.
The overall decline may reach 16% — the worst monthly performance since November 2021.
Why Is Oil Falling?
The primary driver behind the sharp drop in oil prices earlier this month was the introduction of new US tariffs, particularly targeting China and the EU. This raised concerns that a potential global trade war could slow economic growth and, in turn, reduce global oil demand.
According to a Reuters poll, the tariffs imposed by Trump have made a global recession in 2025 a realistic risk.
In addition, growing attention is being paid to OPEC+ and its plans to increase oil production. The next meeting is scheduled for 5 May.
Technical Analysis of the XTI/USD Chart
Oil price fluctuations in 2025 have formed a descending channel (highlighted in red), with lower highs and lower lows reflecting continued bearish sentiment.
Bulls may hope for support to emerge around the $58.85 level, as:
→ this has acted as support before (as indicated by arrows);
→ this level aligns with the lower boundary of a local upward trend (shown in blue), which formed after news broke that Trump had postponed the implementation of some tariffs — triggering a sharp rebound in oil prices from the 9 April low.
Nevertheless, the broader structure remains bearish: the rise towards point C appears to be a corrective recovery following the impulse drop from A to B. Given the potential impact of upcoming news — including statements from the White House and OPEC+ decisions — a bearish breakout below the blue channel cannot be ruled out.
This article represents the opinion of the Companies operating under the FXOpen brand only. It is not to be construed as an offer, solicitation, or recommendation with respect to products and services provided by the Companies operating under the FXOpen brand, nor is it to be considered financial advice.

Oil - Short Term Sell Trade Update!!!Hi Traders, on April 17th I shared this idea "Oil - Looking To Sell Pullbacks In The Short Term"
I expected to see bearish continuation until the two Fibonacci resistance zones hold. You can read the full post using the link above.
The price is currently holding in the first Fibonacci resistance zone.
Until both the Fibonacci resistance zones hold my bearish view still remains.
If you enjoy this idea, don’t forget to LIKE 👍, FOLLOW ✅, SHARE 🙌, and COMMENT ✍! Drop your thoughts and charts below to keep the discussion going. Your support helps keep this content free and reach more people! 🚀
-------------------------------------------------------------------------------------------------------------------
Disclosure: I am part of Trade Nation's Influencer program and receive a monthly fee for using their TradingView charts in my analysis.

OIL...SHORT BLACKBULL:WTI
is approaching the key resistance zone at .
I'm watching closely for a valid reaction before considering any position.
***If the level breaks and price retests it successfully, I may consider a counter-directional setup.

Crude Oil Tests Critical Support Level at $65.10FenzoFx—Crude Oil is consolidating below the $65.10 resistance, trading around $64.30. The price remains above the 50-period SMA on the 4-hour chart, confirming a bullish trend. However, the Stochastic Oscillator crossing above 20 signals overbought conditions, suggesting a potential pullback.
If oil stays below $65.10, a bearish wave could follow, targeting $62.31 and then $61.75.
Bullish Scenario: A close and stabilization above $65.10 could trigger the uptrend, targeting $67.60.
>>> No Deposit Bonus
>>> %100 Deposit Bonus
>>> Forex Analysis Contest
All at FenzoFx Decentralized Forex Broker

Crude Oil Stabilizes Above Key Fibonacci LevelFenzoFx—Crude Oil is consolidating after testing $63.9 resistance, trading near $62.23, supported by the 50.0% Fibonacci retracement.
While the bullish trend persists above the 50-period simple moving average, the Stochastic Oscillator shows an oversold condition, hinting at a rebound.
A bullish wave may target $64.00 if Oil holds above $62.00. However, if it dips below this level, momentum could extend down to $60.77, near the 78.6% Fibonacci retracement.
>>> No Deposit Bonus
>>> %100 Deposit Bonus
>>> Forex Analysis Contest
All at FenzoFx Decentralized Forex Broker

Oil - Looking To Sell Pullbacks In The Short TermH4 - Strong bearish move.
No opposite signs.
Currently it looks like a pullback is happening.
Expecting bearish continuation until the two Fibonacci resistance zones hold.
If you enjoy this idea, don’t forget to LIKE 👍, FOLLOW ✅, SHARE 🙌, and COMMENT ✍! Drop your thoughts and charts below to keep the discussion going. Your support helps keep this content free and reach more people! 🚀
--------------------------------------------------------------------------------------------------------------------
Disclosure: I am part of Trade Nation's Influencer program and receive a monthly fee for using their TradingView charts in my analysis.

Crude Oil AnalysisFenzoFx—Crude Oil started a bullish wave from $55.15, trading at around $62.20. Momentum slowed near $63.90 resistance.
The Stochastic Oscillator indicates short-term overpricing as Crude Oil remains below $63.90, keeping the bearish trend intact. Price may dip toward $58.90 support, with further pressure potentially driving it to $55.15.
If Crude Oil surpasses $63.90, the bearish outlook invalidates, targeting $65.10 resistance.
>>> No Deposit Bonus
>>> %100 Deposit Bonus
>>> Forex Analysis Contest
All at F enzo F x Decentralized Forex Broker

Crude Oil Found Support: What's Next?FenzoFx—Crude oil tested the $58.9 level as support and bounced back from it. The primary trend is bearish; therefore, it will likely resume if the price closes and stabilizes below this support.
If this scenario unfolds, the next bearish target could be the $55.15 support level.
>>> Win $160.0 prize every week by joining FenzoFx contest.

Buy oil! Target 63-65!Crude oil is currently in a short position overall, and the rebound momentum is relatively weak. However, in the short-term structure, oil has shown obvious signs of stopping the decline, and the support of the 60-59 area below is still valid.
After hitting the low point of 58.9, oil began to rebound, and the rebound low gradually shifted upward. At present, oil holds the support near 60, and is expected to build a W-bottom structure in the short-term structure, which is conducive to further rebound of oil prices.
Therefore, in terms of short-term trading, you can try to go long on crude oil in the 60.5-59.5 area, and the rebound target will first look at 63, followed by 65
The trading strategy verification accuracy rate is more than 90%; one step ahead, exclusive access to trading strategies and real-time trading settings

Oil - Short Term Buy Idea Update!!!Hi Traders, on March 25th I shared this "Oil - Expecting Retraces and Further Continuation Higher"
I expected to see retraces and further continuation higher. You can read the full post using the link above.
The bullish move delivered as expected!!!
If you enjoy this idea, don’t forget to LIKE 👍, FOLLOW ✅, SHARE 🙌, and COMMENT ✍! Drop your thoughts and charts below to keep the discussion going. Your support helps keep this content free and reach more people! 🚀
-------------------------------------------------------------------------------------------------------------------
Disclosure: I am part of Trade Nation's Influencer program and receive a monthly fee for using their TradingView charts in my analysis.
