The decline in crude is supported,ushering in short-term bullsRoman Roland once said that people often feel that the stage of preparation is a waste of time. Only when the real opportunity comes and they are unable to grasp it, can they realize that their usual lack of preparation is a waste of time.
Recently, it is mainly due to people's concerns about the global economy that have dragged down oil prices. However, the current market worries have eased, and oil prices bottomed out overnight, and there are some opportunities for short-term oil prices to rebound and adjust.In addition, from the trend point of view, after crude oil got rid of the downward channel, it bottomed out yesterday and rebounded to a stabilizing signal, indicating that the previous stage of the decline is almost over, and it is currently entering the cycle of shock and rebound.
In the short-term treatment, the lower support is near 67.9, and the initial pressure above is near 69.8.
In order to facilitate everyone to continue to follow up on my analysis and sharing, you can like and follow me; in addition, I will share the daily real-time strategy in the channel. If you can't follow up in real time, you may make operational errors.You can use the following methods to enter my channel for free to follow the latest news and follow up on market trends in real time.
Oilanalysis

Crude oil continues to fall, where will it stop falling?Crude oil prices continued to fall today, and are currently trading near US 65 per barrel.On the fundamental level, the supply and demand structure of the international crude oil market is still a small oversupply. Unless OPEC has a significant production reduction, it will be difficult to achieve much growth on the demand side.
Although UBS reached an agreement to acquire Credit Suisse over the weekend, and the Federal Reserve and other six major central banks jointly acted to enhance liquidity to appease and stabilize global financial markets, U.S. crude oil once rebounded by more than 1% to US 67.4 per barrel, but worries quickly picked up again, and the United States still has unresolved banking problems. The market is worried that the banking crisis will develop into a global financial tsunami, which in turn will drag down crude oil demand. U.S. crude oil quickly took back gains and continued last week's decline. It is currently down more than 2%, with a minimum of US 64.4 per barrel, which is December 2, 2021. A new low since then.
From the trend point of view, oil prices broke down after a wide-ranging shock at the daily level, and continued to fall after losing the important support of the 70-integer mark. Even if the 70-integer mark was not recovered during the subsequent rebound and the decline continued, the downward break was basically determined. The technical side is biased towards bears, and the future market of oil prices is inclined to further test the support near the December 2021 low of 62.46, and even look at the 60-integer mark.The initial resistance above is near 67. If this position can be recovered, it will increase the possibility of low oil price shock adjustment.
In order to facilitate everyone to continue to follow up on my analysis and sharing, you can like and follow me; in addition, I will share the daily real-time strategy in the channel. If you can't follow up in real time, you may make operational errors.You can use the following methods to enter my channel for free to follow the latest news and follow up on market trends in real time.

Crude oil bears are not finished, predict the trend of crude oilAs the banking crisis hit the global financial and oil markets, NYMEX crude oil and Brent crude oil both fell more than 9% this week, and oil prices will record their largest weekly decline since the week of December 9 last year.
From the perspective of the trend, crude oil rebounded weakly after breaking through the level. Whether it is the daily or weekly line, it is effectively falling below. Pay attention to the trend after a few months of volatility. The market must continue to take advantage of the trend in the short term.
Taken together, crude oil as a whole is still in a bearish trend. At the daily level, crude oil oscillates and breaks downwards, and oil prices lose important support near the 70 mark. The market tends to continue to run downwards in the Bollinger band. The target refers to the position near the low of 62.43 on December 2, 2021.Since oil prices have recorded a longer lower K-line for two consecutive trading days, suggesting strong lower support, a DOJI was recorded on Thursday, and the KD technical indicators are also close to issuing an oversold signal. There is still a possibility of volatility bottoming out in the short term; the initial resistance is near the intraday high of 70, and the short-term resistance can be reasonably lowered to near 68.6-68.8.
In order to facilitate everyone to continue to follow up on my analysis and sharing, you can like and follow me; in addition, I will share the daily real-time strategy in the channel. If you can't follow up in real time, you may make operational errors.You can use the following methods to enter my channel for free to follow the latest news and follow up on market trends in real time.

Is crude oil going up or down next?Oil prices rebounded on Thursday, up more than 2%, as it is expected that Russia will significantly reduce its holdings next month. However, concerns about demand were exacerbated by a strengthening US dollar and a significant increase in US crude oil inventories.
On the news front, Russia plans to reduce its oil exports through western ports by as much as 25% in March, exceeding the previously announced reduction of 500,000 barrels per day, which boosted oil prices during yesterday's session. The US dollar index has risen for the third consecutive trading day, and the latest meeting minutes released by the Federal Reserve on Wednesday showed that most policymakers agreed that the risk of high inflation required further interest rate hikes. According to the US Energy Information Administration (EIA), crude oil inventories increased sharply by 7.6 million barrels to 479 million barrels as of February 17.
On the technical side, after the previous M-shaped pattern, the head and shoulders pattern is also forming, which is a stronger bearish signal than the M-shaped pattern. The overall downward trend is still in place, with bears outnumbering bulls.
In terms of strategy, the news side is hedged between long and short positions, and there will be no significant changes in the short term. The situation of oil prices fluctuating up and down between $70 and $80 is temporarily difficult to break. On the technical side, the short-term rebound will not be sustainable as the head and shoulders pattern is forming. Therefore, my personal view is still bearish in the overall direction.
I hope everyone will click and follow, maintain reading habits, and create opportunities for themselves.If you agree with the point of view, please click Rocket Support
NYMEX:CL1! MCX:CRUDEOIL1! MOEX:BR1! ICEEUR:BRN1! NYMEX:BZ1! MATBAROFEX:WTI1!

Ready to short crude oilThere are still concerns about the banking crisis in Europe and the United States in the market. Some investors are even worried about the arrival of a new round of global economic crisis. Moreover, the market is still worried about the oversupply of crude oil, and the future of oil prices is still biased towards bears.
It was mentioned in the article shared yesterday that once crude oil is established to be effective in breaking below the 70 mark, it is likely to fall further below the low of 66.15 on December 20, 2021 and the low of 62.46 on December 2, 2021. Near the position.At present, since crude oil fell below the low of 72.3 in the shock range, it has fallen sharply again. The lowest has reached near 65.6, and there is only room for 3 US dollars from the low of 62.46 on December 2, 2021. Now the short market is very strong, even in a small cycle, after a short pause or rebound in the falling market, it will choose to fall again, and the bulls have no resistance.Therefore, the current thinking about crude oil is still based on emptiness.
In order to facilitate everyone to continue to follow up on my analysis and sharing, you can like and follow me; in addition, I will share the daily real-time strategy in the channel. If you can't follow up in real time, you may make operational errors.You can use the following methods to enter my channel for free to follow the latest news and follow up on market trends in real time.

Crude oil continues to fall, where will it stop?After the recent bankruptcy of Bank of America, the pessimism of global investors lingered, and the increase in API crude oil inventories was greater than expected. It is expected that oil prices will still be at risk of further decline in the future.
In the trend of crude oil, the short-term decline continued during the day. The current lowest point during the day reached near 69.82, which broke the support near 70.09 at the bottom of the shock box for the past four months since December 9, and fell below the 70 integer mark, which means that oil prices have broken the shock trend for the past four months and have the possibility of accelerating the decline. Once it is established that the fall below the 70 mark is effective, further strong support refers to the low of 66.15 on December 20, 2021 and the low of 62.46 on December 2. Near the position.
In addition, this trading day also needs to focus on the EIA crude oil inventory series data and the IEA monthly crude oil market report.
In order to facilitate everyone to continue to follow up on my analysis and sharing, you can like and follow me.

Crude Oil: Ideas and SolutionsCrude oil market trend analysis:
Crude oil is still in a volatile state, with a bearish close this week but the body of the candlestick did not break through the support level. Therefore, a bullish close is not ruled out next week, and a long position with a bias towards the downside can be considered. The weekly support is around 75.6, with resistance around 80, and it is possible to consider a long position with a high short. On the daily chart, the price stabilized and rose on Friday, with a long upper shadow and a bullish close, suggesting a bias towards an initial rise at the beginning of next week. Support is around 76.1, and there is a long and short division within the day. If it does not break, a long position can be established first. If the market is volatile, there may be an opportunity to long around 75.3, with the first target above 77.4.
Methods to resolve long and short positions:
For investors with high-priced long or short positions, they can use rebound market trends to resolve their positions or reduce positions at a high level. Once the market changes, stop-loss positions should be established and positions should be reversed to compensate for losses.
For investors with mid-priced long or short positions, they can temporarily observe and not rush to cut positions. If there are opportunities in the market, they can reduce positions appropriately, add positions based on trends combined with technical analysis, and compensate for losses.
For investors with low-priced long or short positions, they can use the market downturn to resolve their positions or reduce positions at a low level. Once the market changes, stop-loss positions should be established and positions should be reversed to compensate for losses.
For friends who have positions in the market, since I do not know the specific details of your position, it is difficult to provide corresponding strategies to resolve your positions.
If you need to resolve your problem, you can enter a personal free channel for further information.

Crude oil stepped back to the buying pointRecently, crude oil has experienced a major pullback and is currently in a phase of rebound and volatility. Yesterday's market surged and fell back, and at one point fell to around 77.00. Currently, it has stopped falling and rebounded. From the attached chart below, it can be clearly seen that there have been signals of bullish players laying out their positions at the bottom area, as well as several buy signals during the process of rebound and pullback, which have formed a small rebound wave. Currently, there is another buy signal appearing during the pullback, and with the potential influence of EIA data in the evening, it is highly likely to see another upward rebound. Our focus remains on the resistance level near the 80.90 moving average.
In terms of operation, we continue to adopt a short-term strategy of selling high and buying low.
Specifically, we suggest buying near the 77 level with a small position and paying attention to the breakthrough of 77.8. The specific profit-taking point will be updated in a timely manner in the post.
As for today's EIA , it will depend on everyone's own judgment whether to seize the opportunity or not. Stay tuned and let's reap the harvest together.

OIL: Short above 77 today
Oil saw a high-volume drop below support near 78 yesterday, which turned the immediate position into a resistance level. As of now, there has not been a complete breakthrough and the trend has weakened, so in terms of trading, selling short positions is the main strategy for today, with buying long positions as a secondary strategy.
Specific trading strategies:
Sell short near 77.4-78.5, take profit near 76
Buy long near 75.7-74.2, take profit near 76.5
I will continue to track market trends and share trading strategies in real time. Thank you for your attention and support. If you have any questions, please leave a message in the comments section. I will provide you with the most sincere and responsible solutions to help you solve your problems.
Many things may not yield immediate results at first, but only those who persist in pursuing their goals can experience the joy of success. As the saying goes, "Every cloud has a silver lining." The effort you put in will eventually receive a satisfactory response from time.

Will crude oil continue to rebound strongly? Long or short?In the crude oil market, due to the larger-than-expected decline in U.S. crude oil inventories and bullish expectations for Chinese demand, concerns that the Federal Reserve's more aggressive interest rate increases will slow economic growth and weaken oil consumption have limited the rebound in oil prices, so the crude oil market is still uncertain.
Judging from the trend, the current crude oil has rebounded strongly in the short term after fluctuating at a low level, but it is not enough to change the daily shorting situation, indicating that the overall trend of crude oil at a large level is still weak.Although the short-term rebound is shown on the 2-hour level chart, the short-term rebound is quite strong, but the pressure is heavy above, and the short-term continuity is a problem. It may continue slightly, but it is difficult to say how much room there is to continue without breaking the low range for the time being.Short-term may be accompanied by resistance loops, the market has returned to operate within the weak range.
In terms of strategy, yesterday's thinking was also high-level shorting, but today's thinking is still high-level, supplemented by low-level long-selling.
Crude oil is shorted near 77.8-78, and the first target is near 75.5
In order to facilitate everyone to continue to follow up on my analysis and sharing, you can like and follow me; in addition, I will share the daily real-time strategy in the channel. If you can't follow up in real time, you may make operational errors.You can use the following methods to enter my channel for free to follow the latest news and follow up on market trends in real time.

OIL: Trade at these levels
Recently, the technical trend of crude oil has mainly been volatile, with support around 76.5-75.7 and short-term resistance around 78.1-78.8.
Trading is dominated by short positions, with long positions being secondary.
Specifically, short positions can be entered around 78.15, with a target around 77.5-77, while long positions can be entered around 76.5-76, with a target around 77.5-78.
I will continue to track the market trends in real-time and share strategies. Thank you for your support and attention, and I hope you continue to follow me as it will contribute to the completeness of the trade. I will also share more interesting trading strategies for you to refer to! If you have any questions, please leave a message in the comments section, and I will provide you with the most reliable solution with the most serious and responsible attitude to help you solve the problem!

Oil prices have stopped falling, and the bulls are back?Crude oil was suppressed by fundamentals and high pressure. Yesterday, the daily line fell all the way, and finally the daily line closed the negative line. Crude oil currently continues to maintain a wide range of oscillations on the daily line. The 4-hour level trend is also after a continuous decline. The current deviation rate is slightly too large, and the technical patterns on the small-cycle trend are also beginning to be gradually repaired, and there is a high probability that there will be some room for rebound and repair in the short-term trend.On the news side, short-term attention will be paid to Powell's further remarks and EIA data within the day.
Operationally, crude oil is recommended to be short at 78.3, below the target of 76.6.
In order to facilitate you to continue to follow up on my analysis and sharing, you can like and follow me. In addition, you can enter my channel for free in the following ways to follow real-time views and operational strategies.
TVC:USOIL TVC:GOLD FOREXCOM:XAUUSD

The morale of crude Oil bulls is strong, breakthrough!Fundamentals:
On Tuesday (March 7), international oil prices tended to fluctuate.Previously, the UAE's withdrawal from the Organization of Petroleum Exporting Countries was proved to be untrue, and there was a need for technical correction after the surge in oil prices.And cautious investors are waiting for Fed Chairman Powell's upcoming testimony later this week.However, signs of China's economic rebound have prompted Saudi Arabia to continue to increase its prices in Asia, bringing support to the oil market.
Technical aspects:
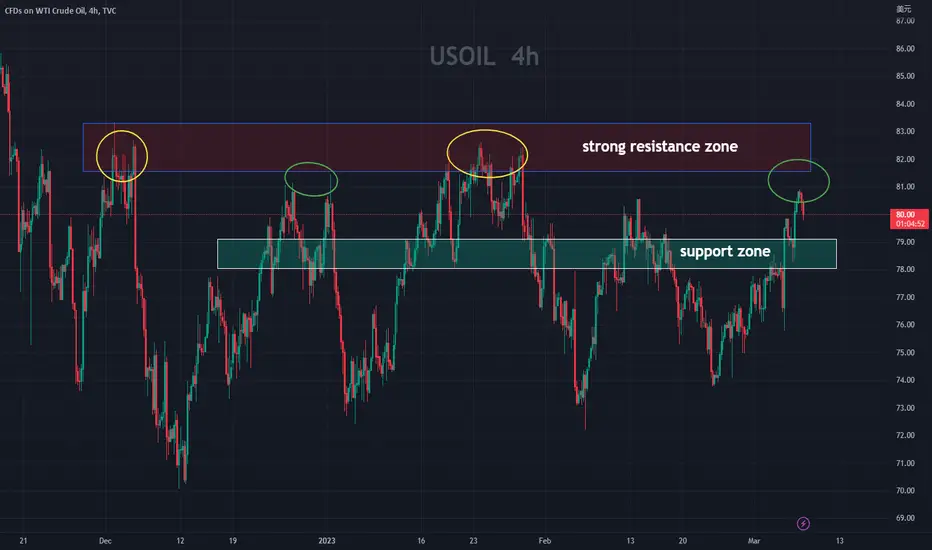
At the daily level, after oil prices have risen for five consecutive trading days, oil prices have initially stood above the 80 integer mark. The daily line has gotten rid of the downward trend channel, and the opening of the technical indicator Bollinger band continues upward. MACD golden fork, KD stochastic indicator golden fork, technical bullish signal continues, if it can withstand the short-term pullback pressure, it is expected to continue to oscillate higher, the initial resistance is near the Bollinger band rail 82; further strong resistance is near 83, which is where the top of the box that has oscillated extensively since the end of November is located. If it breaks further, it will increase the medium- and long-term bullish signal.
At the 4-hour level, oil prices as a whole are still in the channel of rebounding upward trend, but they are still suppressed by the short-term moving average, and the KD stochastic indicator sends a short-term overbought signal. It is still necessary to beware of the risk of short-term oil prices falling back.However, the short-term volatility here is still within the normal range, which is a technical repair to the short-term rally, and the 79 position of the 20-day moving average below has been transformed into a preliminary support position. If this position is lost, it can be judged to weaken the bullish signal in the future.
Taken together, today's short-term crude oil operation ideas are mainly based on stepping back and lower, supplemented by rebounding high altitude, which can be done at the 79 position and the target position is 80.5

Oil: Go long on this range.
After analyzing the 4-hour chart of crude oil, it is found that yesterday's market first fell and then rose, rebounding after reaching support near 78. In the short term, it has broken through resistance at 79 and 80 and now support has formed around 78 and 79. If there is a substantial breakthrough and stabilization around 81.5, there is a high probability of further rising towards the strong resistance level near 83. However, the market currently needs further consolidation and momentum to complete the potential breakthrough, so we recommend shorting at higher levels and going long at lower levels.
The specific recommendations are as follows:
short around 81-80, long around 79-78, with a stop loss of 70 points and a take profit of 200 points for each.
Buy crude oil at 80.43.
The core of trading is not how much profit can be made in a single transaction, but whether one can achieve sustained and stable profitability over the long term.
In the previous article, the strategy given for crude oil was to go long at 78.5, with the target at 80.5, and it was a perfect take-profit. Currently, the support level on the hourly chart is at 80.43, and waiting for a pullback without breaking the support level is a suitable choice.
Current trading plan: Go long at 80.43 for crude oil, with a stop loss at 80.13 and a target at 81.50. I will remind you when the trading point is reached. Liking, commenting, and subscribing are the greatest encouragement for me. Follow me to make trading easier! You are also welcome to refer to other ideas below.

WTI OILWTI Oil, a benchmark for crude oil prices, has been gradually rising recently, indicating an uptrend in the market. By analyzing the available charts, it is possible to identify entry points for traders to buy at the same time as identifying an exit point.
To further refine the strategy, traders can use different technical indicators to help them make informed decisions. One potential approach involves looking for a little pullback on the middle trendline, which can serve as a testing ground for a "BUY" signal.
Overall, this strategy can be effective for traders looking to capitalize on the current trend in the WTI Oil market. By carefully monitoring the charts and utilizing appropriate indicators, traders can identify optimal entry and exit points to maximize their profits.

OIL shaping upOil spot is looking promising for a short term buy into a short position at the top of the range. ill be looking for a impulse and continuation pattern to get involved long, whereas the short position will need a strong rejection and break down. Risk management and patience are king!

Oil buyPeace be upon you. How are you? There is a high probability of oil rising with the formation of the ascending channel and the re-testing of the trand. What do you think my friends

Will oil rise again?An excellent area for oil support, which gives us a very good position with the break of the downward trend line and Gulback
Also, please note that the analysis is done on a weekly basis
⚠️ This Analysis will be updated ...
👤 Banipal : @hosseinbakrani
📅 02.12.2023
⚠️(DYOR)
❤️ If you apperciate my work , Please like and comment , It Keeps me motivated to do better ❤️

OIL Running In 70 Pips 0 Drawdown , Very Important Update Now This Is An Educational + Analytic Content That Will Teach Why And How To Enter A Trade
Make Sure You Watch The Price Action Closely In Each Analysis As This Is A Very Important Part Of Our Method
Disclaimer : This Analysis Can Change At Anytime Without Notice And It Is Only For The Purpose Of Assisting Traders To Make Independent Investments Decisions.

OIL Finally Made Reversal Pattern , 1000 Pips Easy To Catch This Is An Educational + Analytic Content That Will Teach Why And How To Enter A Trade
Make Sure You Watch The Price Action Closely In Each Analysis As This Is A Very Important Part Of Our Method
Disclaimer : This Analysis Can Change At Anytime Without Notice And It Is Only For The Purpose Of Assisting Traders To Make Independent Investments Decisions.

Crude oil💥1D -TIMEFRAME ANALYSISCrude oil💥1D -TIMEFRAME ANALYSIS
💗Hello ladies and gentlemen
This is my new idea for 💥Oil
I hope my idea is clear
Support me by like and share thank you
Stay Safe💯💲💲💲
Good luck💰😍

WTI Bearish flag in PlayMonthly Chart : Prevailing macro sallow bearish channel in play.
Weekly Chart : Breakout of weekly bullish channel in the corrective phase of the market structure.
Daily Chart : Double top intermediate pattern formation within the bearish channel.
4H Chart : Asymmetric expanding mini triangle pattern, with impulse breakout of 1H chart bullish corrective structure.
1H Chart : Almost completed bearish flag, expecting break below 73.50 round number with anticipated zone of interest for tp goal at about
70.00 round number.
