USOIL Long (Idea)Usoil Make Wolfe Wave and its Going to Wave 5
you Can See AB=CD
you See Bullish Chanel
the prive it will Visit 40.20
Oilcrude


OIL CRUDE Analysis H4Recommendation short from lv 33 with target 23,
if breakout lv 33, oil will rally to 41 and drop from 41.

Peaks on OilPrevious resistance points can be observed at $31, $33, and $35 from mid-April.
We could see this rise in Oil price reach one of these peaks, before heading back down as Oil storage reaches a maximum and a second wave of Coronavirus cases occur.
This drop is likely to happen over the coming week, so a good opportunity for a Short on Oil, potentially reaching $20 or even $10.
We may have already hit a peak on Oil for the timebeing, on the other hand, we may hit a peak at one of the mentioned resistance heights in the near future.
Displayed are potential pathways for Oil to head.

Possible peak on OilWe may be currently experiencing a peak before a plunge in Oil.
As world Oil storage reaches near-maximum capacity and a threat of a second wave of Coronavirus cases due to the early easing of lockdowns, the price of Oil may fall drastically to ease these factors.
The price of Oil may fall to lows of $20, or even $10, which are previous Support points.
If the drop occurs, good gains can be made by shorting soon.

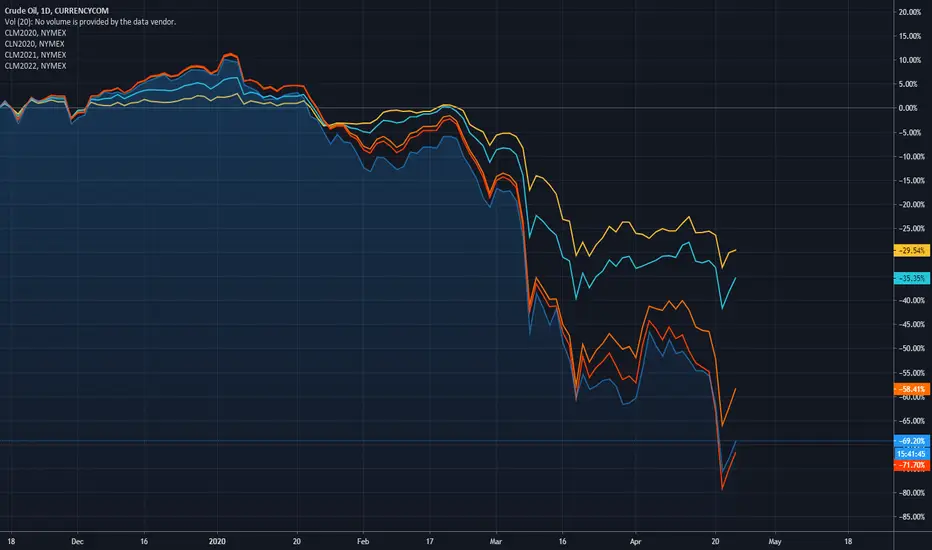
Oil Futures price divergence and convergencePrices of crude oil.
June and July contracts of 2020
June of 2021 and June 2022
SCOI think this is what we are working with here Fam, I'm still long since $37 moved my SL back to $30 thinking to move it back to $28 incase a capitulation wick hits..


OIL - Why botherWhy even bother with trying to time this? Even if it bounces, it could drop. Even if it drops it could bounce. Might as well wait until it gets down back to the trendline, or down to even more ridiculous lows, or something else shows up on the chart. Better off just buying NAT or other tankers, storage, etc. which will go up either way.

Will it plunge like US OIL ? The structure of trade is almost the same. The pandemic is the same, no other name that's Covid-19. There is more 160million barrels stranded in ships oil tank at sea, the capacity of storage is full and the oil / fuel demand is small.

😱 USOIL, WTI — CRASH EXPLAINED! 🤫🤫🤫👋Hello people!
This is the topic of the day.
In short video I explained basics of this price action. 👇
Why it is happening!
Can I buy Oil cheap now?
Global recession?!
Will other markets follow? 👇
Not really. But this is example of Futures trading. And new traders should understand one simple rule — Everything Can Happen!
Thanks for your attention!
Recommend to put like below this video! 👍💗🧡
Write in comments what you think :) ☁︎
Stay tuned to Artem Crypto !

WTI - OIL ANALYSES
Oil prices are as shown below :
Peaked at 1 July 2008 -147 $ plummeted to 35 $
Peaked at 1 July 2014 -107 $ plummeted to 28 $
Peaked at 1 July 2018 - 77 $ plummeted to 21 $ (You can see this in my profile exactly predicted in September 2019 as of 21 $)
Will Peak at 1 July 2020 -60 $ will plummeted to 9.71 $
So until July 1 2020 May be long after badly short.


Oil correction then bull for years?$uso $uwt $dwt $usoil
Potential descending triangle on OIL. Correction to the 30's? Massive bull run and breakout above? I think we'll see oil hit 64-65 before correction next few months and landing sub 40. How low that goes is not important.. This pattern should be concerning.. If oil ultimately breaks above (hmm, what would cause that), it's going to come at a heavy cost to the global economy. Not pretty...


Oil - Zig Zag Correction to $32Between October 2017 and the beginning of 2019, we have seen a 5 wave move from the mid 70's to the low 40's.
Any move that starts with a 5 wave move will end with and at least an equal 5 to complete what is called a Zig Zag pattern.
The was a correction back to test the bottom of the previous wave. This didn't complete a 5 wave move, therefore this must be a 3 wave corrective move, which is the pattern that
sits in the middle of a Zig Zag. An equal move for the top of the 3 wave pattern put the target for oil at $32.
This is confirmed by the RSI failing to get over 60 and forming a double top formation. The entry begin the crossing of the RSI moving averages.
We also saw a large move in the Composite Index, were price did not follow (purple arrow) and a divergence with the RSI giving weight to the analysis.
Any time a indicator moves a great distance and price does not move, and your position is in the direction of the indicator, you are on the wrong side of the market.
This target of $32 is very conservative, as some Zig Zag patterns can run to 1.618 % of the first 5 wave move.
We won't see oil sit a this level for very long, as Zig Zag corrections are a quick and fast way for the market correct, before making a
larger move higher.

Oil Dead Cat Bounce Looking for Proper RejectionThe recent oil dead cat bounce that started at the $45 support level has been struggling and has shown obvious weakness, but the bullish momentum is still intact. This is known by the sequential green count of TD indicator. We are now on a green 7 candle; two more green counts to complete a TD sell setup. However, there is major resistance ahead in the $60 to $63 zone. I will not discuss why I believe this is a dead cat bounce nor why I believe a bottom hasn't formed. The overhead resistance cluster comprises the following:
Two established horizontal levels at $60 and $63.
The 0.236 Fibonacci retracement level when drawn from the $148 high of June 2008.
The moving averages: 30-week around $60 and 50-week around $63.
Price may either get rejected directly by this resistance cluster or get stuck in that zone until it is squeezed between the 30-week and 50-week moving averages into a golden cross, at which point we need to re-evaluate. However, I find it much more probable to be rejected given the weakness of the current dead cat bounce. If it is rejected, then I believe it will re-test the $45 support level.
Check my linked idea on Brent oil futures.

MAJOR SUPPORT LINE INDICATING POSSIBLE REVERSALThread lightly, a correction could occur in this level or a possible reversal in trend

Oil Technical Analysis: OIL slumps to 2-week low near $62.00 The market is likely going to continue to decline towards 62.00 level. The next supports in line are seen at 61.80 and 60.50. OIL 61.80 level H4 200 ma Moving Average, So Oil Take a Buy position 61.00 and 60.50 Area. OIL Daily 200 ma Moving Average 62.60 level breakout and stable this level short Sell 62.50/62.00 level take profit 61.90 and 61.50 Area.
Another side of OIL Stable 62.60 level buy this position, Target 63.50 and 64.00. Oil Resistances are seen at 64.00 and 65.00 level.
Daily SMA100 55.66
Daily SMA200 60.56
Previous Monthly High 60.78
Previous Monthly Low 54.79
Daily Fibonacci 38.2% 65.45
Daily Fibonacci 61.8% 65.76
Today last price 63.02
Today Daily Change -2.12
