OIL: Expected to rebound to $80
The oil price also rose nearly $2 under the stimulus of data, reaching a high near $77. On the 30-minute chart, oil underwent a wave of pullback after consolidating near 76.6, and its current position is the previous consolidation level, which has some resistance but not strong. The short-term strong resistance should be around 77.4.
From a technical standpoint, the current process resembles the formation of a U-shaped bottom, with the MACD indicator in a crossover state. If a death cross occurs, it means that oil prices will experience a short-term pullback to seek support, which is likely to be around 75.6-76.
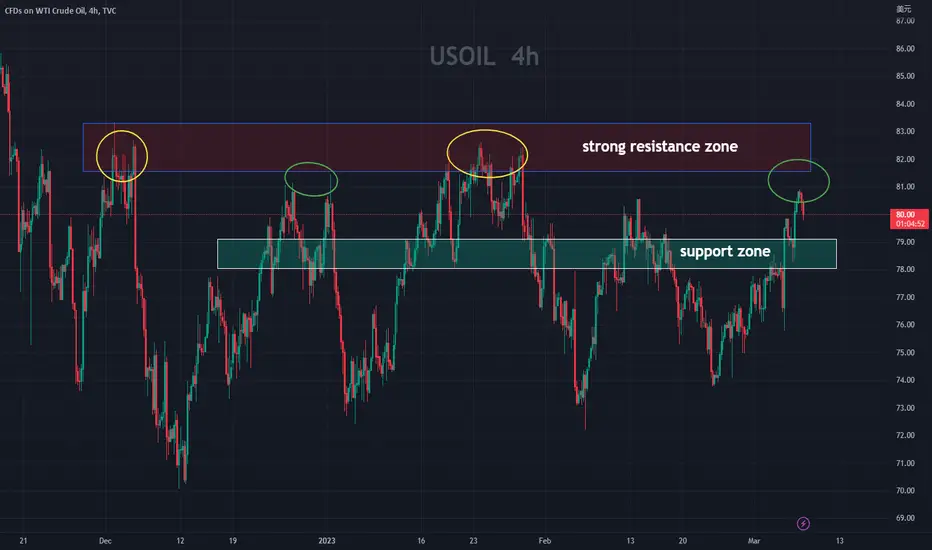
On the 4-hour chart, oil has been oscillating within a box range, and the range of 81-82 is a strong pressure level. The MACD indicator has formed a golden cross, and unless there are unexpected events, the oil price is expected to touch near 81 in the near future.
Therefore, I believe that the current focus should be on long positions for oil, with buying points around the support level near 76. The first target is around 78, and the second target is around 80. If it breaks through 80, it can go up to around 82.
The probability of a one-step trend is not high, and oscillating upward is the most likely event. Every pullback after each rise will be a very good long entry point.
Thank you for your attention and trust. Please continue to follow me, and I will bring you more wonderful insights and help you gain more profits!
Oilforecast

Crude Oil CROSSROAD! Reversal or Breakout? 12.0376.80-77.10-20 is a crucial resistance level.
A break above may lead quickly towards 80.80 and beyond.
Keeping below may lead to retest of 74.90 to 73.20 support trend-line.
74.90 is the trend-line, 73.20 is a cluster of horizontal support.
Keep to the range and be patient!
--------------------------------------------------------------------------------------------------------------
I do advise practicing caution while trading, especially leveraged products.
Do your own research and never trade what you cannot afford to lose.
--------------------------------------------------------------------------------------------------------------

OIL: Short above 77 today
Oil saw a high-volume drop below support near 78 yesterday, which turned the immediate position into a resistance level. As of now, there has not been a complete breakthrough and the trend has weakened, so in terms of trading, selling short positions is the main strategy for today, with buying long positions as a secondary strategy.
Specific trading strategies:
Sell short near 77.4-78.5, take profit near 76
Buy long near 75.7-74.2, take profit near 76.5
I will continue to track market trends and share trading strategies in real time. Thank you for your attention and support. If you have any questions, please leave a message in the comments section. I will provide you with the most sincere and responsible solutions to help you solve your problems.
Many things may not yield immediate results at first, but only those who persist in pursuing their goals can experience the joy of success. As the saying goes, "Every cloud has a silver lining." The effort you put in will eventually receive a satisfactory response from time.

Will crude oil continue to rebound strongly? Long or short?In the crude oil market, due to the larger-than-expected decline in U.S. crude oil inventories and bullish expectations for Chinese demand, concerns that the Federal Reserve's more aggressive interest rate increases will slow economic growth and weaken oil consumption have limited the rebound in oil prices, so the crude oil market is still uncertain.
Judging from the trend, the current crude oil has rebounded strongly in the short term after fluctuating at a low level, but it is not enough to change the daily shorting situation, indicating that the overall trend of crude oil at a large level is still weak.Although the short-term rebound is shown on the 2-hour level chart, the short-term rebound is quite strong, but the pressure is heavy above, and the short-term continuity is a problem. It may continue slightly, but it is difficult to say how much room there is to continue without breaking the low range for the time being.Short-term may be accompanied by resistance loops, the market has returned to operate within the weak range.
In terms of strategy, yesterday's thinking was also high-level shorting, but today's thinking is still high-level, supplemented by low-level long-selling.
Crude oil is shorted near 77.8-78, and the first target is near 75.5
In order to facilitate everyone to continue to follow up on my analysis and sharing, you can like and follow me; in addition, I will share the daily real-time strategy in the channel. If you can't follow up in real time, you may make operational errors.You can use the following methods to enter my channel for free to follow the latest news and follow up on market trends in real time.

OIL: Trade at these levels
Recently, the technical trend of crude oil has mainly been volatile, with support around 76.5-75.7 and short-term resistance around 78.1-78.8.
Trading is dominated by short positions, with long positions being secondary.
Specifically, short positions can be entered around 78.15, with a target around 77.5-77, while long positions can be entered around 76.5-76, with a target around 77.5-78.
I will continue to track the market trends in real-time and share strategies. Thank you for your support and attention, and I hope you continue to follow me as it will contribute to the completeness of the trade. I will also share more interesting trading strategies for you to refer to! If you have any questions, please leave a message in the comments section, and I will provide you with the most reliable solution with the most serious and responsible attitude to help you solve the problem!

The morale of crude Oil bulls is strong, breakthrough!Fundamentals:
On Tuesday (March 7), international oil prices tended to fluctuate.Previously, the UAE's withdrawal from the Organization of Petroleum Exporting Countries was proved to be untrue, and there was a need for technical correction after the surge in oil prices.And cautious investors are waiting for Fed Chairman Powell's upcoming testimony later this week.However, signs of China's economic rebound have prompted Saudi Arabia to continue to increase its prices in Asia, bringing support to the oil market.
Technical aspects:
At the daily level, after oil prices have risen for five consecutive trading days, oil prices have initially stood above the 80 integer mark. The daily line has gotten rid of the downward trend channel, and the opening of the technical indicator Bollinger band continues upward. MACD golden fork, KD stochastic indicator golden fork, technical bullish signal continues, if it can withstand the short-term pullback pressure, it is expected to continue to oscillate higher, the initial resistance is near the Bollinger band rail 82; further strong resistance is near 83, which is where the top of the box that has oscillated extensively since the end of November is located. If it breaks further, it will increase the medium- and long-term bullish signal.
At the 4-hour level, oil prices as a whole are still in the channel of rebounding upward trend, but they are still suppressed by the short-term moving average, and the KD stochastic indicator sends a short-term overbought signal. It is still necessary to beware of the risk of short-term oil prices falling back.However, the short-term volatility here is still within the normal range, which is a technical repair to the short-term rally, and the 79 position of the 20-day moving average below has been transformed into a preliminary support position. If this position is lost, it can be judged to weaken the bullish signal in the future.
Taken together, today's short-term crude oil operation ideas are mainly based on stepping back and lower, supplemented by rebounding high altitude, which can be done at the 79 position and the target position is 80.5

Oil: Go long on this range.
After analyzing the 4-hour chart of crude oil, it is found that yesterday's market first fell and then rose, rebounding after reaching support near 78. In the short term, it has broken through resistance at 79 and 80 and now support has formed around 78 and 79. If there is a substantial breakthrough and stabilization around 81.5, there is a high probability of further rising towards the strong resistance level near 83. However, the market currently needs further consolidation and momentum to complete the potential breakthrough, so we recommend shorting at higher levels and going long at lower levels.
The specific recommendations are as follows:
short around 81-80, long around 79-78, with a stop loss of 70 points and a take profit of 200 points for each.
Ready to buy crude oil again.
Friends who followed my previous article have already sold at the perfect profit point. As expected, the trend is up from 78.5 to 80.5. So, there are still opportunities in the oil market.
Personally, I believe that the 1-hour chart will form support around $80 and then continue to rise. It's not far from the buy point now!
I will update the specific trading strategy later.
Liking, commenting, and subscribing are the greatest encouragement to me. Follow me to make trading easier! Also, welcome to check out my other ideas below.

It caused gold to drop by $100!!!Due to the release of the February non-farm payroll data, gold fell nearly $100. This month, we will soon face the baptism of another major non-farm payroll data, which is a great opportunity for gold traders. As long as we grasp the trend correctly, the profit from a single trade can be considerable. This data will be released on March 10th.
As of the close on March 3, gold has broken through the resistance level of $1850, and the next resistance level of $1860 is within sight. Therefore, in next week's trading, I will continue to go long on gold until the trend changes. I have also prepared myself for the release of the non-farm payroll data, and I believe the results will be very friendly. Let's wait and see.
Here, I will explain how non-farm payroll data affects the price of gold:
The number of non-farm payroll employees is the main indicator of the US employment market, and its impact on gold is significant. Generally, if the non-farm payroll employment number is higher than expected, it means that the US employment and economy are improving, which is good for the US dollar but likely to cause gold to fall. Conversely, if the employment number is lower than expected, it means that the US employment and economy are declining, which is bad for the US dollar but likely to cause gold to rise.
Of course, this is not entirely certain , as unexpected situations may arise. For example, sometimes the market may move in the opposite direction to the data, where the released data is better than the previous value (i.e. bullish data), but gold prices fall. Conversely, sometimes the data is bearish, yet gold prices rise. There are many reasons for this, such as the difference between the released data and the forecast being too small to make a significant impact, the market having already priced in the information before the data release, or other events occurring simultaneously that have a greater impact on the market.
Therefore, when trading, we must pay attention to these aspects of influence and not rely solely on the positive or negative aspects of the data to decide whether to go long or short. I have prepared myself for trading non-farm payroll data, so follow me and let's maximize our profits together!

Brent Confirm the Weakness Brent Confirm the Weakness after Close Under 84.700 , We may trade now in wave C that target level 70.20 …. close above 86.50 cancel this idea

TIME TO BUY ARAMCO !Dear investors, As you can see on the weekly chart, the price last week pulled back on an interesting support it tride to break multiple times and it ended by going up as you can see on the part I drew a box on, after breaking the 1st suport it came back to re test on the main interesting support to continue its way up.
In case you got any question don't hesitate to ask and I'll be answering with pleasure !

SELL CL1!Good morning traders !
As usual today I'm sharing with you my trade on CRUDE OIL, as you can see on the chart on thr 1st arrow there was a fake break out of the channel, now after getting a clear one we got in as sellers and after that the market moved I shared it with you as usual since I can't give it to public at the same time I give it to my clients.
SL and TP set them at your own risk
In case you got any question don't hesitate to ask !

Recap of my trade for todayGood afternoon traders, our trade for today on CRUDE OIL was as good as expected, after breaking the channel we got in with one contract exactly on the candle I put the 1st arrow on on the left, then after having a configuration I can't share with the public we added another contract on the 2nd arrow on the left, then the 3rd contract on the 3rd arrow and finally closed after having a squeeze pattern.
In case you got any question don't hesitate to ask !

OIL SELLWelcome . oil market. in a very negative state. With the price reaching strong support 77.50, and breaking the pattern. double bottom, there is a lot of pressure from sellers to downgrade the market. To 75 levels in the first stage. And level 74 good luck. Note: If you like this analysis, please give your opinion on it. in the comments. I will be glad to share ideas Thank you

WTI OILWTI Oil, a benchmark for crude oil prices, has been gradually rising recently, indicating an uptrend in the market. By analyzing the available charts, it is possible to identify entry points for traders to buy at the same time as identifying an exit point.
To further refine the strategy, traders can use different technical indicators to help them make informed decisions. One potential approach involves looking for a little pullback on the middle trendline, which can serve as a testing ground for a "BUY" signal.
Overall, this strategy can be effective for traders looking to capitalize on the current trend in the WTI Oil market. By carefully monitoring the charts and utilizing appropriate indicators, traders can identify optimal entry and exit points to maximize their profits.

USOIL - CRUDE OIL BULLISH REVERSAL EXPECTED MOVEoil is about to retrace back to 76-78 zone be realistic and never enter before confirmation in LTF
I am not your investment advisor, enter at your own!

oil BrentWe are witnessing a correction in a channelized range that completed the -0.5 shark pattern in this range and we are exactly on the expected correction area of the above pattern, we are in the 50% Fibo area at 75.65 with a little flexibility in the above pattern at the intersection with the midline of the channel along with Two pivot point ranges at the prices of 64.15 and 71.28 can be expected to support the upward movement that can determine the role of the above reduction in dealing with the ceiling.


OIL shaping upOil spot is looking promising for a short term buy into a short position at the top of the range. ill be looking for a impulse and continuation pattern to get involved long, whereas the short position will need a strong rejection and break down. Risk management and patience are king!

Oil buyPeace be upon you. How are you? There is a high probability of oil rising with the formation of the ascending channel and the re-testing of the trand. What do you think my friends

Oil's long term re-test before upcoming rally? 13.2.2023Simple 1+1 equals 2.
There's a couple factors here.
1) Long-term support since March 2023 kept with multiple re-tests.
2) Long-term 8 month wedge consolidation with recent Jan 2023 breakout up together with RETEST of that breakout at 74.80-75.20 as of today.
If the week closes above this support, VERY high chance for continuation of breakout up and 80's-90's even 100 to be reached within coming weeks.
If the support of 74.80-75.20 breaks down, retest of long-term March 2021 to today support trend-line is possible at 71.40-60.
-------------------------------------------------------------------------------------------------------------------
I encourage to do your own research and trade with caution
Thank you for reading and would very much appreciate your comments and questions!
------------------------------------------------------------------------------------------------------------------

CL1 on its way up $CL1! is rocking today right now its sitting at the 61.80% fib level on the 4hr chart im looking for a push up to retest my zone karound $80.00

CRUDE OIL - US OIL - SELL RIGHT NOW INTRADAY TRADEi am not your investment advisor, so its just my analysis on SPX and always go with the flow and never enter without confirmation.
Always use stop loss and always follow the trend as trend is your freind.
Consistency and patence is the key to success!
US OIL CRUDE OIL SELL TRADE
