Oil short readyHi there,
Oil preparing a big move to the downside, since March 2020 lows we are on a new trend, completing the 3 wave we go for the big correction to the downside, Long term, Oil still a buy, but for now look for shorts only.
Watch price action in lower timeframes to go short,
Good luck
Oilforecast

WTI IS NOW SETUP FOR A BIG TUMBLE DOWN A NEW WAVE OF DEFLATION IS JUST ABOUT READY . I would stand side in ALL inflationary assets as of today as an event due oct 4 to 20th is near

USOIL SellAs we saw the movement on the prices of oil the last week we saw strong bullish momentum and high demand on oil during the last week
and on our opinion the OIL may make strong retracement to the south to the level of 76.50 at the level of 61.8% Fibonacci expansion
and then we might see pullback one more time to the current levels at 78.5 from that we may see continuation to the downside with high volatility
and our stop loss will be fixed above the last highest high of the whole bullish movement at the number of 80
and our targets will be 75.50 and 73.50 in sequence
use money management and don't move or remove your stop loss
trade safe

$CL_F support for a continuation higher 75-76 zone is a perfect one to join a bull extension party. Also an excellent low risk long trade entry. From this point an extension higher to 100 is extremely possible.

$GBRNew Concept Energy, Inc. engages in real estate rental business. It owns approximately 190 acres of land located in Parkersburg West Virginia. The company was formerly known as CabelTel International Corporation and changed its name to New Concept Energy, Inc. in May 2008. The company was founded in 1978 and is based in Dallas, Texas. New Concept Energy, Inc. is a subsidiary of Arcadian Energy, Inc.

CL oil futurebe careful of oil? It requires monitoring, and any center of its intervention must be certain

UKOIL monthly technical analysis !TVC:UKOIL
Hi everyone , I hope you're all fine .
- UKOIL has recently broke downtrend and also the price had a pullback to the broken trendline
- Also the price is is moving in a ascending channel
---------------
the next resistances would be :
1- 86.70 (which is the top of channel and also last resistance
2- 116.00 (which is a nice resistance with 4 touches since 2012 and 2016 until now
now let's see some fundamental info about OIL :
- US crude inventories fell more than expected last week, hitting a three-year low, according to the US Petroleum Institute and the US Energy Information Administration. The upward trend in natural gas is likely to lead to increased demand for black gold.
This year, crude oil has grown by more than 80 percent since the beginning of the year, as the global economic recovery from the Corona outbreak significantly boosted demand. On the supply side, OPEC Plus members are also gradually reducing their production restrictions.
In addition, Hurricanes Ida and Nicholas affected production in the United States. The Gulf of Mexico was hit hard in late August (early September) and September (early October), respectively.
Given the imminence of the fourth quarter and the winter season in the Northern Hemisphere, some investors predict a continued upward trend in prices.
The Goldman Sachs Group (NYSE: GS) said the market deficit was higher than expected, raising Brent oil forecast from $ 10 to $ 90 a barrel at the end of the year .
Source : Investing.com
-----
so what's your opinion guys ??
we'd be glad to see your idea in comments .

24th Sep 2021: OIL Price Will Drop To $50.60 Prediction50/60 is the next prediction number.
50.60 is the new number lottery price.
The 50/60 agenda is just about to begin with from the oil.
This will take time. This is not just one day work.
Agenda and cards has been planned on the oil production company.
There will be an event will about to occur between middle party.
50/60 is a clash.
My prediction towards after the pass successful prediction on Putin President to $42.00 per barrel will end its trend.
It is a second chapter.
We will might dont want to hear any hard agenda will be going on towards the Q4.
We will see the secondary reset of the century.
Lots of crash and clash will about to occur.
Keep this number and mind and stay towards the prediction.
Zezu Zaza
2048

OIL Breaking out of the bull flag or another fakeout?Hello and welcome to my post !
OIL is still in a strong uptrend and we are just breaking out from a bullflag.
We are getting strong resistances from EMA100 and MA200.
Something worth mentioning is the purple boxes on the chart, they are indicating previously fake out areas, a think that might happen if the price action dosent break the previously mentioned resistances.
If we continue from here the break of the bull flag strongly the target is 72$.
Indicators: The combination of the overbought SRSI and the mid level RSI suggest a strong momentum for the bulls.
Don't forget to protect yourself with proper Risk Management.
Information provided is only educational and should not be used to take action in the market !
Feel free to ask anything in the comments or send me a message !
Thank you for reading my post,if you liked the idea you can support with a like and a follow have a great day !

Crude Trend analysisDue to a supply scarcity, rising gas and coal prices are gradually driving utilities to convert from gas and coal to fuel oil. Oil-fired power stations have started up in Sweden. Oil demand will be boosted further by the United States' announcement that the travel ban for fully immunized international visitors would be abolished in November. This could result in a big recovery in jet fuel consumption by the end of the year. "US oil producers are battling to regain output, "The Mars and Ursa platforms in the Gulf of Mexico will be shut down until the end of2021, according to Royal Dutch Shell. According to Bloomberg projections, this would cut supplies by about 300,000 barrels."

usoil (strong supply zone!)as you can see we are in a very strong supply zone that can led to the price of oil come down to 45$ but if that area broke to the upside it could go upside till 110$ so for now we will be just be waiting to broke one of this zones but im more bearish on it than be bullish

The FlipThought of this as I saw the further-out Dec'22 & Jun'22 6-months spread flipping through the closer Jun'22 & Dec'21 ; the historical examples are given in the chart in green circles.
Seems like oil is looking higher from here as per the indication of the attached chart.
Let us see how this unravels.

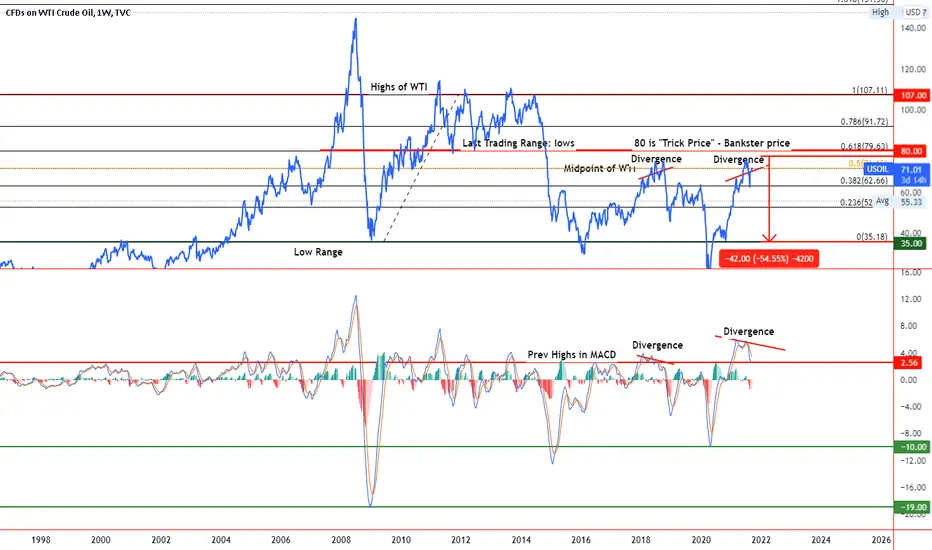
Oil is about to crash. Divergence. Inflation near its end.Oil is its last stand. Dollar is on its rescue from devaluation the currency. No hyperinflation is modern time.
FED bank have printed and push not just oil to record levels from minus prices. Lumber to stellar levels with copper.
Commodity sector is very overpriced over all because of the inflation thats been going on since 2017 and zero rate for 10 years.
We are in Inflation to Deflation status for now. next move is to resurrect the dollar is to midpoint and probably highs again like in 2020 like 97-105 dollars.
With that in mind, everything is going down with the next move. Dollar and VIX and bonds will go up when investors and bankster will go into cash and more secure products.
35 dollar in WTI is most likley in the near future.
prev:
There too many factor playing out and 2021 the Q3-4. Printing more and more money to stabilize market. Wont last.
Too much devaluation of dollar would risk more to the ecnonomy. Money would become worthless and it will never be a hyperinflation again.
Dollar is already hovering around lows but still building upwards. As we seen in 2020 the dollar spike hard at crash of all the bond buying and selling of stocks.
In the greatest Pandamic of all time is the best year for big companies and worst for smaller ones. I proves big things are gonna come very soon. If you look
at all the insider trasaction of 2021 you can see Walmart, Facebook , Amazon, Google , Netflix and many more of the biggest shareholders selling of big profits.
Some every day and some every week. Tells they have fear and retail person have no clue. Time to call this move. The banksters did a massive move from highs with above 20% move
to the upside to liquidate retails marginal calls. Prices of Lumber sored most in history and crash this summer to its lows again. We had minus price in WTI and almost 80 in WTI after its lows.
Big things is going down and it will get a lost worse. Unemployment is still at its highs, what will happend when savings account and stockmarket will fail. 10x the 2008 is coming. By just looking
at the FED system and the debt. We know. By looking at insider trasaction. We know. By looking at technicals are all levels we are going to have a big Deflation/Recession to stabilize the currency of domination
and reset the economy to whats needed. Exit the market or do you placements. But dont get greedy for more upside.
USOIL IN DEPTH TECHNICAL ANALYSIS!Hello my beauties.
I'll be shorting oil until the 56/58 area as it needs to retest a 13 years old trendline. The price broke it to the upside and I don't think it is going anywhere before kissing it.
Oil is now facing a cluster that consists of the following resistances:
- 1 year long uptrend trend line ;
- downward channel trendline;
- inverted head and shoulders neckline.
On top of that, the following indicators suggest downside to come:
- RSI bearish divergence;
- stochastic forming a bearish divergence.
Further reasons why I am taking the trade:
- we have to see an Elliott wave 5 in the current downtrend. For those of you who are not familiar with Elliott waves , wave 5 needs to exceed the lows created by wave 3.
From a short/medium term technical perspective, downside is pretty probable.
After that I'll be bullish for a very long time. The green area evidences where I expect a strong reaction to happen.The weekly volume profile indicator suggests that the most orders have been placed in the 56 area.
I hope this idea helped you, please like, follow and drop a comment below if you have any questions and we'll discuss them together.
Consider supporting me if you believe I provide you with valuable information.
Peace.
Luca, TrickleDownFX

USOIL a possible breakout soon Hello everyone, as we all know the market action discounts everything :)
_________________________________Make sure to Like and Follow if you like the idea_________________________________
The Crude Oil market has shown itself to be resilient as we had initially pulled back but now are turning around to show signs of life again.
In the last 2 weeks, the market has been moving sideways between a Resistance located between 70.40 - 71.04 and a Support of 68.27 - 66.79.
The price has increased from the last drop that happened last month in August by 15% where the market was trading near the 61$ range.
Could this movement be the start of a Bearish long-term trend ??
Notice on the chart that for the last couple of months we've been having lower Tops and lower Bottoms, So if we look at the big picture of the market right now it seems that the market is having a corrective wave at the moment but a certain drop will most likely happen soon.
But Technical Analysis shows that the market is still in a Bullish state.
Possible Scenarios for the market :
Scenario 1 :
The market is having its corrective wave right now and trading near the resistance zone extended from 70.40 - 71.04, If the Bulls were able to group up and gather their power then we might see a breakout happening in that zone which could lead the market back up to the 73.84 resistance level.
The market has formed 3 Outside up candlestick pattern (Strong Bullish Sign).
Scenario 2 :
Looking at the chart we notice that we are having some kind of a Bearish trend (It Could be Small it Could be BIg) and the price has reached the edge of the resistance zone, which could indicate that the bounce down from that zone will happen and it will drop the price to the 68.27 Level, Where the support zone start. A battle will happen between the Bulls and Bears and the Bears will win if it turns out that the bearish move is big, and a further drop will happen which could lead the market back to the 60$ level in the next 2 months.
Technical indicators show :
1) The market is above the 5 10 20 50 100 and 200 MA and EMA (Strong Bullish sign)
2) The RSI is at 56.00 showing strength in the market. No divergences were found between the indicator and the market.
3) The MACD is above the 0 line which indicates that the market is in a Bullish state, With a positive crossover between the MACD line and the Signal line.
Daily Support and Resistance :
support Resistance
1) 69.76 1) 70.40
2) 69.35 2) 70.63
3) 69.12 3) 71.04
Weekly Support and Resistance :
support Resistance
1) 68.27 1) 70.63
2) 66.79 2) 71.51
3) 65.91 3) 72.99
Fundamental point of view :
At the beginning of the week, OPEC ( Organization of the Petroleum Exporting Countries ) will release the latest monthly oil market report. WTI crude oil prices have been weakening since July. This comes amid concerns about the global growth outlook as the Covid Delta variant has been sapping demand woes. US retail sales may also stir volatility, especially if Covid shows increasing signs of making its way into the economy.
Earlier this week OPEC decided to increase output by 400,000 barrels per day (bpd) for the month of October, in line with its gradual plan to reintroduce supply into international markets after drastically withdrawing supply at the start of the pandemic. According to Dailyfx
This is my personal opinion done with technical analysis of the market price and research online from fundamental analysts for The Fundamental point of view, not financial advice.
If you have any questions please ask and have a great day !!
Thank you for reading.


WTIUSD Long USOIL Longi see this setup
i trade 1 min charts
everything is planned
like and share my ideas so that you learn how to actually make money

Oil analysis updateOil ended the week on 64 zone
Probably it will be consolidating
Between 65-64
Strong bearish pressure, no sign of reversals yet
Will update after next structure

Oil looking weak After a correction push it now resting at 67-66 zone
Upside breakout of that white zone could be choppy
Down side breakdown could be smooth
Just about the probability for more chances of easy flow (is downward)
Analysed based on technical charts (considering) daily, 4h, 1h time frame

Analyzing RECAF and USOIL Recently, USOIL and RECAF have both taken a tumble. Named "The Hottest Oil Play in Decades," we surely have more to see from RECAF in 2021 and 2022.
As you can see, USOIL's candlestick progression is clearly notated by the dark grey line displaying price action on the front.
Experts predict USOIL to bottom around $55-60 USD. After that, experts predict OIL to stabilize around $65-80 USD levels. The ultimate top predicted is $100. This would lead to gas prices around $4/gallon for your Suburu's fill up. At around $2.50, we still have plenty of room to run. However, Biden's administration has asked for lower gas prices for now, as the economy continues to recover from COVID. Will the Oil Barons be able to produce more oil to lower gas prices, or will we see gas prices once again rising up? I wouldn't put it out the question.
ACTION PLAN:
Currently, RECAF is still in a bear pattern, though we still a slight uptick today as price actions grapples for the last few bites of the bear.
1. Can RECAF's stock price go down to the most favorable price target for longs, $1.80-3.50 USD? Formidable support levels lie here, protecting it from falling lower.
2. Or will we remain in a bottoming formation pattern around $4.75-5.25 USD? The median price is $6.20 USD and that may be met sooner or later.
Overall long price target for long-term holders: $12.81 USD
Feel free to write your thoughts in the comments as well.

Breaking: The OPEC report is issuedOPEC monthly report was issued a few minutes ago, and the report was not positive for OPEC+ and the oil-producing countries within the group, led by Saudi Arabia. OPEC kept its forecast for oil demand in 2021 unchanged at an increase of 6 million barrels per day, bringing the average to 96.6 million barrels per day, and also kept its forecast for the growth of oil demands in 2022 by 3.3 million barrels per day, bringing the average production to 99.86 million barrels per day.
While OPEC+ raised its expectations for an increase in the production of oil-producing countries outside the group by 840 thousand barrels per day, to reach an increase of 2.9 million barrels per day, with a total average of 66.9 million barrels per day in 2022.
It also raised its forecast for the production growth of oil-producing countries outside the group in 2021 by 270,000 barrels per day to reach 1.1 million barrels per day, with a total average of 64 million barrels per day.

analysis oil crude hello
today i share with you my view about cl , if you have any suggestion you can leave comment here
