Oil Short SetupOil Short Setup
🔵 Entry: $58.51
🟢 TP & RR: $53.68 (4.24)
⛔ Stop Loss: $59.65
REASONS FOR THE TRADE
✔️ Reached upper trendline
✔️ Seems like we are going to form a lower low
✔️ Divergence in the Market Flow indicator
📝 This is continuation of the short setup I posted a few days ago (1). If you are in a trade already this additional short (2) will increase your exposure, so I suggest moving your SL down.
Oilforecast

Oil next down movementHi everyone,
As i mentioned in the past, oil rallied as expected to the target mentioned 50-58, now it will be time to sell it down to 30 usd
Good luck

Oil, End of a 12 years long correction? From an Elliott wave perspective the previous 12 years in oil prices shows a clear ABC shape correction pattern that ended last year.

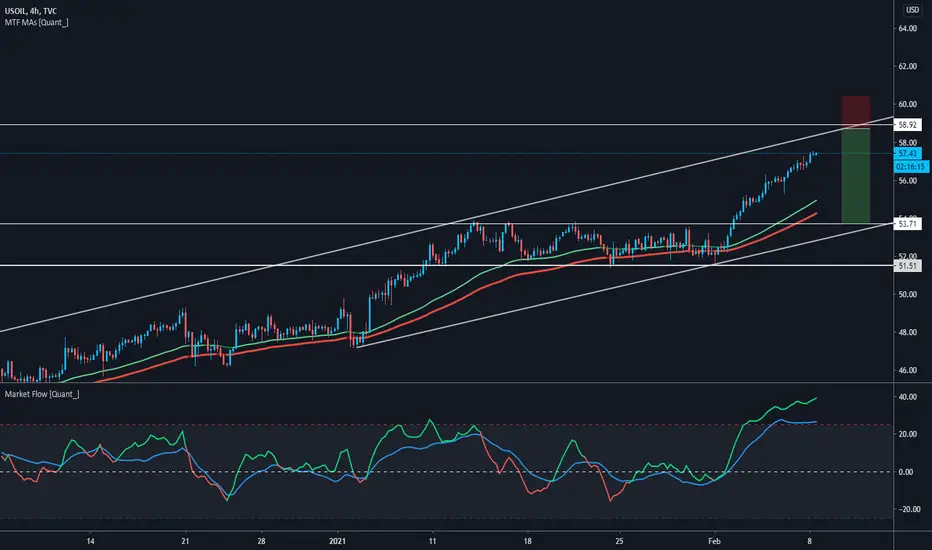
Oil Short SetupOil Short Setup
🔵 Entry: $58.73
🟢 TP & RR: $53.73 (2.91)
⛔ Stop Loss: $60.45
REASONS FOR THE TRADE
✔️ Reaching a strong resistance level
✔️ Market Flow Indicator seriously overbought
✔️ Ascending channel upper trendline resistance
✔️ 1.618 Fibonacci Level (although not plotted on the chart as it becomes a bit clustered)
📝 Stop Loss is above the $59-$60 resistance level, although if you want a more relaxed trade you may move the SL higher to about $61. The confluence of the three factors above makes me believe that the price is due for a pullback if not even trend reversion. I will be monitoring the entry level mentioned above and may open the position prematurely if I see that the price is getting ready to take a dive down.
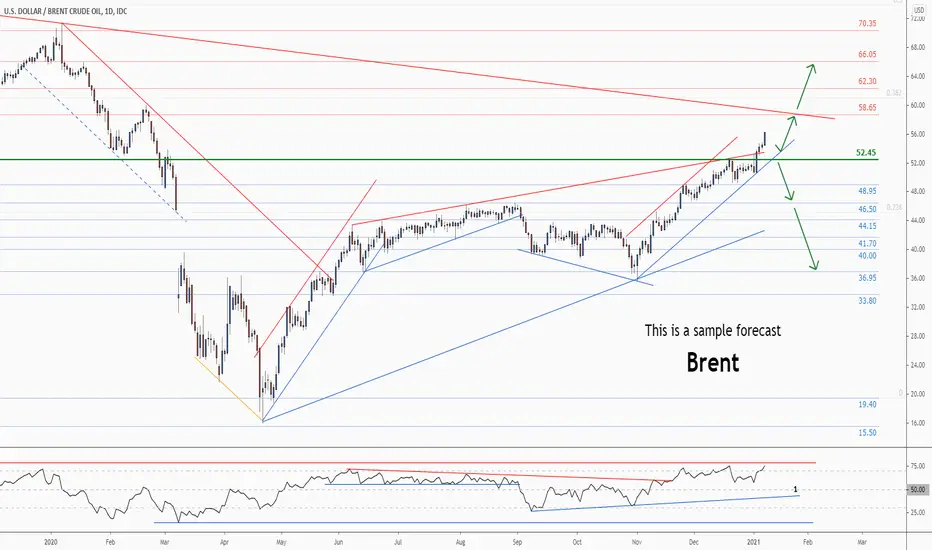
💡Brent Crude Oil - Weekly technical analysis updateMidterm forecast:
54.40 is a major support, while this level is not broken, the Midterm wave will be uptrend.
Technical analysis:
While the RSI uptrend #1 is not broken, bullish wave in price would continue.
A trough is formed in daily chart at 54.40 on 02/01/2021, so more gains to resistance(s) 62.30, 66.05, 70.35 and more heights is expected.
Price is above WEMA21, if price drops more, this line can act as dynamic support against more losses.
Relative strength index (RSI) is 73.
❤️ If you find this helpful and want more FREE forecasts in TradingView
. . . . . Please show your support back,
. . . . . . . . Hit the 👍 LIKE button,
. . . . . . . . . . Drop some feedback below in the comment!
❤️ Your Support is very much 🙏 appreciated! ❤️
💎 Want us to help you become a better Forex trader ?
Now, It's your turn !
Be sure to leave a comment let us know how you see this opportunity and forecast.
Trade well, ❤️
ForecastCity English Support Team ❤️

go short US oil to possible $54Here we can see a nice hourly divergence on US Oil 1 hr charts. Higher prices, bearish indictors so price should move a little lower.
Trading inside a rising wedge as well, a reversal pattern, major support at the green line. Look for the wedge to break to take profits after the break.
We can also see price is in optimum short zone as well above the falling daily trend line and at the top of another rising wedge
Stop loss at $57.30. Not everything works, but most things I post do. Here is another low risk high reward set up you might like to take.
Follow me on trading view for regular updates to this trade.

DBW For Oil. 57 highest possible shorting levelJust posting it for my reference if this will be successful short. I'd be glad to hear comments as I am still on my learning phase.

Short WTIUSDMonthly fib -27 completion
Monthly supply area where it tanked from to zero
Pull back needed for wave 3 up.
Target 50.00 or 5000 in this cfd chart.

Crude Oil Long SetupOil Long Setup
Entry: $53.68
TP & RR: $57.65
Stop Loss: $52.57
REASONS FOR THE TRADE
Contrary to most expectations that Oil was overpriced, it continues to trend up. I won't open a long order at the current level, nor would I short obvious strength. However, if price retraces back to previous resistance, which is now support, I am more than happy to buy. I believe we are now in a channel and we are yet to see how we go through the awaited $55-$56 level.
With that being said, we may not get filled at all. Should this be the case, we will be targeting the upper channel with a short order.


US OIL BULLISHUS oil seems to have a complete monthly correction, CRUDE oil will most likely trade at higher prices in the next coming months.

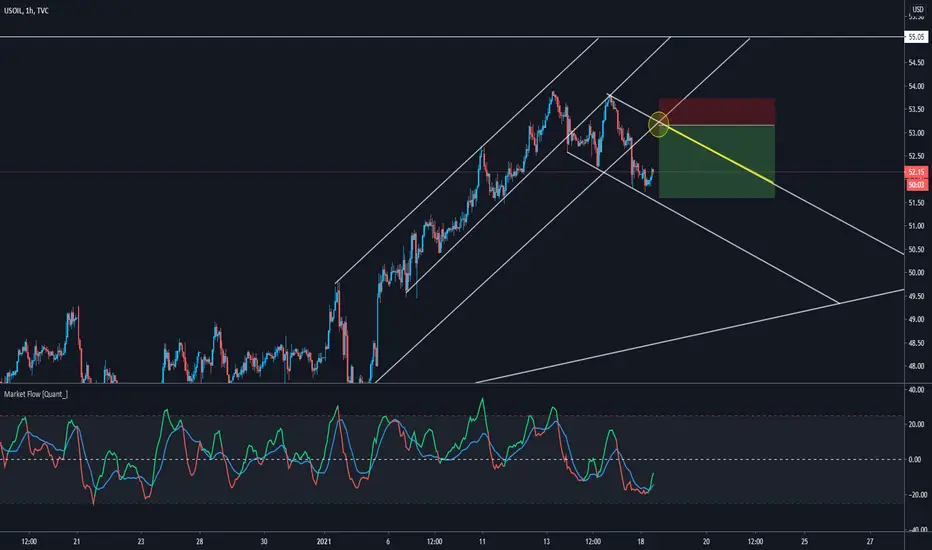
Oil Descending Channel - Short TradeOil Descending Channel - Short Position
Entry: $53.16
TP & RR: $51.61 (2.77)
Stop Loss: $53.72
REASONS FOR THE TRADE
Similarly to my previous trade idea about SPX500 from today, I am placing an alert at $53 and I will be patiently waiting to see how price action develops. You never know what's been going on in the traders' and investors' heads over the weekend, so we want to see the volume and a 1h close around that level before opening a position.
I believe we are now in a downtrend channel, which should bring more balance to that longer-than-expected move up. My entry is quite high and we very much may miss it, so I have highlighted the upper trendline as an entry-level suggestion. Any position around that level with a SL place reasonably high should provide a good trade setup. Ultimately, I am expecting that we reach the $49 level (bigger trendline) before we move up again.
Let me know what you think in the comment section below.
WTI CRUDE LONG TERM VIEWoil prices maybe on the road for another bottom in 2021.
ATH possible in 5 years possible due to massive demands followed by a robust economic recovery .

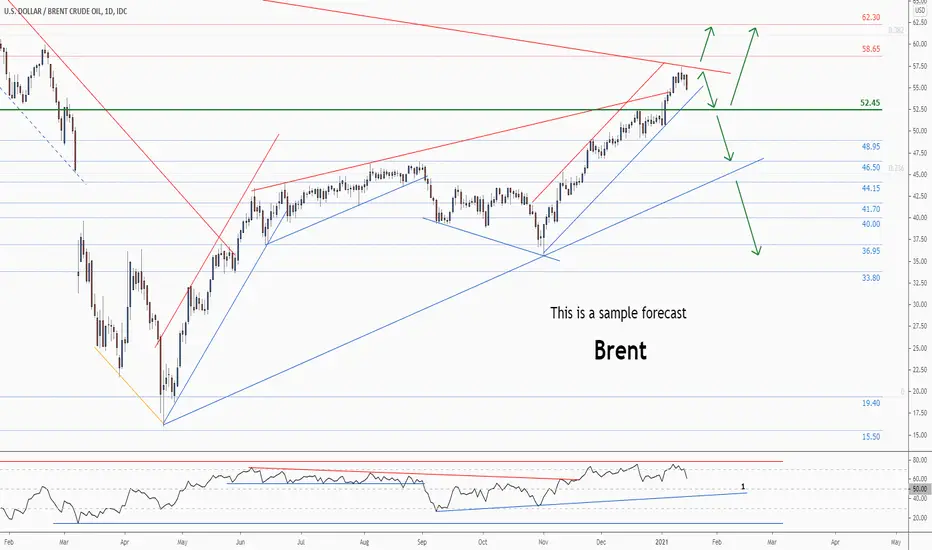
💡Brent Crude Oil - Weekly technical analysis updateMidterm forecast:
52.45 is a major support, while this level is not broken, the Midterm wave will be uptrend.
Technical analysis:
While the RSI uptrend #1 is not broken, bullish wave in price would continue.
A peak is formed in daily chart at 57.25 on 01/13/2021, so more losses minimum to Major Support (52.45) is expected.
Price is above WEMA21, if price drops more, this line can act as dynamic support against more losses.
Relative strength index (RSI) is 61.
❤️ If you find this helpful and want more FREE forecasts in TradingView
. . . . . Please show your support back,
. . . . . . . . Hit the 👍 LIKE button,
. . . . . . . . . . Drop some feedback below in the comment!
❤️ Your Support is very much 🙏 appreciated! ❤️
💎 Want us to help you become a better Forex trader ?
Now, It's your turn !
Be sure to leave a comment let us know how you see this opportunity and forecast.
Trade well, ❤️
ForecastCity English Support Team ❤️

Oil Double Bounce and Up - Long PositionOIL BUY ORDER
Entry: $52.71
TP & RR: $54.66 (4.88)
Stop Loss: $52.31
REASONS FOR THE TRADE
If you followed my trade idea from yesterday, then you know that I was expecting either for the price to bounce from the lower trendline and then start trending up or break through it and take a deep dive down. While the position is still profitable and you may choose to keep it open, here I am suggesting another alternative of how price action may develop.
I think the price will start zig-zagging around the support level, do a double bottom and then start trending up towards the upper trendline from the channel we already defined. The Market Flow indicator turned green, which in my trading system is an indication to close short orders and look for a long one. Those of you holding the short from yesterday may choose to hedge that trade with a long from that level.
The Stop Loss is fairly close, so feel free to adjust it if you are worried it will get hit (especially if the spread on the exchange you are trading on is fairly big).

Oil Time For Reversal - Short TradeOil Short Trade
Entry: $53.76
TP & RR: $52.41
Stop Loss: $54.51
REASONS FOR THE TRADE
So far Oil has respected the channel and I believe that it is now reaching a point of exhaustion. This upper trendline from the channel is also in confluence with a fairly strong resistance level, so I believe a small pullback is due.
The Stop Loss is well above the channel and similarly to the trade from a few days ago, if the price starts pushing up we will close the position because a spike up should follow.

Oil Ascending Channel - Long OrderOil Ascending Channel Long Position
Entry: $51.69
TP & RR: $52.87 (1.59)
Stop Loss: $50.95
REASONS FOR THE TRADE
After breaking up at the ascending triangle, Oil has now formed an ascending triangle, testing the lower trendline. If it holds I believe that it will make a higher high and potentially trying to test the upper trendline or at the very least do a double top.
My Stop Loss is very conservative here because there may be a fakeout and I don't want to get stopped out (my USDJPY trade is still haunting me I guess). As I am writing this I can see that the price is already going up, so I hope a small pullback will give me the entry I want, after which I will start trailing my SL.

💡Brent Crude Oil - Weekly technical analysis updateMidterm forecast:
52.45 is a major support, while this level is not broken, the Midterm wave will be uptrend.
Technical analysis:
While the RSI uptrend #1 is not broken, bullish wave in price would continue.
A trough is formed in daily chart at 50.55 on 12/23/2020, so more gains to resistance(s) 58.65, 62.30, 66.05 and more heights is expected.
Price is above WEMA21, if price drops more, this line can act as dynamic support against more losses.
Relative strength index (RSI) is 76.
❤️ If you find this helpful and want more FREE forecasts in TradingView
. . . . . Please show your support back,
. . . . . . . . Hit the 👍 LIKE button,
. . . . . . . . . . Drop some feedback below in the comment!
❤️ Your Support is very much 🙏 appreciated! ❤️
💎 Want us to help you become a better Forex trader ?
Now, It's your turn !
Be sure to leave a comment let us know how you see this opportunity and forecast.
Trade well, ❤️
ForecastCity English Support Team ❤️