USOIL to hit $41.Crude Oil - Intraday - We look to Buy
Trading within a Corrective Channel formation.
Our expectation now is for this swing lower to continue towards the bottom of the trend channel, to complete a correction before buyers return.
We expect a reversal in this move.
Bespoke support is located at 39.92.
Preferred trade is to buy on dips.
Our profit targets will be 40.75 and 41.29
Resistance: 40.75 / 41.29 / 41.72
Support: 39.92 / 39.51 / 38.90
Oilforecast

The Coming Oil Bust - Oil is DRIPingAn increasingly precarious situation is growing in the black oil kingdom in the Arabian Peninsula. As the clown nation of the US, that has built much of its economy and job market on artificially high oil prices, the Saudis have all the reason to undercut high WTI prices by continuing to ramp up production. While British Petroleum has come to terms with the fact that peak oil is on the horizon, by the 2030s, many other oil companies swoon and maintain their denial that this is just a shortterm thing and we will be back to $75 oil in no time.
www.israelhayom.com
Saudis complacent about oil production cuts
www.resilience.org
Peak oil by 2030s - BP
oilprice.com
Oil will return and grow - Conocophillips
And with the ticking time bomb that is the American economic and political catastrophe lingers, American oil companies (many based in Houston, Texas, a city that has seen extreme growth from oil for decades) have been going bankrupt left and right for years. The vast majority of these companies have benefitted from easy liquidity injections, much like Rex Tillerson's disastrous tenure as CEO at ExxonMobile has led to a disgusting, reckless amount of debt attainment.
www.worldoil.com
200+ American Shale companies gone bust
seekingalpha.com
www.worldoil.com
ExxonMobil's reckless balance sheet
The US has little evidence of returning back to normal, and the bad news just keeps on piling up. Not to mention, so many jobs are becoming state-at-home permanently, I know plenty of people personally have moved back home.
www.theverge.com
And now China is taking austerity measures, even moving to make sure people don't eat more than they're supposed to (you can't make this shit up).
asiatimes.com
China has had an ongoing disaster of a return. Their oil consumption has been less, and with their second largest construction company collapsing, food shortages, natural disasters, livestock sicknesses - it's looking like the mighty China is barely hanging on by a thread while they try to push the narrative that their 3-house-a-person status doesn't mean much (and no one is going to want to buy any of that real estate in those ghost towns. they're all going to collapse before they're even inhabited.)
www.scmp.com
And if you want to throw some propaganda from CNN or some Chinese news outlet about how great China is doing, do yourself a favor and watch the China Hustle and you'll learn all about China's precious economy ;).
P.S. Buy DRIP

BRENT CRUDE OIL 1D-TIMEFRAME ANALYSIS 💡BRENT CRUDE OIL 1D-TIMEFRAME ANALYSIS 💡
Hello ladies and gentlemen
This is my new idea for OIL
My idea is that the oil will goes lower
Targets
36
32
I hope my idea is clear
Support me by like and share
Good luck 💰💯

Might need to short it soonI'm afraid I need to switch my plan for mid term, I don't think it will be able to go above 40.00 without going to 32.80 first thinkingthinking So maybe I will be looking at buy opportunities and selling at 39.80 targeting 33.40
Assuming we're in a beginning of consolidation area now, so buying or selling from the middle not recommended.

WTI outlookAfter correcting to 37 zone, WTI has entered in a range with a top above 41.50 and a bottom at 37 zone.
Now oil is traded near the top of the range and we could have a nice selling opportunity with a R:R of more than 1:3

USOIL SWING TRADE 07-Oct-2020
(WTI) USOIL is trading within a range between 39.100 and 40.750 At 40.750 it got rejected twice and started the bearish run It has formed a inverted head and shoulder during the initial days of this month on right side of the inverted right shoulder morning star was formed which caused further buying pressure and reached 40.750 resistance level. The USOIL price is well below the .236 Fibonacci level
Currently the price is trading below the 40.00 key psychological level. The next downside target would be around 38.00 where we can find previous shoulders level which may act as support for the bullish reversal
SWING TRADE - (WTI) USOIL
Sell @ 39.410
Take profit @ 37.820
Stop lose @ 40.360
Don't risk more than 1% of your capital

DOUBLE BOTTOM IN OIL + EMA resistancesGood day friends..Give us a thumbs up if you like our idea.Follow my profile to get new ideas and trade setups everyday
OIL
Due to the weaker demand in the Global market Oil felled towards the 36.12 which is the September low and then its formed a triangle pattern and went bullish up to 41.43 and traded in a range from September 17 to October 01 and again felled towards 36.63 and formed a dissimilar double bottom
Currently the 200 EMA is acting as resistance for the bull and 50,100 EMA is acting as support for the bull. And my bias is towards the bullish side and the primary target would be around 43.00 which is a swing high area stop lose may placed below the 38.45 price action level
OIL is currently in a consolidation phase if the price well above the 39.50 psychological level we can buy the oil.
Disclaimer
Its a forecast of the next expected moves Not a financial advice

Crude Oil bounces at 36.63 to retest the 38.66 zoneLast week Crude oil closed bearish for the week, retesting 36.63. This week I’m lookin for more bearish momentum and possible continuation to the downside. If price can close below 36.63, next target will be 34.51.
If you have any questions please feel free to comment below.

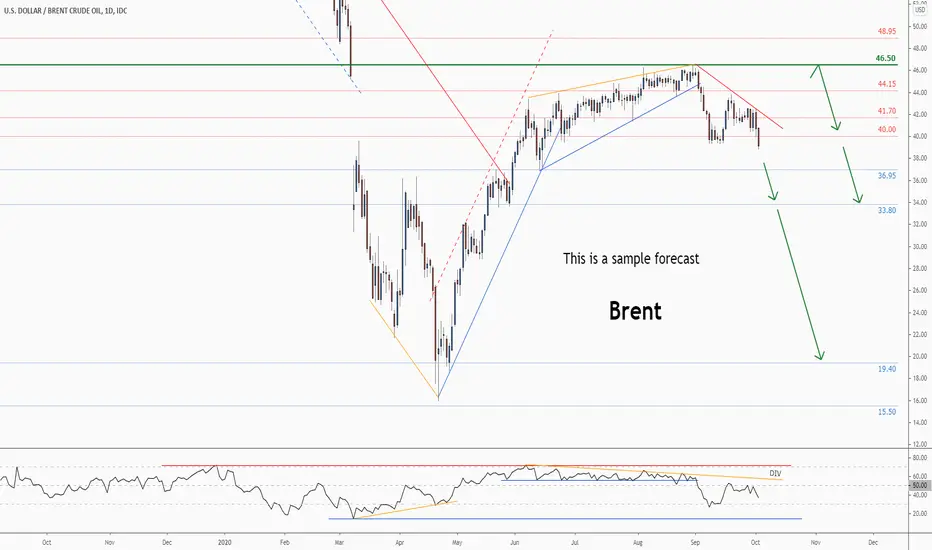
Brent Crude Oil - Weekly technical analysis updateMidterm forecast:
46.50 is a major resistance, while this level is not broken, the Midterm wave will be downtrend.
Technical analysis:
A peak is formed in daily chart at 44.15 on 09/18/2020, so more losses to support(s) 36.95, 33.80, 19.40 and more depths is expected.
Price is below WEMA21, if price rises more, this line can act as dynamic resistance against more gains.
Relative strength index (RSI) is 34.
❤️ If you find this helpful and want more FREE forecasts in TradingView
. . . . . Please show your support back,
. . . . . . . . Hit the 👍 LIKE button,
. . . . . . . . . . Drop some feedback below in the comment!
❤️ Your Support is very much 🙏 appreciated! ❤️
💎 Want us to help you become a better Forex trader ?
Now, It's your turn !
Be sure to leave a comment let us know how you see this opportunity and forecast.
Trade well, ❤️
ForecastCity English Support Team ❤️
WTI OIL ANALYSIS - HOW TO PREDICT THE NEXT BIG MOVESTake a look at our previous Oil ideas and how precisely the levels have been working for us.
If you want analysis on other assets you can feel free to contact us.
FXPROFESSOR

OASJust a thought, same scenario as Whiting Petroleum after Chap 11 was announced. I remember b c I traded WLL many times from .32c-$3 B4 finally the shares were reissued and investors got F**ked.

WTI (Crude Oil) H1 #OutLook 22 September #OutLook 22 September
Dear Traders Today We Have an Analysis Of WTI (Crude Oil) H1. This Analysis Based On Price Action Theory.
According to The Analysis, We Can See That the Market On Bullish Pattern As well As Market Make Formation of the Ascending triangle pattern this indication of the market will move to continue buying. So behalf on that, we have 2 targets (#Resistance @41.35 and @43.77) level of buying for our buy traders.
In this case, the market gives a correction after the trend line breaks out. We have 2 targets (#Support @38.71 and @37.13) for sellers.
I Request to All Before The Trade You Also Match You're Analysis With As If You're Set up Match Then You Can Trade.
Important - Please Take Only 2% Risk On Every Given Analysis That Means You Can Safe In Market Every Time
All The Best 🙏🏻
Thanks & Regard
Enclavefx Technical Team


WTI . Weekly Technical Analysis UpdateMidterm forecast:
While the price is below the resistance 43.75, beginning of downtrend is expected.
We make sure when the support at 37.10 breaks.
If the resistance at 43.75 is broken, the short-term forecast -beginning of downtrend- will be invalid.
Technical analysis:
A peak is formed in daily chart at 41.70 on 09/18/2020, so more losses to support(s) 38.85 and minimum to Major Support (37.10) is expected.
Price is below WEMA21, if price rises more, this line can act as dynamic resistance against more gains.
Relative strength index (RSI) is 49.
❤️ If you find this helpful and want more FREE forecasts in TradingView
. . . . . Please show your support back,
. . . . . . . . Hit the 👍 LIKE button,
. . . . . . . . . . Drop some feedback below in the comment!
❤️ Your Support is very much 🙏 appreciated! ❤️
💎 Want us to help you become a better Forex trader ?
Now, It's your turn !
Be sure to leave a comment let us know how you see this opportunity and forecast.
Trade well, ❤️
ForecastCity English Support Team ❤️

Oil Probably Go downThis is a setup based on the price and volume analysis, oil may drop down especially with market data that support this probosed move.

+50% from now? 🚀WTI on the rise!
After confirming our turnaround zone in yellow, oil is poised for higher prices. The end of wave 3 in green is expected in the area of $60. However, we do not want to see prices dipping below $38.45. Below this support line, chances accumulate that further correction is on the way, as the bears are gaining in strength. Should oil trade below $36.49 a barrel, our primary expectation is no longer valid. In this case, we see prices dropping to $30. All in all, we're at a major inflection point, and we need to break the indicated resistance zone to continue the upwards move. Watch the mentioned marks closely!
What are your expectations for WTI? Feel free to comment below!

Oil rallies after Triangle breakout sell off is comingOIL
We can see a parabolic move from 40.00 to 36.10 after that some minor correction happened in a triangle range. From September 08 to September 15 its formed a triangle pattern and the pattern was just broke on sep 25 and the impulse wave is formed up to 41.50 level
At 41.50 formed a minor head and shoulder and felled towards 38.64 there its finds support from 200 Exponential moving average. And bounced back towards 40.20 there 50,100 EMA's acting as support for the bearish trend
key psychological level 40.00 will be a major hurdle for the bull
At 40.20 both the major right and left shoulder pattern has formed. Currently the price is trading below 23.6% Fibonacci Below which high volume zone will decide the further movement of OIL. After that 50% Fibonacci will act as major resistance
If the price broken below the 50% Fibonacci level the next target would be 37.27 which is 78.6%
On Elliot wave principal Currently the 03 wave is underway which is the longest among Elliot waves
If you found this idea helpful give us a like and do follow our profile so that you can get new ideas and trade setups


OIL IS CALLED BLACK GOLD...WHERE IS IT GOING?Hi again,
I would like to share my journey with Oil. Also called the black Gold. ( I don't want to offend people...and this is not an advice!)
There is lot's going on with oil. After a steady year in 2019 we have lot's of movement in 2020 with Oil and there is more to come!
Personally i always hope to see markets go up....Bull in my heart. It is now in a range as you can see in the charts and we can expect both ways! So be careful. I personally don't know if the rally up is now finished or if it will go up a bit more. I hope the last scenario. But i also keep in mind that it can fall back down easily. Beside aks, supply and demands....there will always be hurricanes, economic crisis and more covid19 cases OR a covid19 vaccin in the neighbourhood to influence the price of gold!
I will hold my (small) buy positions for now. If i see a nice pullback, not too much i will add a small buy. I will open a sell if necessary if i do not see further move up. All my targets and resistance lines are marked in my chart as you can see. Hope you will advantage or insights by checking my charts. I believe sharing is caring!
Good luck and safe trading everyone!


Brent Crude Oil - Weekly technical analysis updateMidterm forecast:
While the price is below the resistance 46.50, beginning of downtrend is expected.
We make sure when the support at 40.00 breaks.
If the resistance at 46.50 is broken, the short-term forecast -beginning of downtrend- will be invalid.
Technical analysis:
A peak is formed in daily chart at 39.56 on 09/14/2020, so more losses to support(s) 41.70 and minimum to Major Support (40.00) is expected.
Price is above WEMA21, if price drops more, this line can act as dynamic support against more losses.
Relative strength index (RSI) is 52.
❤️ If you find this helpful and want more FREE forecasts in TradingView
. . . . . Please show your support back,
. . . . . . . . Hit the 👍 LIKE button,
. . . . . . . . . . Drop some feedback below in the comment!
❤️ Your Support is very much 🙏 appreciated! ❤️
💎 Want us to help you become a better Forex trader ?
Now, It's your turn !
Be sure to leave a comment let us know how you see this opportunity and forecast.
Trade well, ❤️
ForecastCity English Support Team ❤️
