USOIL about to breakout over 41.30+ ITS OIL TIME!Depending on new data study.USOIL looks to breakout to new high level.
Expecting that oil can become to rage 41+
Have all good time (:
If you like this post, pleas give it a like, and follow for more updates.
thank you
# this post are not an advice, and trade on your way.
Oilforecast

WTI Crude Oil Massive SHORT within sight of $40! Dec. PUTsThis should bounce here, briefly, hopefully just enough to start loading Massively on the Dec. 2020, 25.00 PUTs - currently @0.60.
71 calendar days or ~61 trading days should be sufficient.
Wait for those PUTs to first settle down here, following the recent -20% drop - which we caught without sweat. (... it was obvious :-) See attached.

USOIL Looks to increase - Day trade. - Target 39 usd +OIL price looks to increase. Day trade target 39 usd +
Can the USOIL also breakdown?
Yes its also possible that it will breakdown, so thats you must have a good stop limit, but my expecting is that it will increase.
Have good time all (:
# If you like this post, pleas give it a like, and follow me for more updates.
Thank you!


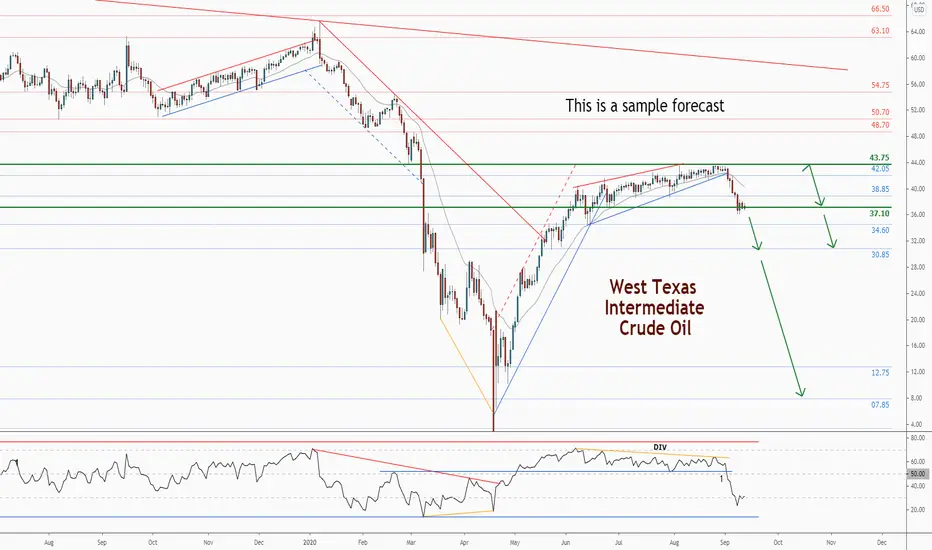
WTI . Weekly Technical Analysis UpdateMidterm forecast:
While the price is below the resistance 43.75, beginning of downtrend is expected.
We make sure when the support at 37.10 breaks.
If the resistance at 43.75 is broken, the short-term forecast -beginning of downtrend- will be invalid.
Technical analysis:
There is a divergence in RSI and price between the peak at 40.565 on 2020-06-08 and the peak at 43.835 on 2020-08-26, the probability of uptrend continuation is decreased and the probability of beginning of downtrend is increased.
The RSI support #1 at 52 is broken, so the probability of beginning of downtrend is increased.
A peak is formed in daily chart at 43.75 on 08/26/2020, so more losses minimum to Major Support (37.10) is expected.
Price is below WEMA21, if price rises more, this line can act as dynamic resistance against more gains.
Relative strength index (RSI) is 32.
❤️ If you find this helpful and want more FREE forecasts in TradingView
. . . . . Please show your support back,
. . . . . . . . Hit the 👍 LIKE button,
. . . . . . . . . . Drop some feedback below in the comment!
❤️ Your Support is very much 🙏 appreciated! ❤️
💎 Want us to help you become a better Forex trader ?
Now, It's your turn !
Be sure to leave a comment let us know how you see this opportunity and forecast.
Trade well, ❤️
ForecastCity English Support Team ❤️

It’s gettin‘ hot in here! 🔥The heat is on!
Either the bulls launch an offensive, or we see prices drop below $30 a barrel. Should the bulls fail in fulfilling this task and prices fall below the support of $36.49, further downward movements are imminent. Invalidation of the underlying scenario occurs below $34.36. Therefore stops for Long ambitions should be placed just below the mentioned support. By dropping below, this support prices in the area of $29 are on the map. However, this would only be a detour, as we expect higher prices towards the end of the year. To confirm a bullish breakout, we need prices above the $43.80 resistance line marking the high of wave b in yellow.
Happy Friday trading! 🎉

#CRUDEOIL #WTI COULD SEE BEARISH CORRECTION BEFORE CONT. UPSIDEAFTER A BREAK IN STRUCTURE LAST WEEK
AND NOW RETEST OF $40-$42 UNDERWAY
WE EXPECT PRICE TO CONT. CORRECTING TO THE $33-$34
PRICE LEVELS BEFORE CONT. HIGHER
TVC:USOIL

Oil- above 40 is a great sellSince mid-June, WTI OIL traded in a long rising wedge. Finally, we had the break of support followed by a 600 pips drop.
Now Oil is recovering some of the losses, but I expect this to be just a correction before a new leg down.
I will look for opportunities to sell WTI above 40 and my target is 32 with a great 1:4 R:R

The plan of the day I have selected the entries based on fibonacci of 1 quarter period, but however pay attention to the down trend if you decided to buy.


Brent Crude Oil - Weekly technical analysis updateMidterm forecast:
. While the price is below the resistance 46.50, beginning of downtrend is expected.
. We make sure when the support at 40.00 breaks.
. If the resistance at 46.50 is broken, the short-term forecast -beginning of downtrend- will be invalid.
Technical analysis:
. There is a divergence in RSI and price between the peak at 43.315 on 2020-06-08 and the peak at 46.525 on 2020-08-26, the probability of uptrend continuation is decreased and the probability of beginning of downtrend is increased.
. The RSI support #1 at 55 is broken, so the probability of beginning of downtrend is increased.
. A peak is formed in daily chart at 46.50 on 08/25/2020, so more losses to support(s) 41.70 and minimum to Major Support (40.00) is expected.
. Price is below WEMA21, if price rises more, this line can act as dynamic resistance against more gains.
. Relative strength index (RSI) is 35.
❤️ If you find this helpful and want more FREE forecasts in TradingView
. . . . . Please show your support back,
. . . . . . . . Hit the 👍 LIKE button,
. . . . . . . . . . Drop some feedback below in the comment!
❤️ Your Support is very much 🙏 appreciated! ❤️
💎 Want us to help you become a better Forex trader ?
Now, It's your turn !
Be sure to leave a comment let us know how do you see this opportunity and forecast.
Trade well, ❤️
ForecastCity English Support Team ❤️

Don't miss the great sell opportunity in WTITrading suggestion:
". There is still a possibility of temporary retracement to suggested resistance line (42.56).
if so, traders can set orders based on Price Action and expect to reach short-term targets."
Technical analysis:
. WTI is in a range bound and the beginning of downtrend is expected.
. The price is below the 21-Day WEMA which acts as a dynamic resistance.
. The RSI is at 40.
Take Profits:
TP1= @ 39.08
TP2= @ 37.13
TP3= @ 34.68
TP4= @ 30.32
TP5= @ 20.44
SL: Break Above 43.91
❤️ If you find this helpful and want more FREE forecasts in TradingView
. . . . . Please show your support back,
. . . . . . . . Hit the 👍 LIKE button,
. . . . . . . . . . . Drop some feedback below in the comment!
❤️ Your Support is very much 🙏 appreciated! ❤️
💎 Want us to help you become a better Forex trader ?
Now, It's your turn !
Be sure to leave a comment let us know how do you see this opportunity and forecast.
Trade well, ❤️
ForecastCity English Support Team ❤️


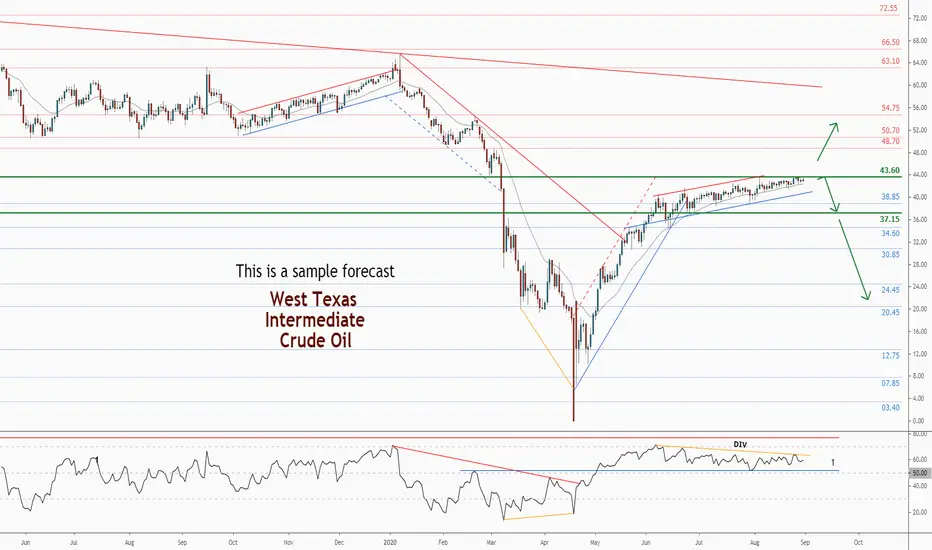
WTI . Weekly Technical Analysis UpdateMidterm forecast:
. While the price is below the resistance 43.60, beginning of downtrend is expected.
. We make sure when the support at 37.15 breaks.
. If the resistance at 43.60 is broken, the short-term forecast -beginning of downtrend- will be invalid.
Technical analysis:
. There is a divergence in RSI and price between the peak at 40.565 on 2020-06-08 and the peak at 43.595 on 2020-08-05, the probability of uptrend continuation is decreased and the probability of beginning of downtrend is increased.
. While the RSI support #1 at 52 is not broken, the probability of price decrease would be too low.
. A peak is formed in daily chart at 43.60 on 08/05/2020, so more losses to support(s) 42.30, 38.85 and minimum to Major Support (37.15) is expected.
. Price is above WEMA21, if price drops more, this line can act as dynamic support against more losses.
. Relative strength index (RSI) is 59.
❤️ If you find this helpful and want more FREE forecasts in TradingView
. . . . . Please show your support back,
. . . . . . . . Hit the 👍 LIKE button,
. . . . . . . . . . Drop some feedback below in the comment!
❤️ Your Support is very much 🙏 appreciated! ❤️
💎 Want us to help you become a better Forex trader ?
Now, It's your turn !
Be sure to leave a comment let us know how do you see this opportunity and forecast.
Trade well, ❤️
ForecastCity English Support Team ❤️

WTI . Weekly Technical Analysis Update Midterm forecast:
. While the price is below the resistance 43.60, beginning of downtrend is expected.
. We make sure when the support at 37.15 breaks.
. If the resistance at 43.60 is broken, the short-term forecast -beginning of downtrend- will be invalid.
Technical analysis:
. There is a divergence in RSI and price between the peak at 40.565 on 2020-06-08 and the peak at 43.595 on 2020-08-05, the probability of uptrend continuation is decreased and the probability of beginning of downtrend is increased.
. While the RSI support #1 at 52 is not broken, the probability of price decrease would be too low.
. A peak is formed in daily chart at 43.60 on 08/05/2020, so more losses to support(s) 42.30, 38.85 and minimum to Major Support (37.15) is expected.
. Price is above WEMA21, if price drops more, this line can act as dynamic support against more losses.
. Relative strength index (RSI) is 59.
❤️ If you find this helpful and want more FREE forecasts in TradingView
. . . . . Please show your support back,
. . . . . . . . Hit the 👍 LIKE button,
. . . . . . . . . . Drop some feedback below in the comment!
❤️ Your Support is very much 🙏 appreciated! ❤️
💎 Want us to help you become a better Forex trader ?
Now, It's your turn !
Be sure to leave a comment let us know how do you see this opportunity and forecast.
Trade well, ❤️
ForecastCity English Support Team ❤️
Oil is next to pick up some steamPlease follow risk management.
Take profit 1: 46.5 $
Take profit 2: 49 $
Trading tactics: At 49 $ 50% of positions should be closed and move the stop loss to break even.
Allow the trends to be broken to build new ones.

Crude Oil - Buying the DipsOil prices are coiling up for a move which will eventually head towards to the mid $60s for the following reasons:
- Bankruptcies
- DXY destruction
- Demand bottoming
- Chaos in the Middle East at some point
Pit stops along the way are marked by the fib extension from the first impulsive move - 0.5 and 0.618 being the most significant.
The simplest strategy is to assume the fib levels are to at first sell the resistance levels and then buy when it flips to support.
Right now it looks like the 0.236 level is now support. Below that you have a possible floor at the macro fib level around $40 - any dips here will likely be bought up quick.
Still long QM @ $42.85
Total Oil P/L: $1,930
All trades linked below.

Oil buy setupDISCLAIMER:
My analysis is just a trading idea! As a trader you should consider your own risk:reward ratio and do proper lot sizing according to your margin and leverage level.
Good Luck!
