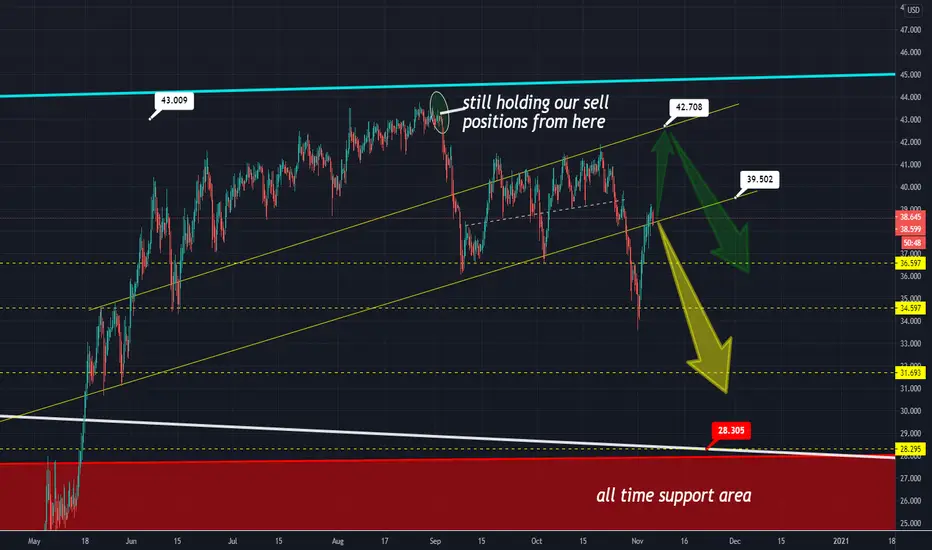
OIL - Our strategy of mixing BUY and SELL positionsOur technical analysis on Oil with the major key price levels.
Fundamentally and technically we see a drop, sooner or later, below 30 usd
At this stage there is a 60% drop, or a 40% rise to 42.50 resistance and a possible drop from there at 90% (10% only to break that level)
HOW WE TRADE THIS:
We have SELL and BUY positions at a rate of 7 (buy) to 3 (sell) (70%-30%)
If the price drops then we have a profit from 40% of the positions
If the price rises we will close all BUY positions at the major resistance of 42.5usd and hold our SELL positions for a drop back to where the price is now and the key take profit levels of 36.60, 34.60 , 31.70 and even the all time support of 30$ and 28.50$.
If all goes well we will consider Buying again at that level.
Take a look at how we perfectly sold in September s idea predicitng perfectly the beginning of the drop,
our tutorial on Oil analysis
Oilfutures

Our success on oil - and what's nexton Sep 2 we poted this idea :
Oil about to drop back to 30 usd
Well.. we are almost there. I guess we were right

OIL WEEKLYOil looks primed to sell off on higher timeframes. as you can see the market structure in place with bearish divergence.


OIL WEEKLYOil looks primed to sell off on higher timeframes. as you can see the market structure in place with bearish divergence.

good time to short oil on lower timeframePullback may be over and ready for downwards impulsive move. price pull back to channel and looks like a double rejection of this level

BRENT CRUDE OIL 1D-TIMEFRAME ANALYSIS 💡BRENT CRUDE OIL 1D-TIMEFRAME ANALYSIS 💡
Hello ladies and gentlemen
This is my new idea for OIL
My idea is that the oil will goes lower
Targets
36
32
I hope my idea is clear
Support me by like and share
Good luck 💰💯

+50% from now? 🚀WTI on the rise!
After confirming our turnaround zone in yellow, oil is poised for higher prices. The end of wave 3 in green is expected in the area of $60. However, we do not want to see prices dipping below $38.45. Below this support line, chances accumulate that further correction is on the way, as the bears are gaining in strength. Should oil trade below $36.49 a barrel, our primary expectation is no longer valid. In this case, we see prices dropping to $30. All in all, we're at a major inflection point, and we need to break the indicated resistance zone to continue the upwards move. Watch the mentioned marks closely!
What are your expectations for WTI? Feel free to comment below!

USOIL ABOUT TO RECOVERYUS OIL looks to recovery to new price rage.
Expecting new recovery
Have good time all !
# like and follow for more updates.
Thank you

Where will oil go?Happy Friday oil traders! Let us pause for a moment and remember those who gave all 19 years ago today... Let us never forget! With that said oil appears to have dropped and is hovering around the June low. There is not much support at this price range so will it go up or continue to fall? I am not sure. I believe it wants to continue back up to its $40-$60 price range and will eventually get there. However, with the market as crazy as it is right now, I think we could see some further downside before that happens. If oil continues to drop I believe it will settle at a bigger support line around $30-$32 range. I hope this helps. Trade responsibly, and have a great weekend!

CLM2021: A 1-Year ForecastThe oil market is held up by new long interest working the sell orders of prior buyers, who are by now feeling the urge to re-enter. In fact, the best time to counter a trend is when the urge gets too prominent; with another 10% of upside here, one can start switching from buy-into-weakness approach to sell-into-strength until that green rate is met by this contract's offer price.

Oil/USD : Brent gradually recoverAfter the big drop in oil prices, however, it recovered gradually swinging
.
However, it is now in a confusing area at resistance and is likely to break it, despite the fact that the barrels of oil have been reduced
.
Moving Average Indicator gives a good indication for the upside. Moving 20 has been breached, and the Moving 50 remains if the break occurred, it will continue.

A SLIPPERY SLOPE FOR USOIL FUTURESAS YOU CAN SEE, I DON'T USE ANY ON CHART INDICATORS SO I'LL KEEP THIS SHORT AND SWEET.
FK ALL THE USELESS TECHNICALITIES ABOUT EMAs, ETC.
USOIL LOOKS TO SLIDE DOWN TOWARD $36.10 AS CONTINUED EFFORTS TO RAISE PRICE HAS FAILED.
FALLING UNDER GROWING PRESSURE AND MOMENTUM, WE COULD VERY WELL SEE PRICE CONTINUE TO SLOWLY DESCEND OVER THE COMING WEEKS. RECENTLY RECOVERING FROM -VALUE LAST SEASON, WHO'S KNOWS WHERE THE TRUE BOTTOM IS FOR USOIL?
NO TP DEFINED RIGHT NOW.
THIS IS A HELL OF A SHORT POSITION HOWEVER, DO YOUR OWN DILIGENCE.

Inter-commodity Spread (Dec20 +RB -CL)Looks like a good opportunity is coming up on this one. Fading the Dec20 RB(buy) CL(sell) Combo IC spread by selling into strength seems reasonable.

OIL Trading PlanPattern: Channel Up on 4H.
Signal: (A) Buy as the price rebounded near the Higher Low trend-line of the Channel Up, (B) Sell if the 4H MA200 breaks.
Target: (A) 42.30 (Resistance) and 43.30 (Higher High of the pattern) in extension, (B) 38.00 (the Higher Low of the wider Channel Up).
Most recent signal:
** Please support this idea with your likes and comments, it is the best way to keep it relevant and support me. **

USOILExplains why your friendly short(s) do what they do! Just sharing my view, not a trading call.. Good Luck.

WTI OIL Buy SignalPattern: Channel Up on 4H.
Signal: Bullish as a bottoming fractal has been formed after the price bounced near the Higher Lows trend-line since May 27 and the RSI bounced near the Lower Low trend-line of its Channel Down.
Target: 42.00 (just below the Higher High of the Channel Up).
** Please support this idea with your likes and comments, it is the best way to keep it relevant and support me. **
Previous WTI signal:


CRUDE OIL - SELLPrice is consolidating in the channel.
Once it hit this level before it dropped significantly so i expect once support is broken OIL will fall to the green highlighted area.

CLQO: Up by 100%! What's next?Further to the earlier idea related to CLQ2020 contract in which there was a 100% up projection within certain time, it is now established that this contract traded the 100% up area from its YTD low, and that it is currently working the offers at this key zone. The sudden downside for long exposure that we saw earlier on today is most likely an effect of traders squaring off long exposure via profit booking. If aggressive bears are unable to gain momentum in this key area, the buy stops will surely increase the counter momentum. Staying tuned in for more.


