Oil Surges on Israel-Iran Nuclear Strike Fears🛢️ Israel’s attacks on Iran’s nuclear sites are pushing oil ( BLACKBULL:WTI , BLACKBULL:BRENT ) higher!
Bloomberg reports Trump’s G-7 exit and Tehran evacuation warning as Israel-Iran strikes intensify (June 17, 2025). Analysts warn of Strait of Hormuz risks, with 17M barrels/day at stake.
4H Chart Analysis:
Price Action: WTI ( BLACKBULL:WTI ) broke $75 resistance (June 2025 high), exiting a 3-week range. Brent ( BLACKBULL:BRENT ) mirrors at $78.
Volume: 4H volume spiked 15% vs. prior week, confirming breakout buying.
Key Levels:
Current Support: $75 (WTI), $78 (Brent) – former resistance, now support.
Next Support: $73 (WTI), $76 (Brent) – prior range lows, tested twice in June.
Context: Oil gained 2% this week, driven by Middle East supply fears, with WTI at a 1-month high.
Trading Insight: The $75/$78 breakouts signal bullish momentum. $73-$76 is a key support zone for dips. Watch Iran retaliation news and volume for supply disruption clues.
What’s your 4H oil trade? Post your setups! 👇 #OilPrice #WTI #Brent #IsraelIran #TradingView
Oilprice

Oil Extends Rally as Israel-Iran Conflict Stokes Supply FearsBrent jumps 5.5 %, bullion hits fresh records, but analysts still see $65 crude by Q4 if key shipping lanes stay open
The crude-oil market loves nothing more than a geopolitical headline, and the one that flashed across terminals this past weekend was a whopper: escalating hostilities between Israel and Iran. Within minutes of the first wire stories, Brent crude vaulted 5.5 % to an intraday high of $76.02 a barrel—its largest single-session pop since Russia invaded Ukraine in early 2022—before giving back part of the gain to settle just under $76. West Texas Intermediate (WTI) traced a similar arc, peaking at $74.11 and closing fractionally lower.
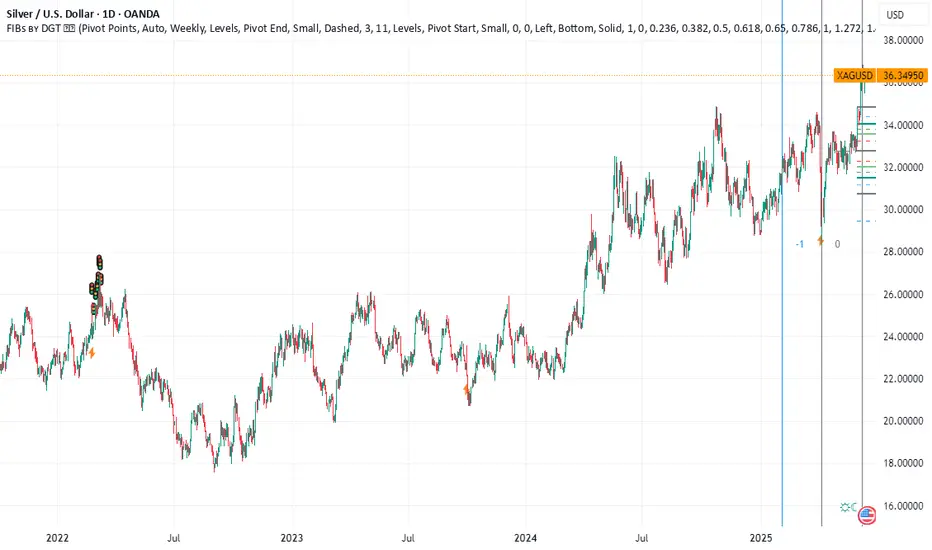
At the same time, investors stampeded into traditional havens. COMEX gold pierced $2,450 an ounce for the first time, while silver sprinted above $33—blowing past the decade-old high set during the meme-metal frenzy of 2021. The twin moves in energy and precious metals underscore how fragile risk sentiment has become even as global demand growth, OPEC discipline, and U.S. shale resilience point to a more balanced physical market later this year.
Below we dissect the drivers of crude’s latest surge, explore the scenarios that could push prices back toward—or away from—the $65 handle by the fourth quarter, and explain why bullion refuses to loosen its grip on record territory.
________________________________________
1. What Sparked the Spike?
1. Tit-for-tat escalation. Reports of Israel striking Iran-linked assets in Syria and Iran responding with drone attacks near the Golan Heights raised fears of a direct Israel-Iran confrontation—a worst-case scenario that could spill into the Strait of Hormuz and threaten 20 % of global seaborne oil.
2. Thin pre-holiday liquidity. Monday volume was 30 % below the 20-day average with several Asian markets closed, exaggerating price swings and triggering momentum-chasing algos.
3. Options market gamma squeeze. Dealers short upside calls scrambled to hedge as spot pierced $75, accelerating the melt-up. Open interest in $80 Brent calls expiring in June ballooned to 45,000 contracts—four times the 3-month norm.
________________________________________
2. How Real Is the Supply Risk?
While the headlines are chilling, physical flows remain intact for now:
• Strait of Hormuz: No tankers have been impeded, insurance premia have widened only 25 ¢ per barrel—well below the $3 spike seen after the 2019 Abqaiq attack in Saudi Arabia.
• Iraqi-Turkish Pipeline: Still shuttered for unrelated legal reasons; volumes have been offline since March 2023 and are therefore “priced in.”
• Suez Canal / SUMED: Egyptian authorities report normal operations.
In short, the rally is risk premia, not actual barrels lost. That distinction matters because premia tend to deflate quickly once tension plateaus, as the market witnessed in October 2023 after Hamas’s initial assault on Israel.
________________________________________
3. Fundamentals Point to Softer Prices by Autumn
Four forces could push Brent back into the $65–68 corridor by Q4 2025 if the geopolitical situation stabilizes:
Force Current Status Q3–Q4 Outlook
OPEC+ Spare Capacity ~5.5 mbpd, most in Saudi/UAE
Ability to add 1–2 mbpd if prices spike
U.S. Shale Growth 13.3 mbpd, record high +0.6 mbpd y/y, breakeven $47–55
Refinery Maintenance Peak spring turnarounds remove 1.5 mbpd demand Units restart by July, easing crude tightness
Global Demand +1.2 mbpd y/y (IEA) Slows to +0.8 mbpd on OECD weakness
Add seasonal gasoline demand ebbing after August, and the supply-demand balance tilts looser just as futures curves roll into Q1 2026 deliveries—a period typically beset by refinery slowdowns and holiday travel lulls.
________________________________________
4. Scenario Analysis: Three Paths for Brent
1. Escalation (20 % probability)
• Direct Israeli strike on Iranian territory → Tehran targets Hormuz traffic
• 3 mbpd disrupted for one month
• Brent overshoots to $100+, backwardation widens above $10
• Biden releases 90 mb from the SPR; OPEC signals emergency meeting
2. Containment (60 % probability)
• Hostilities remain proxy-based in Syria/Lebanon; shipping unscathed
• Risk premium bleeds off; Brent drifts to $70–72 by July
• By Q4 oversupply emerges; prices test $65
3. Detente (20 % probability)
• U.S.-mediated cease-fire; hostages exchanged
• Iran de-escalates to focus on reviving JCPOA talks
• Risk premium collapses; Brent revisits mid-$60s by August and low-$60s into winter
________________________________________
5. Why Gold and Silver Are On Fire
The precious-metals rally is less about oil and more about real yields and central-bank buying:
• Real 10-year U.S. yield sits at 1.05 %, down from 1.55 % in February, boosting gold’s carry cost competitiveness.
• PBoC & EM central banks added a net 23 tonnes in April—the 17th straight month of net purchases.
• ETF inflows turned positive for the first time in nine months, adding 14 tonnes last week.
Silver benefits from the same macro tailwinds plus industrial demand (solar panel capacity is growing 45 % y/y). A tight COMEX inventory cover ratio—registered stocks equal to just 1.4 months of offtake—amplifies price sensitivity.
________________________________________
6. Cross-Asset Implications
1. Equities: Energy stocks (XLE) outperformed the S&P 500 by 3 % intraday but could retrace if crude fizzles. Miners (GDX, SILJ) may enjoy more durable momentum given new-high psychology.
2. FX: Petro-currencies CAD and NOK rallied 0.4 % vs. USD; safe-haven CHF gained 0.3 %. JPY failed to catch a bid, reflecting carry-trade dominance.
3. Rates: U.S. 2-year yields slipped 6 bp as Fed cut odds edged up on stagflation fears, but the move lacked conviction.
________________________________________
7. What Could Invalidate the Bearish Q4 Call?
• OPEC+ Discipline Frays: If Saudi Arabia tires of single-handedly absorbing cuts and opens the taps, prices could undershoot $60—but Riyadh’s fiscal breakeven (~$82) makes this unlikely.
• U.S. Election Politics: A new White House may re-impose harsher sanctions on Iran or ease drilling restrictions, tilting balances either way.
• Extreme Weather: An intense Atlantic hurricane season could knock Gulf of Mexico output offline, squeezing physical supply just as refineries demand more feedstock.
________________________________________
8. Trading and Hedging Playbook
Asset Bias Vehicles Key Levels
Brent Crude Fade rallies toward $80; target $68 by Oct ICE futures, Jul $70 puts Resistance $78.80 / Support $71.30
WTI Similar to Brent NYMEX CL, calendar-spread (long Dec 24, short Dec 25) Resistance $75.20
Gold Buy dips if real yields fall below 0.9 % Futures, GLD ETF, 25-delta call spreads Support $2,390
Silver Momentum long until $35; tighten stops Futures, SLV ETF, 2-month $34 calls Resistance $36.20
Energy Equities Pair trade: long refiners vs. short E&Ps ETFs: CRAK vs. XOP Watch crack spreads
Risk managers should recall that correlation spikes under stress: a portfolio long gold and short crude looks diversified—until a Middle-East cease-fire nukes both legs.
________________________________________
9. Macro Backdrop: Demand Still Fragile
Even before the flare-up, oil demand forecasts were slipping:
• OECD: Eurozone PMIs languish below 50; German diesel demand –7 % y/y.
• China: Q2 refinery runs flatlining; teapot margins < $2/bbl.
• India: Bright spot with gasoline demand +9 %, but monsoon season will clip growth.
On the supply side, non-OPEC production is rising 1.8 mbpd this year, led by Brazil’s pre-salt, Guyana’s Stabroek block, and U.S. Permian efficiency gains. Unless Middle-East barrels exit the market, the call on OPEC crude will shrink from 28 mbpd in Q2 to 26.7 mbpd in Q4, forcing the cartel to decide between market share and price.
________________________________________
10. Historical Perspective: Geopolitical Risk Premiums Fade Fast
Event Initial Brent Jump Days to Round-Trip Barrels Lost?
2019 Abqaiq Attack +15 % 38 < 0.2 mbpd for 30 days
2020 U.S.–Iran (Soleimani) +5 % 10 None
2022 Russia-Ukraine +35 % Still elevated > 1 mbpd rerouted
Based on precedent, a 5–7 % surge without real supply disruption typically unwinds within six weeks.
________________________________________
11. Outlook Summary
• Base Case: Containment; Brent averages $70–72 through summer, melts to $65–68 Q4. Gold consolidates above $2,350; silver churns $30–34.
• Bull Case (Oil): Hormuz threatened; Brent $100+, gas prices soar, Fed forced to juggle inflation vs. growth.
• Bear Case (Oil): Cease-fire + soft demand; Brent breaks $60, OPEC+ grapples with fresh round of cuts.
•
________________________________________
12. Conclusion
The Israel-Iran flashpoint has injected a fresh geopolitical premium into oil and turbo-charged safe-haven metals, but history suggests emotion-driven rallies fade quickly when physical barrels keep flowing. Unless missiles land near Hormuz or an errant drone strikes a Saudi export terminal, the structural forces of rising non-OPEC supply and cooling demand should reassert themselves, dragging Brent back toward the mid-$60s by year-end.
For traders, that means respecting the tape today but planning for mean reversion tomorrow—selling gamma-rich call structures in crude, rolling stop-losses higher on bullion longs, and watching like hawks for any hint that shipping lanes are no longer merely a headline risk but a tangible bottleneck. Until that line is crossed, the smart money will treat each price spike not as the dawn of $100 crude, but as an opportunity to hedge, fade, and position for a calmer, cheaper barrel in the months ahead.
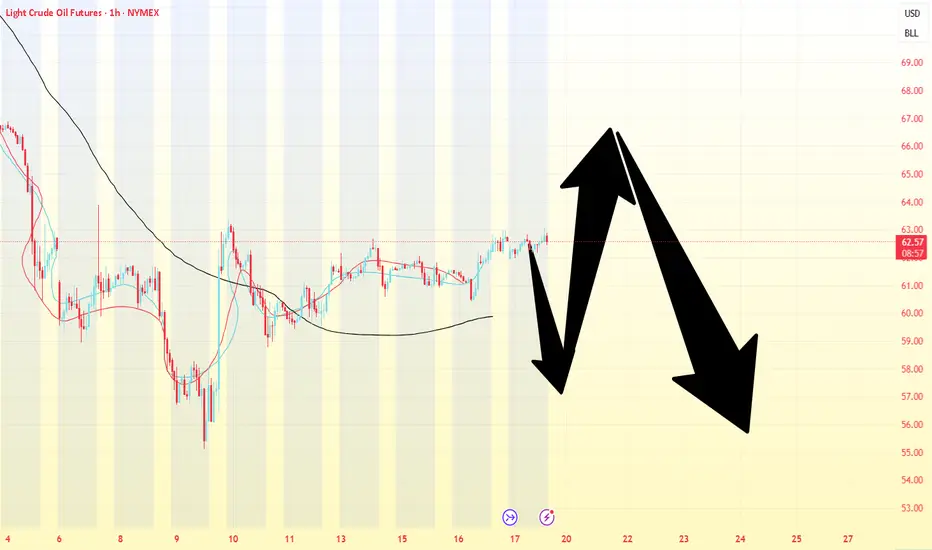
Crude oil-----Sell near 64.00, target 63.00-62.00Crude oil market analysis:
Crude oil is still bearish, and we will continue to sell on rebounds. If it does not break 65.00, it will fluctuate. The general trend is bearish. If it breaks, we will adjust our thinking. Today's crude oil is the key. Will it start to take off before the data? The previous crude oil inventory data did not allow crude oil to break the position. The crude oil fluctuation range is 60.00-65.00. If it breaks this range, we will adjust our thinking on fluctuations.
Operational suggestions
Crude oil-----Sell near 64.00, target 63.00-62.00

Oil Prices Up as Trump Delays EU Tariffs (Temporary Relief?) The global oil market, a sensitive barometer of economic health and geopolitical stability, registered a slight uptick in prices following the news that the Trump administration would extend the deadline for imposing new tariffs on a range of European Union goods. This minor rally, however, comes against a backdrop of a broader downtrend that has characterized the oil markets since mid-January. The persistent downward pressure has been largely attributed to the chilling effect of existing and threatened tariffs, not just between the US and the EU, but on a global scale, which have cast a long shadow over the outlook for global energy demand.
To understand the significance of this deadline extension and its nuanced impact on oil prices, it's crucial to first appreciate the environment in which it occurred. For several months, the dominant narrative surrounding oil has been one of demand-side anxiety. President Trump's "America First" trade policy, which has seen the imposition of sweeping tariffs on goods from various countries, most notably China, and the persistent threat of more to come against allies like the European Union, has injected a significant dose of uncertainty into the global economic system.
Tariffs, at their core, are taxes on imported goods. Their imposition typically leads to a cascade of negative economic consequences. Businesses that rely on imported components face higher input costs, which can either be absorbed, thereby reducing profit margins, or passed on to consumers in the form of higher prices. Higher consumer prices can dampen spending, a key driver of economic growth. Furthermore, the uncertainty created by an unpredictable trade policy environment often leads businesses to postpone investment decisions and hiring, further stagnating economic activity.
This economic slowdown, or even the fear of it, directly translates into weaker demand for oil. Manufacturing activity, a significant consumer of energy, tends to decline. Global shipping and freight, which rely heavily on bunker fuel and diesel, slow down as trade volumes shrink. Consumer demand for gasoline and jet fuel can also wane if economic hardship leads to reduced travel and leisure activities. The retaliatory measures often taken by targeted nations – imposing their own tariffs on US goods – only serve to exacerbate this negative feedback loop, creating a tit-for-tat escalation that further erodes business confidence and global trade flows.
It is this overarching concern about a tariff-induced global economic slowdown that has been weighing heavily on oil prices since the middle of January. Market participants, from large institutional investors to commodity traders, have been pricing in the potential for significantly reduced oil consumption in the months and years ahead if these trade disputes were to escalate or become entrenched. Every new tariff announcement or threat has typically sent ripples of concern through the market, often pushing oil prices lower.
Against this gloomy backdrop, the news of an extension to the tariff deadline on EU goods, while not a resolution, acts as a momentary pause button on further immediate escalation. It offers a temporary reprieve, a brief window where the worst-case scenario of new, damaging tariffs being instantly applied is averted. This is likely why oil prices "edged higher."
The market's reaction can be interpreted in several ways. Firstly, it reflects a slight easing of immediate downside risk to the European economy. The EU is a massive economic bloc and a significant consumer of oil. The imposition of new US tariffs on key European goods, such as automobiles or luxury products, would undoubtedly have a detrimental impact on European industries, potentially tipping already fragile economies closer to recession. An extension of the deadline pushes this immediate threat further down the road, offering a sliver of hope that a negotiated solution might yet be found, or at least that the economic pain is deferred. This deferral, however slight, can lead to a marginal upward revision of short-term oil demand expectations from the region.
Secondly, the extension can be seen as a signal, however faint, that dialogue and negotiation are still possible. In the fraught world of international trade diplomacy, any indication that parties are willing to continue talking rather than immediately resorting to punitive measures can be interpreted positively by markets. It reduces, fractionally, the "uncertainty premium" that has been built into asset prices, including oil.
However, it is crucial to temper any optimism. The fact that oil only "edged higher" rather than surged indicates the market's deep-seated caution. An extension is not a cancellation. The underlying threat of tariffs remains very much on the table. The fundamental disagreements that led to the tariff threats in the first place have not been resolved. Therefore, while the immediate pressure point has been alleviated, the chronic condition of trade uncertainty persists.
The oil market is acutely aware that this extension could simply be a tactical move, buying time for political reasons without altering the fundamental trajectory of trade policy. If, at the end of the extended period, no agreement is reached and tariffs are indeed imposed, the negative impact on oil demand expectations would likely resurface with renewed force. The market is therefore likely to adopt a "wait and see" approach, with traders hesitant to make significant bullish bets based solely on a deadline postponement.
Furthermore, the US-EU trade dynamic is just one piece of a larger global puzzle. The ongoing trade tensions with China, for instance, continue to be a major drag on global growth projections and, by extension, oil demand. Progress, or lack thereof, on that front often has a more substantial impact on oil prices than developments in the US-EU relationship, given the sheer scale of US-China trade and China's role as the world's largest oil importer.
The slight rise in oil prices also needs to be seen in the context of other market-moving factors. Supply-side dynamics, such as OPEC+ production decisions, geopolitical events in major oil-producing regions like the Middle East, and fluctuations in US shale output, constantly interact with demand-side sentiment. A deadline extension on EU tariffs might provide a small boost, but it can be easily overshadowed by a surprise inventory build, an unexpected increase in OPEC production, or signs of weakening economic data from other major economies.
In conclusion, the decision by the Trump administration to extend the tariff deadline on EU goods offered a moment of temporary relief to an oil market that has been under duress from trade war anxieties. This relief manifested as a marginal increase in oil prices, reflecting a slight reduction in immediate perceived risk to global economic activity and oil demand, particularly from Europe. However, this should not be mistaken for a fundamental shift in market sentiment or a resolution to the underlying trade disputes. The threat of tariffs remains, and the broader concerns about a global economic slowdown fueled by protectionist policies continue to loom large. The oil market's cautious reaction underscores the prevailing uncertainty, suggesting that while this extension provides a brief breathing space, the path ahead for oil prices will continue to be heavily influenced by the unpredictable currents of international trade policy.

Crude oil---sell near 61.50, target 61.00-60.00Crude oil market analysis:
Yesterday's crude oil still did not rise. After the daily line was adjusted, the buying and selling game became more obvious. Today, it rebounded and continued to sell. Syria's thawing restrictions have helped to support the continuation of crude oil selling. In addition, the ceasefire between Russia and Ukraine also suppressed crude oil. In the long run, crude oil is unlikely to rise again. Today, pay attention to the short position opportunity of 62.70.
Fundamental analysis:
Recently, there are many fundamentals, but relatively few data, which has a great impact on the market. The Sino-US trade negotiations, the Russian-Ukrainian negotiations, and the India-Pakistan ceasefire have all affected the market.
Operation suggestions:
Crude oil---sell near 61.50, target 61.00-60.00

USOIL UPDATEHello friends
Given the recent growth in oil prices, it is natural for the price to correct. Now we have obtained the most important price support areas for you and we have also specified the target. If you are willing to enter the transaction, be sure to observe capital management.
*Trade safely with us*

Oil Analysis: WTI Approaches the $60 Level AgainOver the past two trading sessions, oil has gained more than 4.5%, and is once again approaching the psychological barrier of $60 per barrel. This recent bullish movement persists despite OPEC+’s clear stance on increasing supply in June and the International Energy Agency’s (IEA) cautious outlook on global oil demand for the remainder of the year. As such, it appears that oil prices are currently benefiting from improving market sentiment, particularly as investors await the outcome of the upcoming U.S.–China trade negotiations.
Persistent Bearish Trend
Since mid-January, oil has maintained a steady downtrend, and so far, minor bullish retracements have not been strong enough to signal a meaningful reversal. Therefore, this downward technical formation remains the dominant structure to monitor in upcoming trading sessions.
RSI
The Relative Strength Index (RSI) continues to hover around the 50 level, indicating a sustained balance between bullish and bearish momentum. As long as this equilibrium remains, a neutral bias could dominate short-term price movements.
ADX
The Average Directional Index (ADX) remains close to the 40 mark, though the line has recently begun to flatten. This could be interpreted as a sign of weakening trend strength in the short term, likely due to the price currently testing a significant resistance zone.
Key Levels to Watch:
$60 – Nearby resistance: A short-term psychological level. A break above this zone could reactivate a bullish bias and potentially lead to the formation of a new short-term uptrend.
$63 – Main resistance: Aligned with the 50-period moving average. Sustained price action above this level could challenge the prevailing long-term bearish structure.
$57 – Nearby support: A zone that matches recent multi-week lows. A drop below this level could reinforce bearish momentum and provide more room for the current downtrend to extend.
Written by Julian Pineda, CFA – Market Analyst

Price OIL will continue falling ?!According to Global Channel
According to minor channel
According to Flag Pattern
According to CCI under zero
According to Breakout Support Level @ 66 USD.

Oil : April Could Be the Worst Month in Three and a Half YearsOil Prices: April Could Be the Worst Month in Three and a Half Years
As the XTI/USD chart shows:
→ at the beginning of April, WTI crude was trading above $71 per barrel;
→ this morning, on the last day of the month, the price has fallen below $60.
The overall decline may reach 16% — the worst monthly performance since November 2021.
Why Is Oil Falling?
The primary driver behind the sharp drop in oil prices earlier this month was the introduction of new US tariffs, particularly targeting China and the EU. This raised concerns that a potential global trade war could slow economic growth and, in turn, reduce global oil demand.
According to a Reuters poll, the tariffs imposed by Trump have made a global recession in 2025 a realistic risk.
In addition, growing attention is being paid to OPEC+ and its plans to increase oil production. The next meeting is scheduled for 5 May.
Technical Analysis of the XTI/USD Chart
Oil price fluctuations in 2025 have formed a descending channel (highlighted in red), with lower highs and lower lows reflecting continued bearish sentiment.
Bulls may hope for support to emerge around the $58.85 level, as:
→ this has acted as support before (as indicated by arrows);
→ this level aligns with the lower boundary of a local upward trend (shown in blue), which formed after news broke that Trump had postponed the implementation of some tariffs — triggering a sharp rebound in oil prices from the 9 April low.
Nevertheless, the broader structure remains bearish: the rise towards point C appears to be a corrective recovery following the impulse drop from A to B. Given the potential impact of upcoming news — including statements from the White House and OPEC+ decisions — a bearish breakout below the blue channel cannot be ruled out.
This article represents the opinion of the Companies operating under the FXOpen brand only. It is not to be construed as an offer, solicitation, or recommendation with respect to products and services provided by the Companies operating under the FXOpen brand, nor is it to be considered financial advice.

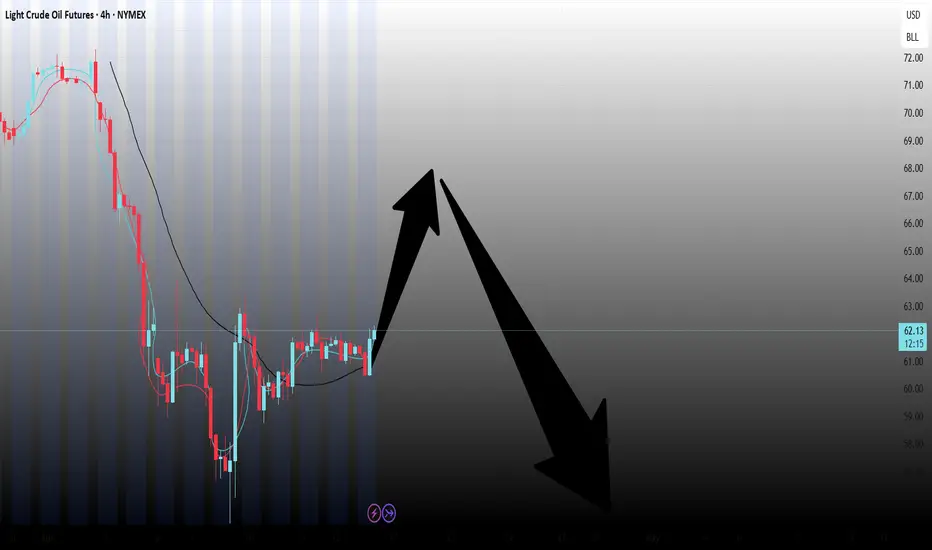
Crude oil---sell near 63.00, target 60.00-58.00Crude oil market analysis:
The recent crude oil daily line has also begun to decline. Yesterday, the daily line closed negative, and the selling began to decline. Today's idea is to consider selling opportunities near the rebound of 63.00. Crude oil continues to be bearish. No matter the fundamentals or technical aspects, there is no sign of bullishness. Today, crude oil is expected to fluctuate and fall. Don't chase the rebound. We are considering it. In addition, crude oil will also close the monthly line. Pay attention to its monthly line.
Fundamental analysis:
This week is a data week. Starting from Wednesday, big data will be released one by one. In addition, continue to pay attention to the situation of the US dollar and the changes in tariff policies.
Operation suggestions:
Crude oil---sell near 63.00, target 60.00-58.00

Crude oil------sell near 64.30, target 60.00-58.00Crude oil market analysis:
Crude oil has been fluctuating recently. Today, we focus on the rhythm and range of its fluctuations. The suppression near 65.30 is successful. The selling trend is downward. Let's sell on the rebound today. Pay attention to the suppression near 64.00. There is still room for selling. The recent data and tariff war on crude oil have not had a big impact on it, so it has been hovering.
Crude oil market analysis:
Crude oil has been fluctuating recently. Today, we focus on the rhythm and range of its fluctuations. The suppression near 65.30 is successful. The selling trend is downward. Let's sell on the rebound today. Pay attention to the suppression near 64.00. There is still room for selling. The recent data and tariff war on crude oil have not had a big impact on it, so it has been hovering.
Operational suggestions
Crude oil------sell near 64.30, target 60.00-58.00

OIL...SHORT BLACKBULL:WTI
is approaching the key resistance zone at .
I'm watching closely for a valid reaction before considering any position.
***If the level breaks and price retests it successfully, I may consider a counter-directional setup.

Crude oil---sell near 64.00, target 63.00-62.00Crude oil market analysis:
Recently, crude oil has been running up. Yesterday, the daily line had a technical retracement under the pressure of 65.00. Today, we are still bearish. Let's continue to sell when it rebounds. There is still a lot of room for crude oil to fall. Today's crude oil rebounded near 64.00 and sold. If it breaks below 60.00, it will open up a new space for a big drop. The recent data and fundamentals of crude oil are suppressing it. Buy today and expect a big rebound.
Operational suggestions:
Crude oil---sell near 64.00, target 63.00-62.00

Market Analysis: WTI Crude Oil Rebounds in TandemMarket Analysis: WTI Crude Oil Rebounds in Tandem
WTI Crude oil prices climbed higher above $60.00 and might extend gains.
Important Takeaways for WTI Crude Oil Price Analysis Today
- WTI Crude oil prices started a recovery wave above the $60.00 and $61.50 resistance levels.
- There was a break below a connecting bullish trend line with support at $63.00 on the hourly chart of XTI/USD at FXOpen.
Oil Price Technical Analysis
On the hourly chart of WTI Crude Oil at FXOpen, the price started a recovery wave from $58.40 against the US Dollar. The price gained bullish momentum after it broke the $60.00 resistance and the 50-hour simple moving average.
The bulls pushed the price above the $61.50 and $62.00 resistance levels. The recent high was formed at $64.20 and the price started a downside correction. There was a minor move below the 23.6% Fib retracement level of the upward move from the $59.87 swing low to the $64.18 high.
There was a break below a connecting bullish trend line with support at $63.00. The RSI is now below the 50 level. Immediate support on the downside is near the $62.0 zone or the 50% Fib retracement level of the upward move from the $59.87 swing low to the $64.18 high.
The next major support on the WTI crude oil chart is near the $61.50 zone, below which the price could test the $59.90 level. If there is a downside break, the price might decline toward $58.40. Any more losses may perhaps open the doors for a move toward the $56.20 support zone.
If the price climbs higher again, it could face resistance near $64.20. The next major resistance is near the $65.00 level. Any more gains might send the price toward the $68.50 level.
This article represents the opinion of the Companies operating under the FXOpen brand only. It is not to be construed as an offer, solicitation, or recommendation with respect to products and services provided by the Companies operating under the FXOpen brand, nor is it to be considered financial advice.

Crude oil---sell near 63.90, target 60.00-58.00Crude oil market analysis:
The recent crude oil has been delivered. The new contract is relatively strong at present. Yesterday's daily line closed with a positive line. In the short-term bottom shock, we are still bearish on crude oil today. We continue to sell. The large pattern suppresses around 65.30. The daily moving average suppresses around 65.700, which means that buying needs to break this position to reverse. Today's crude oil is suppressed at 63.90.
Operational suggestions:
Crude oil---sell near 63.90, target 60.00-58.00
Crude oil---sell near 62.00, target 60.00-59.00Crude oil market analysis:
The crude oil pattern shows that it is starting to hover at the bottom. Continue to sell when it rebounds. If the 65.30 position is not broken, you can stick to the bearish idea. The recent tariffs and fundamentals of crude oil make it difficult to rise, and the previously announced inventory data has also increased a lot. Crude oil rebounds to 62.00 today and can be sold. If it breaks, the next selling position is around 63.80.
Fundamental analysis:
There are not many data this week, but there are still many fundamentals. Note that the market will rest on Friday this week, which is Good Friday.
Operation suggestions:
Crude oil---sell near 62.00, target 60.00-59.00
Crude oil-----sell near 61.00, target 69.00-67.00Crude oil market analysis:
Tariffs have been increased again, and crude oil continues to fall sharply. It is difficult to change the short-term selling of crude oil. In addition, data and fundamentals all suppress it. Today's crude oil can continue to find selling opportunities. The crude oil pattern shows that the possibility of a big rebound is small. We pay attention to the suppression position of its moving average, which has dropped to around 61.80. This position is also the high point of yesterday's rebound. Today's idea will rely on this position to sell it. The first suppression of crude oil is around 59.30, and the strong pressure is 61.80.
Fundamental analysis:
The tariff war continues to affect the market, and buying and selling have begun a big game. We will pay attention to CPI later, and there will be crude oil inventory data today.
Operation suggestions:
Crude oil-----sell near 61.00, target 69.00-67.00

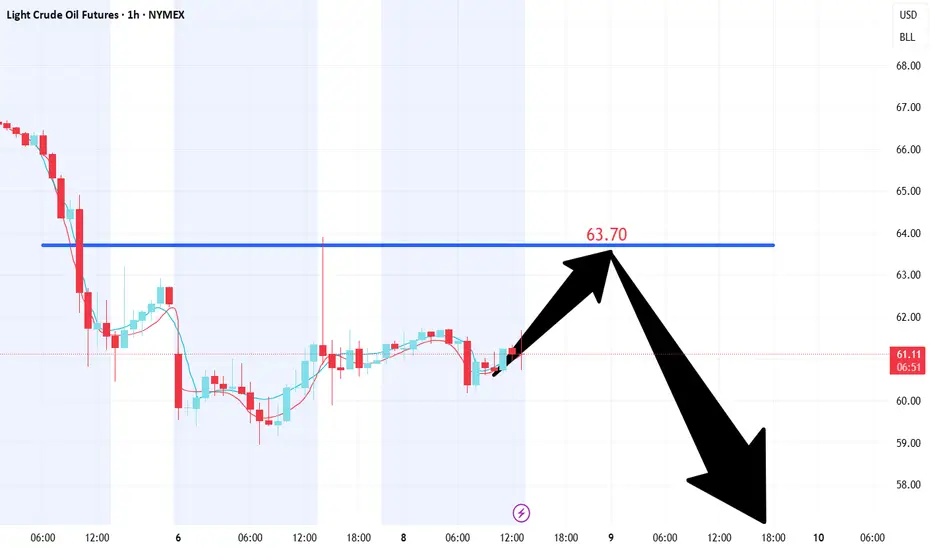
Crude oil-----sell near 63.70, target 62.00-60.00Crude oil market analysis:
We continue to be bearish on crude oil today, and continue to sell on rebounds. The position of 63.80, which was pulled up last night, is today's major suppression position. This position is a selling opportunity. Crude oil has not broken the previous low point, but it will have a big bottom shock and a big repair after the data is over. Today's crude oil will wait for the opportunity to sell. In addition, the recent data on crude oil also suppresses it. Crude oil has not effectively stood on the major pressure before, and the short-term rebound is just a rebound. The weekly trend is still bearish.
Fundamental analysis:
The US tariffs on the world are still brewing, which has also led to a sharp drop in global stock markets, and the market is not optimistic about expectations. Later this week, we will focus on the heavyweight CPI data.
Operation suggestions:
Crude oil-----sell near 63.70, target 62.00-60.00
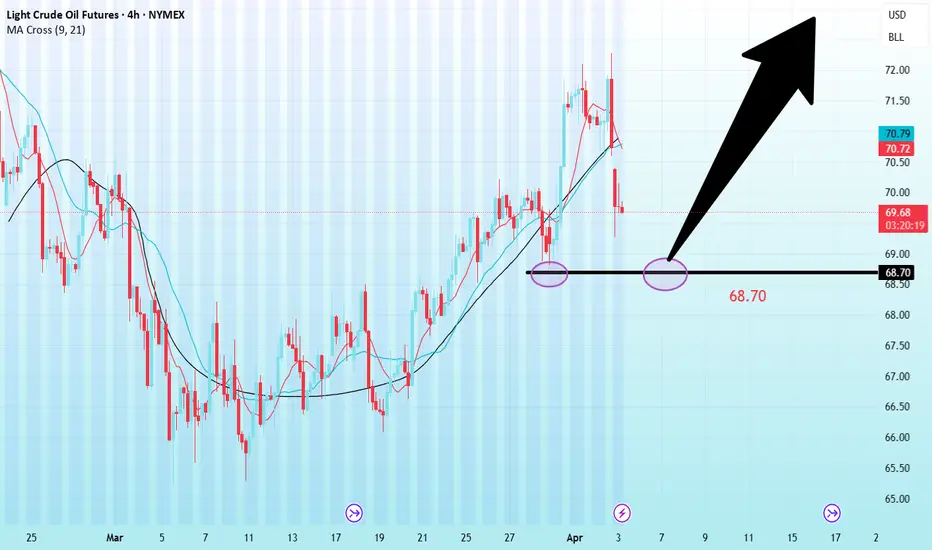
Crude oil-----buy near 68.90, target 69.90-72.00Crude oil market analysis:
Yesterday's crude oil daily line showed continuous tombstones, which was suppressed near 72.00. Today's idea is to continue to look at the rebound in the short term and pay attention to the support near 68.70. This position is a buy rebound. We will wait for opportunities in the Asian session. Crude oil has begun to move on a weekly trend. We need to pay attention to this week's closing to determine whether it will start a weekly trend in the future.
Fundamental analysis:
Trump's midnight tariffs caused the market to tremble again. In addition, ADP rose sharply, with a result of 155,000 people, 80,000 people in advance, and 115,000 people expected. The bulls still pulled up under such a big negative situation.
Operation suggestions:
Crude oil-----buy near 68.90, target 69.90-72.00
USOil Sell 70.000Crude oil has been fluctuating and rising recently, reaching a three-week high. From a fundamental perspective:
Supply: The United States has intensified its energy sanctions against Iran. Attacks on Saudi facilities have affected their performance. The OPEC+ will gradually lift the voluntary production cuts starting from April and may increase production for the second time in May. The 30-day ceasefire agreement between Russia and Ukraine has not been effectively implemented in substance. However, recently, the United States, Russia, and Ukraine have reached some consensus on Black Sea navigation and the protection of energy facilities.
Inventory: According to API data, for the week ending March 25, U.S. crude oil inventories dropped significantly by nearly 9 million barrels. However, commercial crude oil inventories have been increasing continuously for several weeks, and the overall inventory remains at a high level.
Geopolitics: The U.S. airstrikes against the Houthi armed group in Yemen and Israel's military operations in the Gaza Strip have heightened concerns about the disruption of crude oil supplies in the Middle East. The United States' continuous strengthening of sanctions against Iran and Venezuela also includes a plan to impose a 25% tariff on countries importing Venezuelan crude oil.
Production Increase Pressure: The daily supply increments of non-OPEC countries (such as the United States and Brazil) far exceed the global demand growth rate, which has long-term downward pressure on the oil price center.
💎💎💎 USOIL 💎💎💎
🎁 Sell@70.000 - 70.200
🎁 TP 68.5 68.0 67.5
The market has been extremely volatile lately. If you can't figure out the market's direction, you'll only be a cash dispenser for others. If you also want to succeed,Follow the link below to get my daily strategy updates

Crude oil ------ Buy around 68.60, target 70.00-70.60Crude oil market analysis:
Today's crude oil can be sold at short positions of 70.20-70.60, and the buying position is around 68.60. It is strong in the short term. We need to pay attention to the situation when it stands above 70.00. If the daily line stands above it, we need to pay attention to the new buying opportunities later, and the big drop will come to an end. However, the long-term trend of crude oil is still selling. In addition, with the increase in inventory data, the price of crude oil is unlikely to rise much.
Operation suggestion:
Crude oil ------ Buy around 68.60, target 70.00-70.60

OIL Today's strategyIn the medium term, because the lower edge of the channel has been broken, the short force is relatively dominant, and crude oil may face certain downward pressure.
However, today's crude oil prices are affected by tightening expectations on the supply side, geopolitics and other factors, and the short-term trend is strong, and there is a certain upward momentum on the technical side. Investors need to pay close attention to the breakout of key support and resistance levels.
OIL Today's strategy
buy@67.5-68
tp:69-69.5
We share various trading signals every day with over 90% accuracy
Fans who follow us can get high rewards every day
If you want stable income, you can contact me

Crude oil-----sell near 69.00, target 67.00-66.00Crude oil market analysis:
Recently, crude oil has been hovering at the bottom. There are short-term stabilization signals, but it is basically difficult to turn around if you don't buy at 70.00. Today's idea is still bearish. Crude oil is sold regardless of weekly or short-term. Today's idea is still to sell at a high price and bearish. Crude oil pays attention to the inventory data later.
Operational suggestions:
Crude oil-----sell near 69.00, target 67.00-66.00
