Brent bullish patternBrent has nice bullish pattern on Monthly chart. $180 is next target. Big brother please tell to OPEC something to rise oil supply in this difficult days.
Oilprice

SELL OILJust an idea and trade at your own risk.
Oil on the longer term still remains bullish on the weekly and monthly timeframes
OIL reached on the weekly timeframe the upper uptrend channel and correction may be underway back to 90-95 prior bullish continuation to new highs.

$MXC Next Target PT 55 and higherMexco Energy Corporation, an independent oil and gas company, engages in the acquisition, exploration, development, and production of natural gas, crude oil, condensate, and natural gas liquids in the United States. It owns partial interests in approximately 6,400 producing wells located in the states of Texas, New Mexico, Oklahoma, Louisiana, Alabama, Mississippi, Arkansas, Wyoming, Kansas, Colorado, Montana, Virginia, North Dakota, and Ohio. As of March 31, 2021, the company's total estimated proved reserves were approximately 1.504 million barrels of oil equivalent. It also owned leasehold mineral and royalty interests in approximately 3,169 net acres. The company was formerly known as Miller Oil Company and changed its name to Mexco Energy Corporation in April 1980. Mexco Energy Corporation was incorporated in 1972 and is based in Midland, Texas.

BRENT CRUDE OIL ANALYSIS! A nice Long!Guys just believe this trend! the fundamental is going to be powerful for this weekend! go buy! Love you all. Like share and comment please!

Oil in the fall? update (2)This analysis is purely a personal analysis
Reaching the desired price range, we will review it once again
Hints
1. This analysis is checked in the weekly time frame, so each of the waves has the necessary time to form between a few weeks to several months, and a total of one to two years.
2. For convenience, it refuses to go into details so that the trader can easily understand it.
3. The study was performed in the form of Elliott and canalization using Macd indicator
Analysis Description: Oil is on a long-term upward trajectory annually, so after the proper growth of oil prices and the failure of the downtrend, higher goals are pursued, but what is clear is that each impulse step needs a active step to rest.
So it can be said that in the next few weeks to a few months, the oil route is expected to be relatively upward to reach its $ 114 target to complete a complete cycle.
And then it enters a correction cycle that can take up to two years, so expecting to see $ 35- $ 45 as a midline target is not unexpected.
Note:
Proper insight into considering all possible scenarios then
1. Short-term visions Long-term to medium-term are well defined
We have a temporary uptrend and targets of $ 114 and $ 105 for it
Then for several months the rest of the movement shifted and, the price suffered
And then move to the channel midline for several months
At the end of this analysis is only a personal analysis and there is no certainty in doing or not doing it ......

UKOIL BRENT AND CRUDE OIL ALSO WTI OILI have done it before and took profit from every action. Creating analysis is not easy. that's why please like comment and share, please.

Crude Oil (WTI): Key Level is Reached! Update: 🛢️
My thoughts concerning WTI Crude Oil.
Price action / structure / key levels / thoughts.
❤️Please, support this video with like and comment!❤️

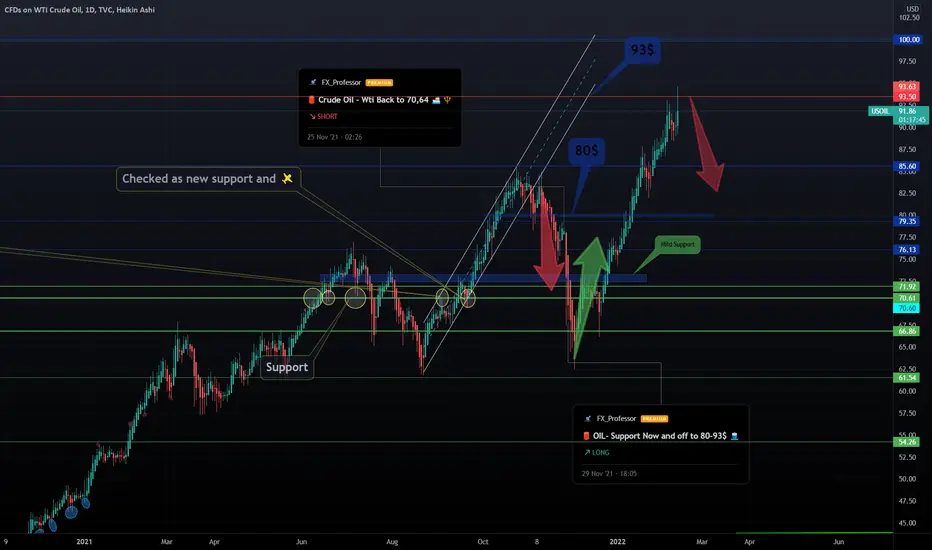
🛢️ CRUDE OIL - Time for a Correction 🍂Crude Oil, War, Inflation, Pump.... not the asset we like to see at high prices, unless off course you are Saudi, Russian or own it.
Earlier this year we had calculated the last correction and then the perfect time to buy:
At this stage we see a correction inbound. Hopefully this chart could mean that Russia and Ukraine work something out.. we doubt it but you never know.
In any case: Oil probably ready to go back down a few dollars for now.
One Love,
the FXPROFESSOR

Oil Analysis: Oil may test above $107/Barrel
The crude oil price broke the history in April 2020 and moved back to $00.barrel less than two years ago though the crude oil price is now $92 / barrel.
Due to the Corona effect, crude oil prices have been low for a long time, but crude oil prices have been rising steadily since April 2020 due to rising demand.
However, there is no doubt that crude oil has risen sharply in recent weeks due to the Russia-Ukraine issue because Russia is the largest energy supplier to Europe.
Although Russia is not a member of OPEC, it is one of the world's largest exporters of crude oil. The Middle East crisis also has been responsible for the volatile oil market for years.
Crude oil prices have plummeted due to the smuggling of special ISIS oil stealing. The US also has given economic sanctions on Iran. That's why it has forced Iran to sell crude oil at much lower prices to several countries, including China.
The international community has deliberately destabilized the oil market. The oil price is much higher now, so it was natural for oil-exporting countries to increase supply, but crude oil prices are not falling due to several geopolitical issues.
However, if this geopolitical problem is not resolved in the foreground, the price of crude oil may soon exceed $100 per barrel.
Oil price is directly involved in inflation. If the price of crude oil goes up worldwide, the price of every goods and service will go up in the developed world. Commodity prices can create hyperinflation when the purchasing power of the ordinary person goes out. In that case, it is not uncommon for the world to move towards another economic recession.
Technical Analysis:
The current crude oil price is $92 / barrel. The market has dropped a bit from last week's trendline resistance. And from the current rate, the trendline support price is $85.63 / barrel.
If next week the Russia-Ukraine issue declines or does not rise further, there is a possibility of a slight drop in crude oil price correction. But until then, crude oil prices won't drop much.
However, if the price of crude oil falls below $85/barrel for some reason, the market will first test $77.50/ barrel. And the next target is 65/62 dollars/barrel.
However, Crude prices can only drop if the geopolitical problem resolves or an announcement from OPEC increases oil extraction. Although so far, no such symptoms have been seen.
On the other hand, if the Russia-Ukraine problem escalates further, the market will test $97 / barrel again. The next target is $100 / barrel, and the last $107 / barrel is more likely to be tested this year.
However, for some reason, it is better to stay in buy mode on crude oil, especially if it is available at $75/73 / barrel. It may be better to stay in buy mode with a few pips stop loss.
.
Because as the days go by, the global crisis continues to grow, and oil prices have been low for a long time because of Covid-19. Many countries have not been able to import oil. That is why there is so much demand for crude oil right now, and the demand for crude oil will probably continue to increase throughout 2022.
You have to remember resistance level should never be a good choice for buying crude oil. When the crude price comes to a support level after correction, it would be better to stay in buy mode from the support level.

Buy OilJust an idea and trade at your own risk,
Oil is still bullish on the weekly and monthly timeframes.
Oil is still in its uptrend and after the last crucial breaks, next targets are upcoming supply zones Tp1 115 and Tp2 150.

The effect on oil prices of Russia's invasion of UkraineRussia's invasion of Ukraine will most likely disrupt crude supplies locally and globally. Russia is the world’s second-largest oil producer. Russia is the main EU supplier of crude oil. To keep it simple, since Russia is invading Ukraine, this will cause major oil supply issues for the EU. If the US and other countries in the Middle East can keep the supply tap open for the EU, then this issue will not be that much of an issue. However, Russia is a major member of OPEC. Russia holds a lot of influence in this organisation. So they could, if they wanted to, pressure other oil suppliers to not supply the EU with oil. This would only be a short-term play. Russia is heavily dependent on oil sales revenue. War is expensive. I do believe the invasion in Russia will most likely be a month max. After that, the war will be finished, but further civil wars and political instability will most likely arise in Ukraine for years to come. This effect will not be big enough, in my opinion, to drive oil prices higher. Henceforth, this oil spike will be a short-term rise.
Furthermore, there is a growing concern about the imbalance between supply and demand following the opening and normalisation of the global economy after the Omicron variant subsided. In February, JP Morgan analysts projected that disruptions to oil flow from Russia could push oil prices to $120 per barrel. Oil prices last week, for the first time since 2014, reached $100 per barrel.
If Russia is backed into a corner, I highly doubt it, they could curb oil exports to their advantage. Previously, Germany delayed the approval of the Nord Stream 2 pipeline from Russia to Europe. As a result, Russia delayed shipments of natural gas. What stops them from doing it now? If they repeat this action, but for their oil exports, this could further lead to a short-term to medium-term rise in oil prices.
The impact of oil prices on the macroeconomy in Russia is also an interesting thing to look at. If the price of oil continues to rise, according to this study (Ito, 2010). Using an unrestricted VAR (vector autoregressive) model, a 1% increase in oil prices contributes to the growth in real GDP by 0.44% in the long run. However, war is expensive, so I doubt the benefits of the increase in oil prices will outweigh the costs of this war. Furthermore, this study reports that there is clear evidence for consistent claims in other literature pieces. Oil price increases are much more important than oil price decreases (Hamilton, 2003).
In summary, now that the war has begun, I only see oil prices spiking in the first couple of weeks of the invasion and not really after that. The US and other countries will likely supply the oil needed to sustain the EU. Winter is over, and the weather is getting warmer. Oil demand will most likely decrease. The major play with crude oil futures is right now. If the war is prolonged, as Sun Tzu states, no country has ever profited from a prolonged war - the oil prices may reach 110–120 in the next six months. Especially if the supply issues are not fixed and the outcome of the war is political instability.
Technical analysis
The Commodity Channel Index is a technical indicator that, as the name suggests, was designed to be used with commodities. If you want to, you can use it for a variety of assets. But I prefer to use it with commodities. It measures the current price level relative to the average price level over a given period. When it passes +/-100, it signals overbought/oversold levels.
However, the CCI is an unbound oscillator, which means there are no upside or downside limits. So, interpreting overbought and oversold levels is subjective. Furthermore, there are two problems with this indicator. First, the indicator does not take into account fundamental events. So, a political event or supply shock will be seen as an overbought level. However, because the CCI is an unbound oscillator, it can continue to rise. Second, unlike chart patterns, indicators lag in time. So, the CCI will take time to show a decrease in price on its CCI values. This means you may be seeing an overbought signal, even after the price has decreased and the price increase is over. Regardless, right now I believe the CCI shows a great piece of analysis - that is the CCI cycle represented by the yellow line. Henceforth, I will still be using it for my analysis.
The CCI indicator data input is Length 20, Timeframe 1 Month. The pink boxes represent overbought and oversold levels with their corresponding price rectangles on the chart. As you can see from the yellow line, the price approximately follows a cycle. Over the last 16 years, the cycles have been reaching lower lows and lower highs. Currently, the rise from the last pink box is not creating a big enough spike in the overbought level in the CCI indicator, suggesting that the price can continue to rise. The CCI is represented by the yellow line, showing that the oil price is following a cycle. After the Russian invasion of Ukraine is over, you can expect the oil price to fall along with the CCI. However, I expect this to be 6 months after the invasion has concluded. This is an important cycle that the price of oil has followed for the last 16 years.
The two orange lines represent all-time highs and lows.
The two red lines represent a "box" of resistance and support. As you can see from Oct 2010 to Aug 2014, for almost 4 years, the crude oil price stayed in this region. This region will provide very important support and resistance to the oil price level if it reaches this point.
Using Fibonacci levels, we can see the oil price has been following a support and resistance pattern equal to the support and resistance of the Fibonacci levels. Right now, it has broken out of the nearest Fibonacci level that rests around $98. This will provide a level of support to the oil price. Along with that, there is another support level represented by the top blue line. Right now, in the event of stalling behaviour, I see the oil price staying between $97 – $105. The price may poke above or below during this time.
However, my confidence level in this support is not too high. The resistance and support levels given by the Fibonacci sequence, the red and blue lines, are strong. But the price range in this region seems too small. So, if the price stays here, it could only be for a couple of weeks to months. Following other price behaviour in the past.
Also, as you can see, the price touched $100 and then fell and has stayed there for the last week. The reason for this is that the $100 price level is a great level of resistance. I wouldn't be surprised if many traders used this price level as their take-profits.
In summary, the invasion of Ukraine has been going on for nearly a week now. The oil price has shot up, but not to a large degree. I'm guessing the supply chain is holding through and the markets have probably priced in this invasion, hence why the price hasn’t shot up that far as you would expect. If the price stalls, it should stay between $98 to $105. The key support and resistance levels. The price, in my opinion, may poke through the lower level if the war seems to be ending or through the top if the war creates problems for the oil market. I don’t see the price going above the bottom red line. Only if there are major supply issues with oil or geopolitical events related to oil. If the price does break the bottom line of resistance, then the price should only be there for a short time and eventually return down. Unless, of course, the geopolitical/supply issue persists, in which case the price is likely to remain above the bottom red line. After that, I expect to see the price of oil decrease and continue in its CCI (yellow line) cycle.

Update Update from my last chart, I have now moved SL to BE and will watch and ride from here. Best advise always move SL to risk free when suitable but watching not to get tapped. Rather get paid to take a trade then to hit SL. I am not a signal provider just a independent trader giving ideas.

OIL India Share Target 290OIL India Share currently trading around 220 , 230 very important resistance so if break out above 230 it will go upto 290 possible very soon

WTI BULL March (initially Bear or sideways)26/02/22
FORECAST FOR WEEK 1 MARCH 2022 = NO CLEAR CALL
COMBINED FORECAST FOR MARCH 2022 = BULL (with an initial bearish start)
DAYS
WEEK 4 OF FEB FORECAST = BEAR = INACCURATE
PROBABILITY FOR WEEK 1 MARCH = NO CLEAR CALL POSSIBLE
This week was fairly neutral, until Thursday when a significant shooting star formed. The volume towered over all previous volumes, very nervous investors due to war. Friday's volume smaller, candle formed a spinning top. Next week has a good probability of being indecisive.
OBV is very bullish.
WEEK
WEEK 4 OF FEB FORECAST = BEAR = INACCURATE
PROBABILITY FOR NEXT WEEK = BEAR or Sideways
Large shooting star, a bull with exceptional volume. Previous weeks had tails rejecting move to the south. Overall week trend looks to be stalling. OBV is trending north, with this, it may indicate a stronger momentum at play.
Based purely on the price action path of least resistance says a few more bear candles are to come. No call for a reversal at this point.
MONTH
FORECAST MONTH = BULL
Sizable bull candle body with 1.2 times tail to the north. Clear of the previous resistance level this chart is now bull led by their influence. OBV now trends BULL another confirmation of a BULL dominated influence. The chart looks to have commenced a BULL rally.
=============================
FEB WAS BULL = ACCURATE
JANUARY FORECAST FOR FEB 2022 = BULL

USOIL Update after catch 500pips from last analysisthe price can decline from 0.5 fibo direct we wait broke the simple support or access again to create lower high in 61 fibo to sell


WTI Crude Oil | Daily Downside PressureHi everyone, It appears that WTI Crude looks ripe for a rotation towards the downside, the price has double topped and showing rejection along the peak of the ascending channel, alongside an indication of further overvaluation on the daily RSI. This is not financial advice just sharing with the community what I have been looking at, have a great day!

USDOIL Crude Oil top | Retracement level targetCan i call the $92 level the 2022 top for Crude oil???
We might see a retracement in USOIL after Russia reported pullback of military troops.
Some military units will start returning to their permanent bases after completing drills near the Ukrainian border, said the Russian Defense Ministry.
Extending the Fibonacci retracement tool, my price target for crude oil this year is the $79 support.
Looking forward to read your opinion about it.

CL! Light Crude Oil FuturesHello Everyone,
I recently published the HTF version of USOIL. This is the daily chart for those who are interested in short term resistance and support areas.

OILhello dear treaders any news from oil ? ok.. let me read the chart oil. first of all lets take look at the oil chart We see that oil is rising sharply Now at what price can this price increase continue? No one knows But the traces of investors can be understood from the chart. Of course, one of the factors that has oil rising in this way is the tension between Russia and Ukraine.
In the oil chart, I see resistance from $ 100 to $ 105 even higher, but it is also possible that all of this will be broken because of the Russia-Ukraine war.
But if nothing happens and there is no war, the high resistances that you see in the chart can be activated and the price will fall.
If the price falls, it falls well because there is no demand area to keep the price because they are all consumed.
At the moment, in this political crisis, I can neither signal buying nor selling, I just have to combine all of these so that I can give you the right analysis.
Good luck.

WTI Crude Oil - USOIL - Daily Chart - War Peace Scenario!Technically speaking WTI Crude oil price may be building a top for major correction for months to come.
In case of Ukraine War flared it may be obvious for crude oil to sky rocketed.

Oil- What are Biden & Putin Trading this Weekend?Today's lesson is about NEGATIVE BALANCE PROTECTION. 🎲🎲🎲🎰
The broker always has the upper hand.. except from nights like this one.
You see, markets close on Fridays and open again on Monday. When 'Urgent Situations' arise (like today, Foreign Office tells Britons in Ukraine to leave country now ), the trader can finally have an edge!
Oil:
The drums of war and uncertainty close to Russia affect Oil and Gas. Supply can potentially become disrupted and prices can rise even higher.
Murphy's law says: These things happen on Fridays, they are usually resolved/eased during the weekend, prices could normalize with a gap on Monday.
Now let's go back to NEGATIVE BALANCE PROTECTION and how I sometime use it, at my own risk :
I am entering a SHORT position on Oil at the closing of today's market hours. Doing so with an amount I can afford to GAMBLE WITH , on Monday opening hours I will have an account either at ZERO or at potentially x2,x5 or even x10.
Negative balance protection (some brokers have it, some don't) offers the investor/trader one of the very FEW advantages against the market. That's to be utilized tonight.
One Love,
the FXPROFESSOR 🎲🎰
ps. DYOR, Risk carefully and only what you can play with,..especially if you ever try such unorthodox methods like I am tonight
ps2. Been killing it on Oil:
Up, down, Up...now down again?
Oil Long Trade Idea With LOTS of confluences. In this trade idea I have put together my analysis for a buy trade in Oil lining up 4 or 5 different supporting confluences.
