Oil short to 55I have been short oil since 63, tonight oil will re-challenge the 60 level identified on my graph and if this is broken we could see a free fall over the next few weeks. After that I am massively long
Oilprice

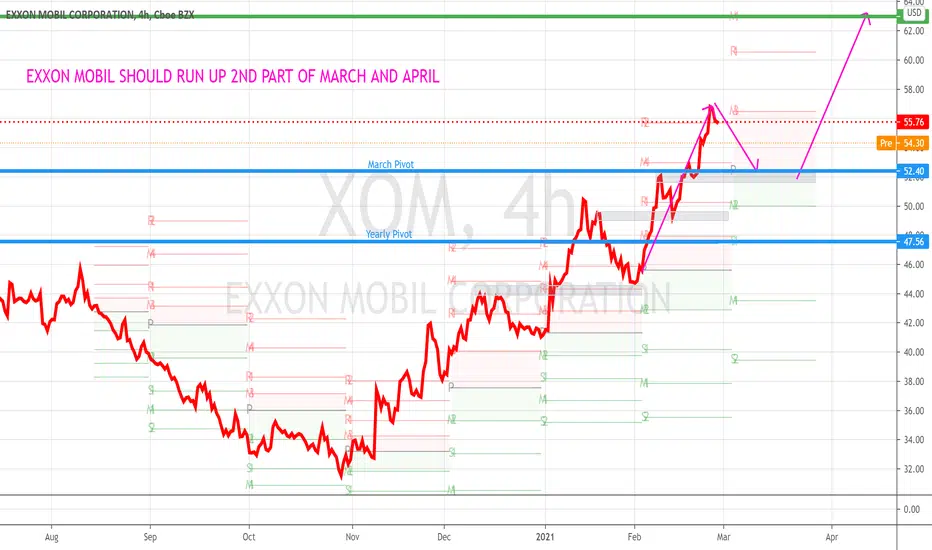
XOM Seasonal advanceOil is undervalued.
XOM is relatively strong compared to SHELL & BP.
XOM did not make a LL while SHELL & BP did.
Chevron is strongest and leading the way.
End March and April are seasonally bullish months for XOM.
The great US oil short. Target $54So finally today we touched the very long term downward trend line on the weekly charts (see below). Wow what a run up!
Now on the hourly chart we have a double extreme bearish divergence on the MACDH which usually (as its so rare occurring after long uptrends) signals a sharp reversal. We are trading inside a rising wedge here so we could try and take this all the way down to 54 for profit taking.
If this divergence breaks down and we get stopped out wow that would signal further big bullishness to come.
For the moment though I think the bear side is the best way to play this with a great entry here at 63.3
Hit the follow tag above and I'll post regular updates as always :;

💡Brent Crude Oil - Weekly technical analysis updateMidterm forecast:
54.40 is a major support, while this level is not broken, the Midterm wave will be uptrend.
Technical analysis:
While the RSI uptrend #1 is not broken, bullish wave in price would continue.
A peak is formed in daily chart at 64.83 on 02/18/2021, so more losses to support(s) 58.65 and minimum to Major Support (54.40) is expected.
Price is above WEMA21, if price drops more, this line can act as dynamic support against more losses.
Relative strength index (RSI) is 66.
❤️ If you find this helpful and want more FREE forecasts in TradingView
. . . . . Please show your support back,
. . . . . . . . Hit the 👍 LIKE button,
. . . . . . . . . . Drop some feedback below in the comment!
❤️ Your Support is very much 🙏 appreciated! ❤️
💎 Want us to help you become a better Forex trader ?
Now, It's your turn !
Be sure to leave a comment let us know how you see this opportunity and forecast.
Trade well, ❤️
ForecastCity English Support Team ❤️


SCO RSI indicator oversold - Strong buyAccording to the indicator RSI, SCO is oversold and ready to rebound to at least $35 with a peak of $60.
We think that the current oil price is overdue and ready for a retracement.
"World’s largest oil exporter plans to reverse recent unilateral production cut, signaling confidence in recovery"
www.wsj.com

Short Oil - Major resistance level - EV's will kill Oil businessOil is about to drop, big! Weekly RSI showing major resistance at $61 - 62.
Electric vehicles will kill global oil industry by 2030.
Big Oil Is Getting Scared Of Electric Vehicles – And So It Should Be
"EVs are going to have the same disruptive consequences. Over a million EVs were sold in Europe in 2020, are projected to hit 585,375 in 2021 in the US, and sales are strong in China too. Companies and individuals with a lot invested in the traditional fossil fuel industries are now starting to react in typical fashion, by attempting to discredit what they perceive as a threat."
www.forbes.com

💡WTI . Weekly Technical Analysis UpdateMidterm forecast:
51.60 is a major support, while this level is not broken, the Midterm wave will be uptrend.
Technical analysis:
While the RSI uptrend #1 is not broken, bullish wave in price would continue.
A trough is formed in daily chart at 51.60 on 02/01/2021, so more gains to resistance(s) 63.10, 66.50, 72.55 and more heights is expected.
Price is above WEMA21, if price drops more, this line can act as dynamic support against more losses.
Relative strength index (RSI) is 79.
❤️ If you find this helpful and want more FREE forecasts in TradingView
. . . . . Please show your support back,
. . . . . . . . Hit the 👍 LIKE button,
. . . . . . . . . . Drop some feedback below in the comment!
❤️ Your Support is very much 🙏 appreciated! ❤️
💎 Want us to help you become a better Forex trader ?
Now, It's your turn !
Be sure to leave a comment let us know how you see this opportunity and forecast.
Trade well, ❤️
ForecastCity English Support Team ❤️

Oil next down movementHi everyone,
As i mentioned in the past, oil rallied as expected to the target mentioned 50-58, now it will be time to sell it down to 30 usd
Good luck


Oil, End of a 12 years long correction? From an Elliott wave perspective the previous 12 years in oil prices shows a clear ABC shape correction pattern that ended last year.

WTI & BRENT Bullish Viewdue to market conditions , oil prices pulled back sharply . still chance for a strong rebound after us-elections.

💡Brent Crude Oil - Weekly technical analysis updateMidterm forecast:
54.40 is a major support, while this level is not broken, the Midterm wave will be uptrend.
Technical analysis:
While the RSI uptrend #1 is not broken, bullish wave in price would continue.
A trough is formed in daily chart at 54.40 on 02/01/2021, so more gains to resistance(s) 62.30, 66.05, 70.35 and more heights is expected.
Price is above WEMA21, if price drops more, this line can act as dynamic support against more losses.
Relative strength index (RSI) is 73.
❤️ If you find this helpful and want more FREE forecasts in TradingView
. . . . . Please show your support back,
. . . . . . . . Hit the 👍 LIKE button,
. . . . . . . . . . Drop some feedback below in the comment!
❤️ Your Support is very much 🙏 appreciated! ❤️
💎 Want us to help you become a better Forex trader ?
Now, It's your turn !
Be sure to leave a comment let us know how you see this opportunity and forecast.
Trade well, ❤️
ForecastCity English Support Team ❤️

go short US oil to possible $54Here we can see a nice hourly divergence on US Oil 1 hr charts. Higher prices, bearish indictors so price should move a little lower.
Trading inside a rising wedge as well, a reversal pattern, major support at the green line. Look for the wedge to break to take profits after the break.
We can also see price is in optimum short zone as well above the falling daily trend line and at the top of another rising wedge
Stop loss at $57.30. Not everything works, but most things I post do. Here is another low risk high reward set up you might like to take.
Follow me on trading view for regular updates to this trade.

LONG HALLIBURTON CO (HAL) - Extremely Undervalued StockNYSE:HAL - An undervalued Stock In My Opinion - huge upside potential - BUY at $13 - $14 - finding a buy for you will guarantee the best profitable position.
www.nasdaq.com
www.modernreaders.com
www.rigzone.com
seekingalpha.com
www.houstonchronicle.com
NYSE:HAL is one of the world's largest providers of products and services to the energy industry.
helps its customers maximise value throughout the life cycle of the reservoir from locating hydrocarbons and managing geological data, to drilling and formation evaluation, well construction and completion, and optimising production throughout the life of the asset.
NYSE:HAL Company is an American multinational corporation. One of the world's largest oil field service companies, it has operations in more than 70 countries. It owns hundreds of subsidiaries, affiliates, branches, brands, and divisions worldwide and employs approximately 55,000 people.
Traded as: NYSE: HAL, S&P 500 component
Industry: Oilfield services & equipment
NYSE:HAL


ridethepig | Oil for the Yearly Close📌 Oil for the Yearly Close
Making the rounds...this time onto Oil and we are going to learn from it by firstly tracking our previous 'before' and 'after' the 2020 fact charts to see how the birth took place. A single glance at the Monthly and Daily is sufficient, from mapping our MT and LT charts, our ancestors, we are able to workout the directional flows in the short-term.
This point of view, the crux of which can be proven ultimately by understanding which side occupies the useful pivot. In short, the 63/64 levels which we were essentially tracking as our outpost is the same strong resistance that we are heading back too from the possible thrust.
The strong resistance
The strength of this slingshot up lies in the fat that supply shortages are coming into play across the commodity side, OPEC will remain at the mercy to the problematic lockdowns which will continue into 2021 and most likely beyond. This is not an easy one to trade if you are not already holding longs, the test of 51 and 65 look guaranteed as only a matter of time. I would like to anticipate another test of 🔑 support at 33.7x (low chances right now) which would be an appropriate level to once again add longs in cheaper levels should we see it.
Thanks as usual for keeping the feed back coming 👍 or 👎

US OIL BULLISHUS oil seems to have a complete monthly correction, CRUDE oil will most likely trade at higher prices in the next coming months.
