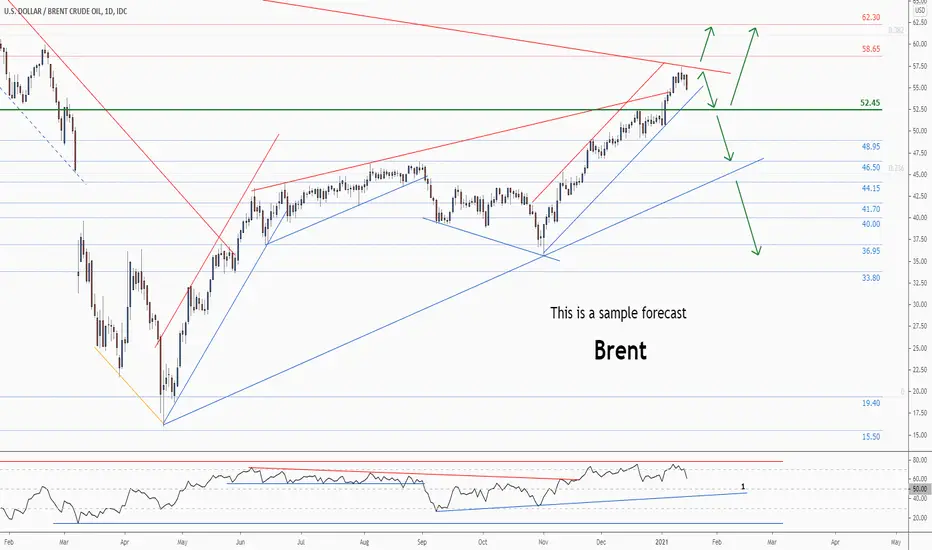
💡Brent Crude Oil - Weekly technical analysis updateMidterm forecast:
52.45 is a major support, while this level is not broken, the Midterm wave will be uptrend.
Technical analysis:
While the RSI uptrend #1 is not broken, bullish wave in price would continue.
A peak is formed in daily chart at 57.25 on 01/13/2021, so more losses minimum to Major Support (52.45) is expected.
Price is above WEMA21, if price drops more, this line can act as dynamic support against more losses.
Relative strength index (RSI) is 61.
❤️ If you find this helpful and want more FREE forecasts in TradingView
. . . . . Please show your support back,
. . . . . . . . Hit the 👍 LIKE button,
. . . . . . . . . . Drop some feedback below in the comment!
❤️ Your Support is very much 🙏 appreciated! ❤️
💎 Want us to help you become a better Forex trader ?
Now, It's your turn !
Be sure to leave a comment let us know how you see this opportunity and forecast.
Trade well, ❤️
ForecastCity English Support Team ❤️
Oilprice
💡Brent Crude Oil - Weekly technical analysis updateMidterm forecast:
52.45 is a major support, while this level is not broken, the Midterm wave will be uptrend.
Technical analysis:
While the RSI uptrend #1 is not broken, bullish wave in price would continue.
A peak is formed in daily chart at 57.25 on 01/13/2021, so more losses minimum to Major Support (52.45) is expected.
Price is above WEMA21, if price drops more, this line can act as dynamic support against more losses.
Relative strength index (RSI) is 61.
❤️ If you find this helpful and want more FREE forecasts in TradingView
. . . . . Please show your support back,
. . . . . . . . Hit the 👍 LIKE button,
. . . . . . . . . . Drop some feedback below in the comment!
❤️ Your Support is very much 🙏 appreciated! ❤️
💎 Want us to help you become a better Forex trader ?
Now, It's your turn !
Be sure to leave a comment let us know how you see this opportunity and forecast.
Trade well, ❤️
ForecastCity English Support Team ❤️

Oil Time For Reversal - Short TradeOil Short Trade
Entry: $53.76
TP & RR: $52.41
Stop Loss: $54.51
REASONS FOR THE TRADE
So far Oil has respected the channel and I believe that it is now reaching a point of exhaustion. This upper trendline from the channel is also in confluence with a fairly strong resistance level, so I believe a small pullback is due.
The Stop Loss is well above the channel and similarly to the trade from a few days ago, if the price starts pushing up we will close the position because a spike up should follow.


Oil Ascending Channel - Long OrderOil Ascending Channel Long Position
Entry: $51.69
TP & RR: $52.87 (1.59)
Stop Loss: $50.95
REASONS FOR THE TRADE
After breaking up at the ascending triangle, Oil has now formed an ascending triangle, testing the lower trendline. If it holds I believe that it will make a higher high and potentially trying to test the upper trendline or at the very least do a double top.
My Stop Loss is very conservative here because there may be a fakeout and I don't want to get stopped out (my USDJPY trade is still haunting me I guess). As I am writing this I can see that the price is already going up, so I hope a small pullback will give me the entry I want, after which I will start trailing my SL.


💡Brent Crude Oil - Weekly technical analysis updateMidterm forecast:
52.45 is a major support, while this level is not broken, the Midterm wave will be uptrend.
Technical analysis:
While the RSI uptrend #1 is not broken, bullish wave in price would continue.
A trough is formed in daily chart at 50.55 on 12/23/2020, so more gains to resistance(s) 58.65, 62.30, 66.05 and more heights is expected.
Price is above WEMA21, if price drops more, this line can act as dynamic support against more losses.
Relative strength index (RSI) is 76.
❤️ If you find this helpful and want more FREE forecasts in TradingView
. . . . . Please show your support back,
. . . . . . . . Hit the 👍 LIKE button,
. . . . . . . . . . Drop some feedback below in the comment!
❤️ Your Support is very much 🙏 appreciated! ❤️
💎 Want us to help you become a better Forex trader ?
Now, It's your turn !
Be sure to leave a comment let us know how you see this opportunity and forecast.
Trade well, ❤️
ForecastCity English Support Team ❤️
"Exporting Democracy!" = OIL WARThe #Gulf_War (2 August 1990 – 28 February 1991), President George W. #Bush has given new meaning to "exporting democracy"! by BOMBING #Kuwait and #Iraq (#Saddam). One of the main results was the drop-down of Crude Oil Price until February 1999!


USOIL Ascending Triangle - Long PositionUSOIL Long Order
Entry: $51.04
TP & RR: $52.49 (2.54)
Stop Loss: $50.47
USOIL Short Order
Entry: $51.50
TP & RR: $50.01 (4.14)
Stop Loss: $51.86
REASONS FOR THE TRADE
As you can see I have mapped two potential trades here, but since the first one is Long, that's the center of the analysis here.
What we see is an ascending triangle in an uptrend, so I expect Oil to have an explosive move up (no pun intended). With that being said, I also think that this trend is starting to get a bit exhausted, so if the price breaks down from the lower trendline I will be looking to open a short position. Alternatively, if it reaches the upper trendline I will hedge my long with a short to protect my profits and look for a suitable place to close the losing trade.


CFDS ON CRUDE OIL (WTI)🌻🌞 technical analysis 🌻🌞 uk.tradingview.com
Support ♠︎ ♣︎ ♥︎ ♦︎
S1 ➔ ➜ ➙ ➛ ➝ ➞ 35.95
S2 ➔ ➜ ➙ ➛ ➝ ➞ 34.38
S3 ➔ ➜ ➙ ➛ ➝ ➞ 30.73
Resistance ♠︎ ♣︎ ♥︎ ♦︎
R1➔ ➜ ➙ ➛ ➝ ➞ 49.92
R2➔ ➜ ➙ ➛ ➝ ➞ 65.62
R3 ➔ ➜ ➙ ➛ ➝ ➞ 66.58
PIVOT POINTS🔏 🔐 🔒
p🟥 🟧 🟨48.2
S3🟥 🟧 🟨42.91
S2🟥 🟧 🟨45.56
S11940.31
R1🟥 🟧 🟨49.14
R2🟥 🟧 🟨50.84
R3🟥 🟧 🟨53.49
DAILY CHANGE IN🕚 🕛 🕜
LONGS 💎💎💎
-30%
SHORTS🩸🩸🩸
61%
WEEKLY CHANGE IN🕚 🕛 🕜
LONGS💎💎💎
-27%
SHORTS🩸🩸🩸
42%
⛱ 🏖 🏝 please if you have any question about any chart just test me I will answer back to you as soon as I can we can share our ideas together 🚥 🚏 🗺

Oil- Time to go shortJust listening to my chart here and also thinking about lockdowns and their impact on crude oil consumption
I use 4 take profit levels. When first take profit is taken I simply move the stop loss to zero (entry) and wait to take another 3 take profits lower, if possible.

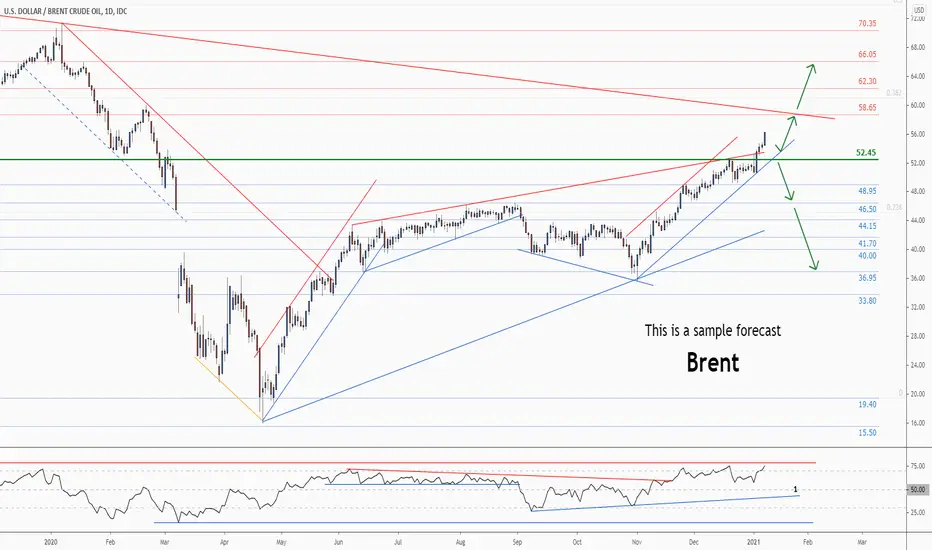
💡Brent Crude Oil - Weekly technical analysis updateMidterm forecast:
46.50 is a major support, while this level is not broken, the Midterm wave will be uptrend.
Technical analysis:
While the RSI uptrend #1 is not broken, bullish wave in price would continue.
A peak is formed in daily chart at 52.38 on 12/18/2020, so more losses to support(s) 48.95 and minimum to Major Support (46.50) is expected.
Price is above WEMA21, if price drops more, this line can act as dynamic support against more losses.
Relative strength index (RSI) is 64.
❤️ If you find this helpful and want more FREE forecasts in TradingView
. . . . . Please show your support back,
. . . . . . . . Hit the 👍 LIKE button,
. . . . . . . . . . Drop some feedback below in the comment!
❤️ Your Support is very much 🙏 appreciated! ❤️
💎 Want us to help you become a better Forex trader ?
Now, It's your turn !
Be sure to leave a comment let us know how you see this opportunity and forecast.
Trade well, ❤️
ForecastCity English Support Team ❤️


💡WTI . Weekly Technical Analysis UpdateMidterm forecast:
43.75 is a major support, while this level is not broken, the Midterm wave will be uptrend.
Technical analysis:
While the RSI uptrend #1 is not broken, bullish wave in price would continue.
A trough is formed in daily chart at 40.20 on 11/13/2020, so more gains to resistance(s) 50.70, 54.75, 57.80 and more heights is expected.
Price is above WEMA21, if price drops more, this line can act as dynamic support against more losses.
Relative strength index (RSI) is 74.
❤️ If you find this helpful and want more FREE forecasts in TradingView
. . . . . Please show your support back,
. . . . . . . . Hit the 👍 LIKE button,
. . . . . . . . . . Drop some feedback below in the comment!
❤️ Your Support is very much 🙏 appreciated! ❤️
💎 Want us to help you become a better Forex trader ?
Now, It's your turn !
Be sure to leave a comment let us know how you see this opportunity and forecast.
Trade well, ❤️
ForecastCity English Support Team ❤️

OIL WTI Targets $50 Next? Watch Video!Where is OIL WTI headed next?
Our previous tradingview analysis on OIL has offered us and our followers a highly profitable low risk swing trade. Watch the video to learn more about the next trade we will be taking in this market.
If you'd like to learn a trading approach with edge that will help you be consistently profitable, make sure you give us a 'like' and 'follow' so you don't miss any upcoming analysis.


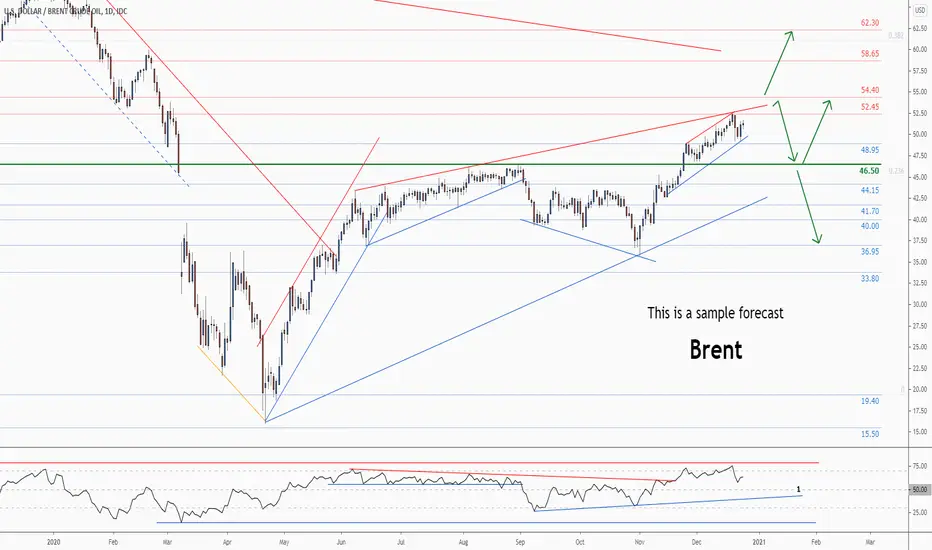
💡Brent Crude Oil - Weekly technical analysis updateMidterm forecast:
46.50 is a major support, while this level is not broken, the Midterm wave will be uptrend.
Technical analysis:
While the RSI uptrend #1 is not broken, bullish wave in price would continue.
A trough is formed in daily chart at 42.70 on 11/13/2020, so more gains to resistance(s) 54.40, 58.65, 62.30 and more heights is expected.
Price is above WEMA21, if price drops more, this line can act as dynamic support against more losses.
Relative strength index (RSI) is 68.
❤️ If you find this helpful and want more FREE forecasts in TradingView
. . . . . Please show your support back,
. . . . . . . . Hit the 👍 LIKE button,
. . . . . . . . . . Drop some feedback below in the comment!
❤️ Your Support is very much 🙏 appreciated! ❤️
💎 Want us to help you become a better Forex trader ?
Now, It's your turn !
Be sure to leave a comment let us know how you see this opportunity and forecast.
Trade well, ❤️
ForecastCity English Support Team ❤️
