Brent Crude Oil - Weekly technical analysis updateMidterm forecast:
While the price is below the resistance 46.50, beginning of downtrend is expected.
We make sure when the support at 36.95 breaks.
If the resistance at 46.50 is broken, the short-term forecast -beginning of downtrend- will be invalid.
Technical analysis:
While the RSI downtrend #1 is not broken, bearish wave in price would continue.
A peak is formed in daily chart at 45.44 on 11/11/2020, so more losses to support(s) 41.70, 40.00 and minimum to Major Support (36.95) is expected.
Price is above WEMA21, if price drops more, this line can act as dynamic support against more losses.
Relative strength index (RSI) is 54.
❤️ If you find this helpful and want more FREE forecasts in TradingView
. . . . . Please show your support back,
. . . . . . . . Hit the 👍 LIKE button,
. . . . . . . . . . Drop some feedback below in the comment!
❤️ Your Support is very much 🙏 appreciated! ❤️
💎 Want us to help you become a better Forex trader ?
Now, It's your turn !
Be sure to leave a comment let us know how you see this opportunity and forecast.
Trade well, ❤️
ForecastCity English Support Team ❤️
Oilprice

Brent Crude Oil - Weekly technical analysis updateMidterm forecast:
While the price is below the resistance 46.50, beginning of downtrend is expected.
We make sure when the support at 36.95 breaks.
If the resistance at 46.50 is broken, the short-term forecast -beginning of downtrend- will be invalid.
Technical analysis:
While the RSI downtrend #1 is not broken, bearish wave in price would continue.
A peak is formed in daily chart at 45.44 on 11/11/2020, so more losses to support(s) 41.70, 40.00 and minimum to Major Support (36.95) is expected.
Price is above WEMA21, if price drops more, this line can act as dynamic support against more losses.
Relative strength index (RSI) is 54.
❤️ If you find this helpful and want more FREE forecasts in TradingView
. . . . . Please show your support back,
. . . . . . . . Hit the 👍 LIKE button,
. . . . . . . . . . Drop some feedback below in the comment!
❤️ Your Support is very much 🙏 appreciated! ❤️
💎 Want us to help you become a better Forex trader ?
Now, It's your turn !
Be sure to leave a comment let us know how you see this opportunity and forecast.
Trade well, ❤️
ForecastCity English Support Team ❤️

OIL- We called the drop nicely TP levels on chartSo we called the drop nicely, now let's take a look at our targeted take-profit levels


WTI . Weekly Technical Analysis UpdateMidterm forecast:
39.70 is a major resistance, while this level is not broken, the Midterm wave will be downtrend.
We will close our open trades, if the Midterm level 39.70 is broken.
Technical analysis:
While the RSI downtrend #1 is not broken, bearish wave in price would continue.
A peak is formed in daily chart at 39.50 on 11/05/2020, so more losses to support(s) 36.30, 34.60, 30.85 and more depths is expected.
Price is below WEMA21, if price rises more, this line can act as dynamic resistance against more gains.
Relative strength index (RSI) is 44.
❤️ If you find this helpful and want more FREE forecasts in TradingView
. . . . . Please show your support back,
. . . . . . . . Hit the 👍 LIKE button,
. . . . . . . . . . Drop some feedback below in the comment!
❤️ Your Support is very much 🙏 appreciated! ❤️
💎 Want us to help you become a better Forex trader ?
Now, It's your turn !
Be sure to leave a comment let us know how you see this opportunity and forecast.
Trade well, ❤️
ForecastCity English Support Team ❤️

CFDS ON CRUDE OIL(WTI) Daily Chart - SHORTAs shown in the chart Crude Short
to Medium Term the trend is lower.
Only sustain trading above $45
negate the downtrend.

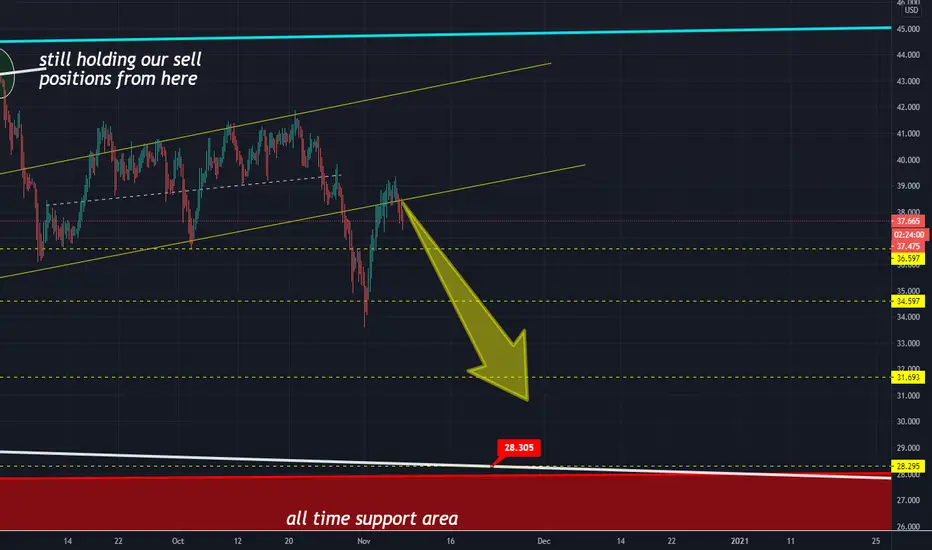
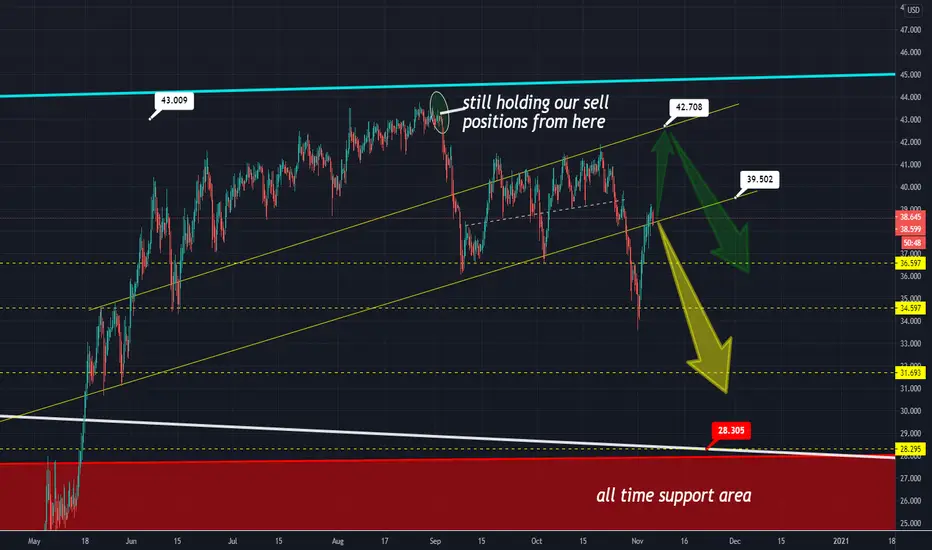
OIL Updated - We keep on SellingFurther to yesterday's idea, price has dropped at resistance and dropping :
Already in profits and managing our positions accordingly. Closing our 3 Buy positions and also closing 3 of our sell positions.
4 sell positions in profits and remaining open. 1 is cashed out so profit guaranteed, 3 open with take profit levels at 36.60, 34,60 and 31,70.
VICTORY
yesterday:
Our technical analysis on Oil with the major key price levels.
Fundamentally and technically we see a drop , sooner or later, below 30 usd
At this stage there is a 60% drop , or a 40% rise to 42.50 resistance and a possible drop from there at 90% (10% only to break that level)
HOW WE TRADE THIS:
We have SELL and BUY positions at a rate of 7 (buy) to 3 (sell) (70%-30%)
If the price drops then we have a profit from 40% of the positions
If the price rises we will close all BUY positions at the major resistance of 42.5usd and hold our SELL positions for a drop back to where the price is now and the key take profit levels of 36.60, 34.60 , 31.70 and even the all time support of 30$ and 28.50$.
If all goes well we will consider Buying again at that level.
Take a look at how we perfectly sold in September s idea predicting perfectly the beginning of the drop ,
our tutorial on Oil analysis
OIL - Our strategy of mixing BUY and SELL positionsOur technical analysis on Oil with the major key price levels.
Fundamentally and technically we see a drop, sooner or later, below 30 usd
At this stage there is a 60% drop, or a 40% rise to 42.50 resistance and a possible drop from there at 90% (10% only to break that level)
HOW WE TRADE THIS:
We have SELL and BUY positions at a rate of 7 (buy) to 3 (sell) (70%-30%)
If the price drops then we have a profit from 40% of the positions
If the price rises we will close all BUY positions at the major resistance of 42.5usd and hold our SELL positions for a drop back to where the price is now and the key take profit levels of 36.60, 34.60 , 31.70 and even the all time support of 30$ and 28.50$.
If all goes well we will consider Buying again at that level.
Take a look at how we perfectly sold in September s idea predicitng perfectly the beginning of the drop,
our tutorial on Oil analysis
OIL_SELL_TP_30.60_18.81%_7.09pips_SL_39.51_4.83%_1.82pipsOIL_SELL_TP_30.60_18.81%_7.09pips_SL_39.51_4.83%_1.82pips


Our success on oil - and what's nexton Sep 2 we poted this idea :
Oil about to drop back to 30 usd
Well.. we are almost there. I guess we were right

Brent Crude Oil - Weekly technical analysis updateMidterm forecast:
41.70 is a major resistance, while this level is not broken, the Midterm wave will be downtrend.
We will close our open trades, if the Midterm level 41.70 is broken.
Technical analysis:
The RSI bounced from the resistance #1 at 55 and it prevented price from more gains.
A peak is formed in daily chart at 43.65 on 10/15/2020, so more losses to support(s) 36.95, 33.80, 19.40 and more depths is expected.
Price is below WEMA21, if price rises more, this line can act as dynamic resistance against more gains.
Relative strength index (RSI) is 32.
❤️ If you find this helpful and want more FREE forecasts in TradingView
. . . . . Please show your support back,
. . . . . . . . Hit the 👍 LIKE button,
. . . . . . . . . . Drop some feedback below in the comment!
❤️ Your Support is very much 🙏 appreciated! ❤️
💎 Want us to help you become a better Forex trader ?
Now, It's your turn !
Be sure to leave a comment let us know how you see this opportunity and forecast.
Trade well, ❤️
ForecastCity English Support Team ❤️

Oil price this week – how to trade?Oil price down and continue into down direction.
The Oil price follows our expectation into down direction. The lockdown in Europe is the major factor for the falling oil price. World-Signals in the forecast from October 26th predicted this scenario with target of oil price (US Oil) at $34-$35. If you are following our free forecasts hold this short position during the coming week because the first target of $34-$35 is almost reached and the price may continue down lower to levels of $32.
The other key news that will move the oil price is U.S. Election of course. If Biden takes the vote the oil price may continue down even below $30. Biden strategy is to stop the economy to prevent the population from the corona virus.

Repeated hammer for WTI OILCrude oil has been taking a beating the last few weeks. Lockdown crawling over Europe as Covid cases are increasing. Demand for Oil dropping. London into lockdown starting next week, low demand for oil still, lower prices expected.
We are noting a steady decline in oil, still hunting for the previous low target of 32.8
could be rocky with elections just round the corner so expected a volatile market for a couple of weeks.
Bias Oil Short
Read between the lines. Let the maths do the work for you. Observation is a key, patience is a virtue.

CLH2021: A Potential Swing Higher This analysis makes use of the Gann Box tool; however, only certain lines are highlighted. The bars pattern is mirrored to show the potential for symmetry here; a beautiful tendency of markets and nature in general. Looking for higher targets from here.

Early shorters are out, market could start dipping from now.Traders shorted $41.4 (Obvious Resistance), their SL's was approx. 30-40pips above. Market has cleared the SL's and early shorters are out now.
Im expecting $OIL to start dipping down and test $39.20 region. If breaks down, could continue falling to $36.80 area.
Please hit that like button if you agree with my analysis.

Oil prices down slowly due to corona virus crisis in EuropeThe financial markets do not calculate the markets in Europe. Almost all countries in the Euro Zone ban many actions due to the corona virus. At the same time the oil prices remain at the same level. The reason is that the locomotive of the world industry is South-East Asia. The situation in this part of the world with the corona virus is normal and the economy is in power.
The oil price (USOil) down from $40 to $38.40 today after the starting crisis couple of days earlier.
We expects to see not so big down movement to level of $34-$35 if the situation in China and rest countries in South-East Asia is under control.
As overall the crisis with corona virus in Europe will remain very difficult with new restrictions. The situation may change after U.S. Election after 10-days.
The trading strategy in trading with oil is to open short positions and avoid new position during the U.S. Election day.

WTI . Weekly Technical Analysis UpdateMidterm forecast:
While the price is below the resistance 43.75, beginning of downtrend is expected.
We make sure when the support at 36.30 breaks.
If the resistance at 43.75 is broken, the short-term forecast -beginning of downtrend- will be invalid.
Technical analysis:
The RSI bounced from the downtrend #1 and it prevented price from more gains.
A peak is formed in daily chart at 41.94 on 10/19/2020, so more losses to support(s) 39.70, 38.15 and minimum to Major Support (36.30) is expected.
Price is below WEMA21, if price rises more, this line can act as dynamic resistance against more gains.
Relative strength index (RSI) is 47.
❤️ If you find this helpful and want more FREE forecasts in TradingView
. . . . . Please show your support back,
. . . . . . . . Hit the 👍 LIKE button,
. . . . . . . . . . Drop some feedback below in the comment!
❤️ Your Support is very much 🙏 appreciated! ❤️
💎 Want us to help you become a better Forex trader ?
Now, It's your turn !
Be sure to leave a comment let us know how you see this opportunity and forecast.
Trade well, ❤️
ForecastCity English Support Team ❤️
