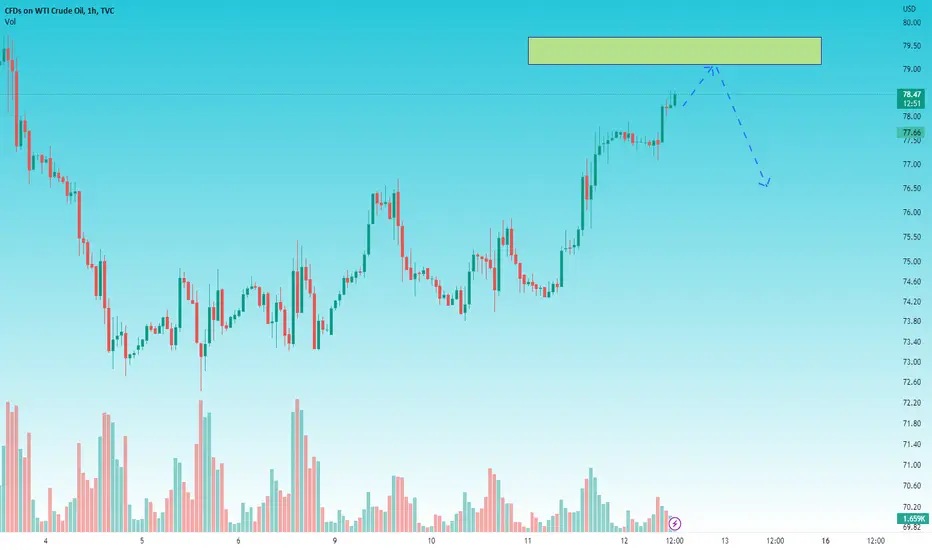
USOIL - CRUDE OIL BULLISH REVERSAL EXPECTED MOVEoil is about to retrace back to 76-78 zone be realistic and never enter before confirmation in LTF
I am not your investment advisor, enter at your own!
Oilsignals

oil BrentWe are witnessing a correction in a channelized range that completed the -0.5 shark pattern in this range and we are exactly on the expected correction area of the above pattern, we are in the 50% Fibo area at 75.65 with a little flexibility in the above pattern at the intersection with the midline of the channel along with Two pivot point ranges at the prices of 64.15 and 71.28 can be expected to support the upward movement that can determine the role of the above reduction in dealing with the ceiling.

Oil buyPeace be upon you, there is a high probability of oil rising with the formation of the descending channel. Now he is correcting the golden ratio of Fibonacci 61%. We have two very positive candles in the four-hour time frame

Oil buyPeace be upon you. How are you? There is a high probability of oil rising with the formation of the ascending channel and the re-testing of the trand. What do you think my friends

WTI analysisOil buyers are strong and due to hitting the ceiling of the channel, we don't see a heavy drop and it is a sign for more growth
As long as it is above the box, it is an upward trend

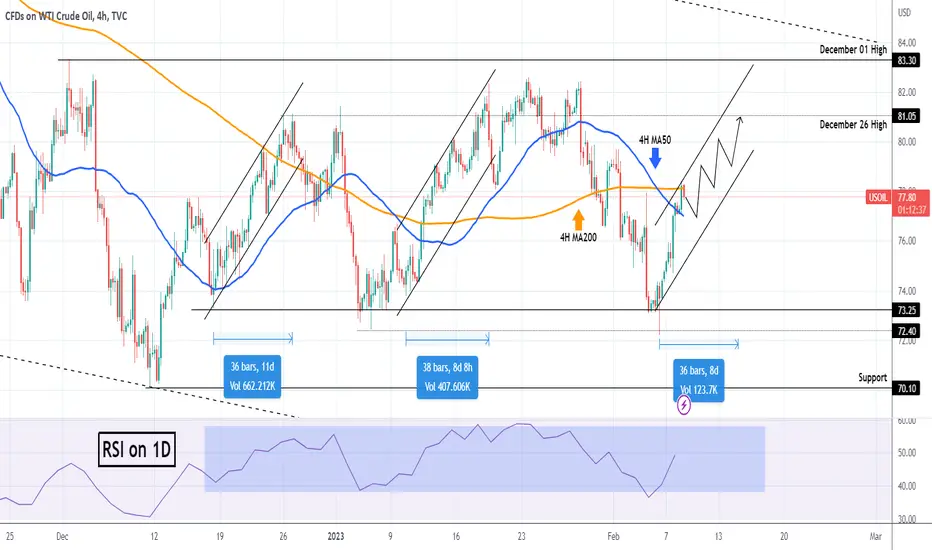
WTI OIL Approaching the best sell entry since December.WTI Oil (USOIL) has been rising within the short-term Channel Up as presented on our analysis last week:
As previously mentioned, since December 12, WTI hasn't closed below the 72.40 Support or above the 83.30 Resistance. That keeps the price ranged and recurring patterns emerge. One of those is the current Channel Up which is quite similar to the Channel Up patterns of December 16 - 27 and January 05 - 18.
This is what helped us take the buy last week above the 4H MA200 (orange trend-line), while the 4H MA50 (blue trend-line) gave a boost on February 09. The price is now approaching the orange Resistance Zone and technically a price near 81.50 is a Sell despite the presence of a Higher Highs trend-line.
The reason is that the previous two Chanel Up patterns took approximately 36 and 38 candles respectively from bottom to top. A 36 bar sequence gets completed tomorrow so by Wednesday the latest (if this fractal gets repeated again), the Channel Up should top. We are waiting for that top, or better yet Double Top, to sell again and target the 73.25 Support.
-------------------------------------------------------------------------------
** Please LIKE 👍, FOLLOW ✅, SHARE 🙌 and COMMENT ✍ if you enjoy this idea! Also share your ideas and charts in the comments section below! **
-------------------------------------------------------------------------------
💸💸💸💸💸💸
👇 👇 👇 👇 👇 👇

WTI OIL Recurring pattern turning it neutral mid-term?Our previous WTI Oil (USOIL) signal couldn't have gone any better as the bearish reversal was confirmed and we took the sell:
Following the rebound however after the (marginal) fake-out just below the 72.40 Support, we see the medium-term scene turning neutral. The reason is that since December 12, so effectively in the past 2 months, WTI hasn't closed below the 72.40 Support or above the 83.30 Resistance. And on top of that, the current rise looks quite similar to the Channel Up patterns of December 16 - 27 and January 05 - 18.
As a result, a clear candle closing above the 4H MA200 (orange trend-line), while the 4H MA50 (blue trend-line) is supporting, is a buy signal targeting at least the 81.05 December 26 High. Also look how well the 1D RSI also fits into a range itself.
-------------------------------------------------------------------------------
** Please LIKE 👍, FOLLOW ✅, SHARE 🙌 and COMMENT ✍ if you enjoy this idea! Also share your ideas and charts in the comments section below! **
-------------------------------------------------------------------------------
💸💸💸💸💸💸
👇 👇 👇 👇 👇 👇
OIL BUY POSITIONCRUDE OIL: as you can see it broke out from a trendline and came back to grab some liquidity. this is why it's good to have patience in the market.
we can also spot a double bottom which signifies an up trend.
TIPS
1: always wait for a for a retest when a trendline is broken
2: always map out zones in every trendline breakout as I did so.
3: also it is advisable to do top down approach before entering any trade

WTI Crude oil : The retest to rule them all! 10.5Focus up!
100-101.50 is key retest level of support trend-line stretching back all the way to December 2021, with consistent higher lows.
At the same time, it's also a retest level of the second higher high breakout stretching back from the peak of 128.
China lock down is expected to ease within days, inflation is on the rise, EU oil ban for Russia is likely coming very soon.
An unlikely daily close below 100 could signal further downside to 97 though very unlikely with current fundamental/technical combo.
Do the math and keep the back noise out the picture, look only at key factors and act with caution and patience.
----------------------------------------------------------------------------------------------------------------------------------------------------------------------------------
Thank you so much for reading! If you found my idea useful, it would mean a lot for me if you like and follow!
It's a pleasure for me to help as many traders as possible master trading, so please ask me on the comments anything you'd like.
----------------------------------------------------------------------------------------------------------------------------------------------------------------------------------


WTI OIL Bearish reversal confirmedWTI Oil (USOIL) is so far following the trading plan we presented 11 days ago, rising first towards the 83.40 Resistance and as it failed to break above it, it instead broke the short-term Channel Up downwards:
This basically confirms the bearish reversal of January's rally, with the price breaking below the 4H MA50 (blue trend-line) but at the moment finding Support on both the 4H MA200 (orange trend-line) and 1D MA50 (yellow trend-line). A new rejection on the 4H MA50 and closing below the 4H MA200/ 1D MA50 cluster, will be a sell signal for us, targeting first the Higher Lows (dashed) trend-line and the 70.10 in extension on the longer term.
Check also how the 1D RSI got rejected emphatically on its own Lower Highs trend-line.
-------------------------------------------------------------------------------
** Please LIKE 👍, FOLLOW ✅, SHARE 🙌 and COMMENT ✍ if you enjoy this idea! Also share your ideas and charts in the comments section below! **
-------------------------------------------------------------------------------
💸💸💸💸💸💸
👇 👇 👇 👇 👇 👇

WTI OIL Limited upside, significant downsideIt is time to update our WTI Oil (USOIL) thesis, which was bullish last week as the Resistance within the Channel Up broke:
This time we see one last rise as a possibility since the price is rebounding on the 4H MA50 (blue trend-line) but limited to the 83.40 Resistance. An exception can be made to an overextension to the 85.00 - 86.00 range on the red zone, which is the top (Lower Highs) limit of the 5-month Channel Down (dashed lines).
On that point or if the price breaks below the 4H MA50 first, we expect a strong drop, with the downside open to at least the 70.10 Support. A more likely scenario in our opinion.
-------------------------------------------------------------------------------
** Please LIKE 👍, FOLLOW ✅, SHARE 🙌 and COMMENT ✍ if you enjoy this idea! Also share your ideas and charts in the comments section below! **
-------------------------------------------------------------------------------
💸💸💸💸💸💸
👇 👇 👇 👇 👇 👇

Crude oil💥1D -TIMEFRAME ANALYSISCrude oil💥1D -TIMEFRAME ANALYSIS
💗Hello ladies and gentlemen
This is my new idea for 💥Oil
I hope my idea is clear
Support me by like and share thank you
Stay Safe💯💲💲💲
Good luck💰😍

brent shortIf we see the entry signal in this zone with the set loss limit, we will enter the matter of the degree of ascent, but keep in mind that this signal is used in the upper periods, so you must be patient enough, but if the goals are achieved, there will be a good profit.
Financial Wave. CLOur priority view in CL remains the same. A downward move could take Oil prices to the first target of $62.92. If the CL price rises above $81.72 our scenario will change.

WTI OIL 4H Death Cross. Trade the break-outs.WTI Oil (USOIL) formed yesterday a Death Cross on the 4H time-frame, the first such (bearish) formation in almost 2 months (since November 17 2022). The price got rejected exactly on both the 4H MA50 (blue trend-line) and 4H MA200 (orange trend-line) following last week's rejection (January 03) on the 1D MA50 (yellow trend-line). We covered this on our last week analysis:
The only pattern that is in favor of Oil rising is the Channel Up of October 18 to November 07, which held the Medium-term Support. A similar Channel Up can re-test the 1D MA50 but as always on risky set-ups, it is best to trade the break-out. That is the 76.70 Resistance, between the 4H MA200 and 4H MA50.
On the downside, a break below the 72.50 Support, targets a Lower Low on the long-term Channel Down (dashed) close to 68.00.
As before, keep an eye on the 1D RSI, which has a clear Lower Highs trend-line that offers solid sell entries.
-------------------------------------------------------------------------------
** Please LIKE 👍, FOLLOW ✅, SHARE 🙌 and COMMENT ✍ if you enjoy this idea! Also share your ideas and charts in the comments section below! **
-------------------------------------------------------------------------------
💸💸💸💸💸💸
👇 👇 👇 👇 👇 👇

Crude oil WTI: Downside contained?Oil WTI failed to break over the 50-day moving average during the session on January 3, and sellers returned after the price topped $80 per barrel.
This resulted in a rapid drop to $73/bbl, making it an interesting area to assess the strength of buyers on dips once again. Remember that the US is actively purchasing crude oil at 67-72 dollars per barrel range in order to replenish its strategic reserves (SPR), which have fallen to their lowest level since 1983.
The level of $70/bbl generated a double bottom between December 9 and December 12, 2022, luring buyers at those prices.
In the coming weeks, the market may retest those levels or even hit $69-68.5/bbl (December 21, 2021 lows). In such a case, the RSI may show a bullish divergence since it will not fall as low as it did at the December 9 price lows.
Thus, the short-term scenario may still have another leg down, albeit the proximity to the purchasing window may limit bearish pressure.
A fresh rise over $80/bbl (the 50DMA and the negative trendline from June to November 2022) would open up new positive prospects towards $84/bbl (23.6% Fibonacci) first and $90/bbl (psychological and highs of November 10, 2022) afterwards.

WTI OIL 4H MA50 holding as Support. Levels to buy and sell.The WTI Oil (USOIL) is having so far a full-action day as it hit the 1D MA50 (yellow trend-line) for the first time since November 16 and got rejected and tested once again the 4H MA50 (blue trend-line) which has been holding as a Support since December 14.
This is basically the same time when the short-term Channel Up emerged and as you see so far has two clear Higher Highs and Higher Lows. We had forecasted this 1D MA50 test almost a month ago based on the 1D RSI Lower Lows fractal similarities with September:
This long-term Target is now done and we can only enter a new buy either after a candle close above the 1D MA50 or now with a tight SL at the bottom of the Channel Up. In both cases the target is 83.90, a new Higher High.
The 4H Golden Cross pattern (MA50 crossing above 4H MA200 (orange trend-line)), hasn't always been bullish though as on October 11 it signaled the top. Ideally that should be on the 1D RSI Lower Highs trend-line, but if the price closes below the 4H MA200, it would be a late sell signal, aiming at the 73.35 Support. Tight SL on both buys and sells, and this approach should work in your favor on the medium-term.
-------------------------------------------------------------------------------
** Please LIKE 👍, FOLLOW ✅, SHARE 🙌 and COMMENT ✍ if you enjoy this idea! Also share your ideas and charts in the comments section below! This is best way to keep it relevant, support me, keep the content here free and allow the idea to reach as many people as possible. **
-------------------------------------------------------------------------------
You may also TELL ME 🙋♀️🙋♂️ in the comments section which symbol you want me to analyze next and on which time-frame. The one with the most posts will be published tomorrow! 👏🎁
-------------------------------------------------------------------------------
💸💸💸💸💸💸
👇 👇 👇 👇 👇 👇

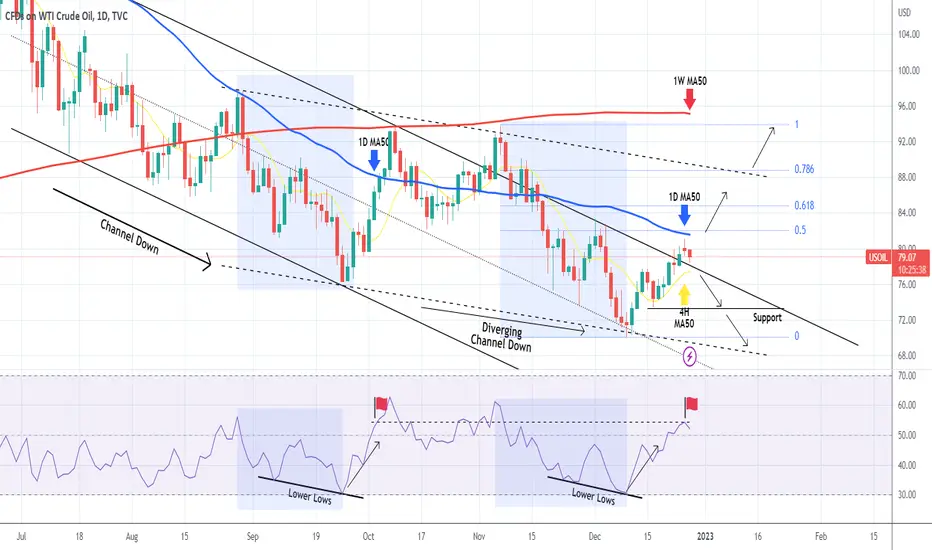
WTI OIL Struggling on the 1D MA50.It has been almost 20 days since our buy signal on WTI Oil (USOIL) after it hit the bottom of the (diverging) Channel Down (dashed lines):
As you see, the price hit our target on the top (Lower Highs trend-line) of the previous Channel Down, but yesterday failed to break the 1D MA50 (blue trend-line) and gor rejected downwards. If it breaks and closes above the 1D MA50 (which happens to be around the 0.5 Fibonacci), we expect one last extension to the 0.618 Fib (84.80) and max the 0.786 Fib (88.80) and test the top (Lower Highs trend-line) of the Diverging Channel Down.
If however the price breaks and closes below the 4H MA50 (yellow trend-line), we will turn bearish instead, targeting the 73.30 Support and potentially (we will update the conditions with a new analysis) the bottom (Lower Lows trend-line) of the Channel Down.
As you may remember, the basis for our buy signal early in December was the similarities with the September sell-off fractal. See how on the 1D RSI the indicator got rejected exactly on the level where on October 04 the price hit the 1D MA50. Unlike yesterday and today, the price broke above it on Oct 05 as a result giving as a significant divergence from our model.
-------------------------------------------------------------------------------
** Please LIKE 👍, SUBSCRIBE ✅, SHARE 🙌 and COMMENT ✍ if you enjoy this idea! Also share your ideas and charts in the comments section below! This is best way to keep it relevant, support me, keep the content here free and allow the idea to reach as many people as possible. **
-------------------------------------------------------------------------------
You may also TELL ME 🙋♀️🙋♂️ in the comments section which symbol you want me to analyze next and on which time-frame. The one with the most posts will be published tomorrow! 👏🎁
-------------------------------------------------------------------------------
💸💸💸💸💸💸
👇 👇 👇 👇 👇 👇
WTI OIL Important test for the uptrend on the 4H MA200.WTI Oil (USOIL) has been closely following our recent projections, both the perfect buy entry caught 12 days ago after spotting the Lower Lows bottom fractal similar to September 26, as well as the most recent buy 6 days ago after the 4H MA50 (blue trend-line) held as Support:
We are again on the 4H time-frame, with the price continuing to replicate the post September 26 rise. At the moment it is testing the 4H MA200 (orange trend-line) where the price took a 1 day pause on October 04. Our signal to continue this uptrend is a closing above the 1D MA50 (yellow trend-line), where we will expect a new Lower High near the diverging Channel Down (dashed line) around the Rectangle.
Failure to do so, should have the price pull back and test the 4H MA50 again where a 1D closing below, will be a bearish signal for us targeting 72.00.
-------------------------------------------------------------------------------
** Please LIKE 👍, SUBSCRIBE ✅, SHARE 🙌 and COMMENT ✍ if you enjoy this idea! Also share your ideas and charts in the comments section below! This is best way to keep it relevant, support me, keep the content here free and allow the idea to reach as many people as possible. **
-------------------------------------------------------------------------------
You may also TELL ME 🙋♀️🙋♂️ in the comments section which symbol you want me to analyze next and on which time-frame. The one with the most posts will be published tomorrow! 👏🎁
-------------------------------------------------------------------------------
💸💸💸💸💸💸
👇 👇 👇 👇 👇 👇


MCL bullish patternI'm still short on MCL but it looks like an ending diagonal is taking place for wave 5, IF this is the case i will expect an explosive bullish move to $97 once the pattern has unfolded. I will be patiently waiting, for now i will continue taking short trades

Short OIL - BIG Swing - WHEN WTI LOSTUSOIL is at the verge of making a "terrific" decision.
I am selling and looking for a breach.
My Elliott Wave Analysis points me towards a Intermediate (C) wave.
Comment or DM on this.
P.S. It's that "sinking Titanic".
