Storm coming on Oil?A repeating pattern and strong economic events for the next week shows that oil may sink in the upcoming week
or will oil prices continue to rise because of the war in Ukraine?
Oilsignals


USOIL Crude oil : Russian oil ban, what's next? 4.5The pennant consolidation opened the week with a breakout and a retest confirmation of the breakout.
Consolidation took place between Jan - April 2022, With a high of ~128 and a low of ~88.
The breakout is a major bullish technical alert, indicating new daily up-trend.
Resistance levels on the new up-trend are:
*106.80 - 108.50
*114.60 - 116.40
*125 - 127.80
Retest potential to the downside:
*Consolidation retest - 100-101.50
*Consolidation support floor - 96.50-98.20
A break below consolidation may lead to trend reversal, but for now bullish indications on full alert!
Russian oil sanctions are increasing and we have 1 million barrels a day off circulation as of now, this amount is expected to double soon, Bernard Looney, CEO of BP oil company says.
This is a fundamental trigger for the technical breakout.
-----------------------------------------------------------------------------------------------------------------
Thank you so much for reading! If you found my idea useful please like and follow - It would truly mean a lot to me.
I promise to respond to any and all questions/comments, so don't hesitate!
Always be careful trading and make your own research, best of luck.
-----------------------------------------------------------------------------------------------------------------

OIL BRENT Local Short!!OIL_BRENT is trading in a narrwing wedge
And will soon retest a horizontal resistance at 112.45
A bearish move down will follow
However, IF the resistance is broken to the upside
The setup is invalid

Crude Oil Rally PatternCrude Oil USOIL seems to be following a very similar pattern
Following this Idea, the next two days we'll be waiting for a pull back to 100 level, and then get into another rally.
The Question is, Will Crude Oil Stay on pattern? or news and the economic calendar will take it out?

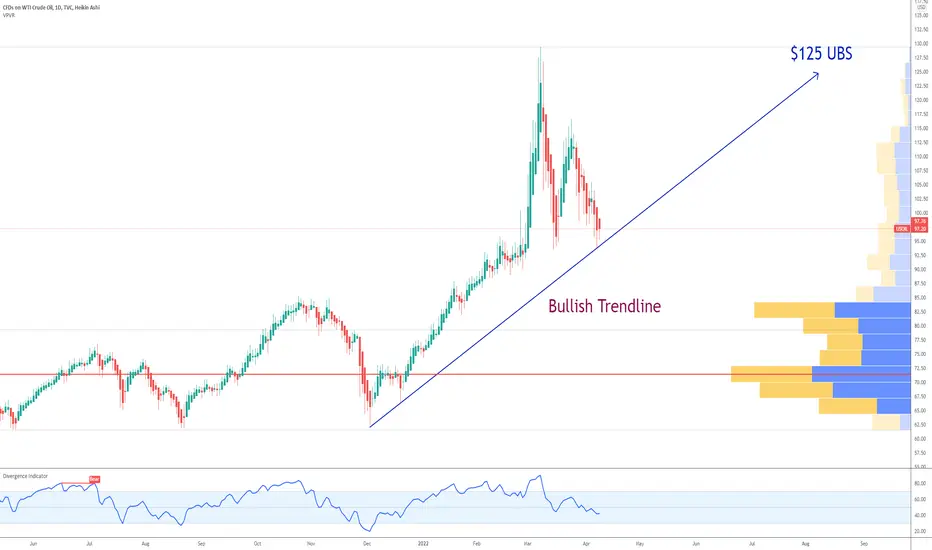
Crude Oil Price Target for this SummerIf you haven`t seen my last post:
Then you should know that Crude Oil is in a bullish trendline with a price target of $125 by the end of this summer.

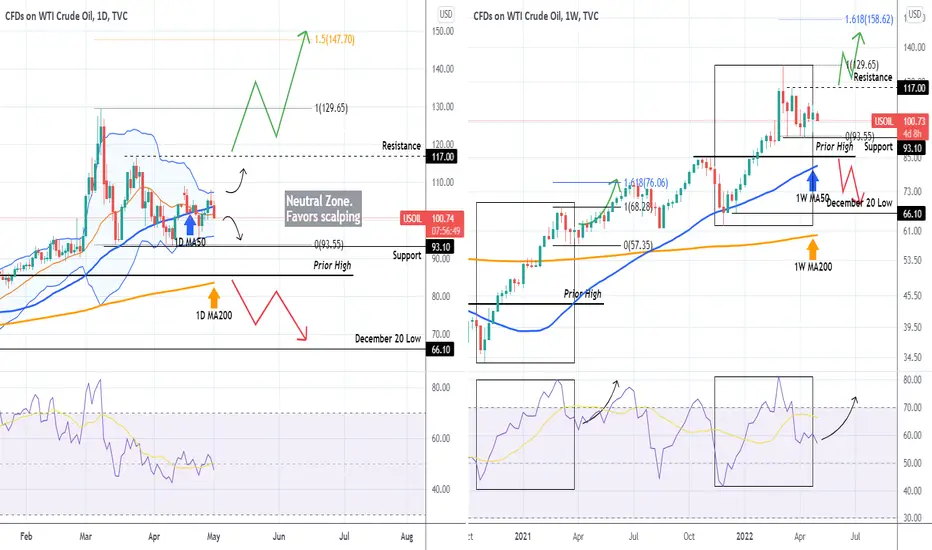
WTI OIL Scalping medium-term. Check these break-out levels.On my last WTI Oil analysis, I stated that the price action was neutral, which favored scalping:
Two weeks later, that still remains the case as we remain within the 117.00 Resistance and 93.10 Support, with the 1D MA50 (blue trend-line) being used as the pivot trend-line. For now, a high return strategy would be scalping the 1D Bollinger Bands (chart on the left).
On the longer-term 1W time-frame though (chart on the right), we see that the last 5 months resemble the price action of late 2020/ early 2021. The 1W TSI sequence is fairly similar and the longer we trade sideways on the medium-term the more it favors the consolidation bias of the accumulation scenario of March - April 2021 and then bullish break-out towards the 1.618 Fibonacci extension. A break below the 'Prior High' level of 85.00 would break both the 1D MA200 and the 1W MA200 (orange trend-lines on both charts) and should target the 66.10 December Low at least.
--------------------------------------------------------------------------------------------------------
** Please support this idea with your likes and comments, it is the best way to keep it relevant and support me. **
--------------------------------------------------------------------------------------------------------
USOIL WTI Crude Oil forecastUSOIL WTI Crude Oil
Entry Range: $101.40 - 104.60
Take Profit 1: $106.90
Take Profit 2: $109.20
Take Profit 3: $112.50
Stop Loss: $94.80

Oil is on an important LevelWatchout for this level. one of my fav chart because it is easy to read and predict.

Short-term analysis #cruodeIf the ascending channel is broken, it can fall to 105 areas, otherwise it will continue to ascend.

WTI OIL Neutral short-term buy watch these break-out levels.WTI Oil (USOIL) just broke above the Lower Highs trend-line that started after the brutal March 08 multi-year High. The 4H MA50 (blue trend-line) has turned into a short-term Support while the 4H MA200 (orange trend-line) remains the short-term Resistance.
Despite the Lower Highs trend-line, the price action remains rather neutral due to March's wild swings and high volatility, unless either the 93.10 Support or the 117.00 Resistance break.
A break below 93.10 should be bearish towards the 1D MA200 (red trend-line) and then the December 20 low, but still it would be best to get a closing below the 85.50 High of 2021 before engaging into long-term selling.
A break above 117.00 should be bullish towards the 1.5 Fibonacci extension (152.60) long-term, which is the less likely scenario.
The safest strategy on the medium-term is to scalp inside the neutral zone.
--------------------------------------------------------------------------------------------------------
Please like, subscribe and share your ideas and charts with the community!
--------------------------------------------------------------------------------------------------------

Long-term oil analysis #oilsome notes:
1_In World War II, because the United States won the war, it said that my dollar should be the reference currency
2_The United States did not fulfill its contract and did not store gold against the dollar
3_European countries realized and wanted to buy gold under the same law for every $ 35 an ounce of gold
4_Meanwhile, Arab countries imposed sanctions on Europe and oil prices rose
5_Now European countries needed dollars to buy oil
6_If oil prices are low, it is very dangerous for
the United States because negative inflation in the United States will form and stagnate.
Because the United States runs its country with
debt, it's the best inflationary position
7- America wants a lot of production so that the
industries will stop working and there will be an increase

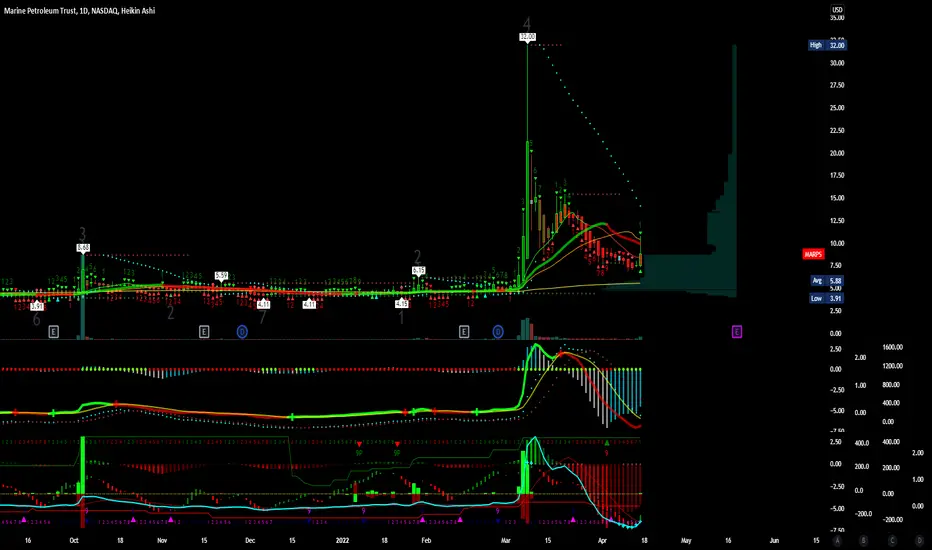
$MARPS Next Target PTs 32-45 and higherMarine Petroleum Trust, together with its subsidiary, Marine Petroleum Corporation, operates as a royalty trust in the United States. As of June 30, 2021, the company had an overriding royalty interest in 55 oil and natural gas leases covering approximately 199,868 gross acres located in the Central and Western areas of the Gulf of Mexico off the coasts of Louisiana and Texas. Marine Petroleum Trust was incorporated in 1956 and is based in Dallas, Texas.

$HUSA Next Target PTs 16-35 and higher Long term PT 150 and highHouston American Energy Corp., an independent energy company, acquires, explores for, develops, and produces natural gas, crude oil, and condensate. Its oil and gas properties are located primarily in the Texas Permian Basin, the onshore Texas and Louisiana Gulf Coast region, and in the South American country of Colombia. As of December 31, 2020, the company owned interests in four gross wells. Houston American Energy Corp. was incorporated in 2001 and is based in Houston, Texas.

$IMPP Next Target PTs 9-18 and higherImperial Petroleum Inc. provides international seaborne transportation services to oil producers, refineries, and commodities traders. It carries refined petroleum products, such as gasoline, diesel, fuel oil, and jet fuel, as well as edible oils and chemicals; and crude oils. As of March 29, 2022, the company owned four medium range refined petroleum product tankers and one Aframax crude oil tanker with a total capacity of 305,804 deadweight tons. The company was incorporated in 2021 and is based in Athens, Greece.

#oil #usoil #wtiIt seems to be the last area of support for crude oil and can be purchased with the appropriate risk-to-risk ratio.

USOIL Price Target for the summer With increase in demand from travel this year, despite the high inflation and exploding prices, UBS has put a price target for Crude Oil of $125.
The bullish trendline is there to confirm this outcome.
Looking forward to read your opinion about it.
WTI bulls step in with price holding back above $100bblsThe West Texas Intermediate Crude Oil market has rallied a bit on Wednesday to break above the top of the candlestick from Tuesday. If you remember, the Tuesday candlestick was what I referred to as a potential “binary trade”, meaning that if we can break above it, the market could go higher. After all, the neutral candlestick suggests that we are in the midst of trying to figure out whether or not momentum will pick up.
Now that we have broken decisively to the upside, the market looks very likely to continue going higher, perhaps reaching towards the $120 level. Given enough time, we could go all the way to the $130 level yet again. The market has been very bullish, but I do not want to see some type of parabolic move, because as you can see, we had recently had one of those, which of course fell apart quite drastically. There is only a certain amount of momentum that can come into a market without it falling apart, so the sustainability of the uptrend is what I am looking for.
Looking at the chart, the 50-day EMA is sitting at the $96.55 level and climbing. As long as we can stay above this indicator, it does suggest that we are still in an uptrend. The size of the candlestick is rather impressive, so I think we will continue to see buyers on every short-term dip. The market has been very noisy but has also been decidedly positive. I have no scenario in which I am willing to short the oil market anytime soon, so looking at dips as potential buying opportunities will continue to be the way to approach the market. That being said, we will eventually run into “demand destruction”, but I do not think we are anywhere near that right now.
Ultimately, this is a market that I think has quite a bit of upward mobility to it, especially as the war in Ukraine rages on. The lack of Russian oil on the open market is going to continue to cause issues, but inflation itself is reason enough to think that oil should continue to go higher. Regardless, this is a market that continues to offer plenty of opportunities for those willing to be patient enough to find value.
Russian Foreign Minister Sergei Lavrov said the US gave written guarantees that Western sanctions against the country will not impact future trade with Iran, CNBC reported on 18 March.
After hovering lower for two weeks, Brent briefly returned to above $120/bbl on 25 March on reports that Yemen’s Houthi rebels – backed by Iran – launched fresh attacks on Saudia Arabia. The attack hit Saudi Aramco’s oil depot in Jeddah and other facilities in Riyadh. WTI also rose to above $114/bbl on the day.
The man who predicted crude oil $120 in 2020 when crude was at $30 alltime low
The EIA raised the trading price of Crude oil by $22 per barrel to an average of $105.22 per barrel in its March Short-Term Energy Outlook (STEO), and the American benchmark West Texas Intermediate (WTI) to $101.17 per barrel. The higher price projection includes concerns about supply disruptions and additional sanctions as a result of Russia’s continued invasion of Ukraine.
Brent is expected to fall to $88.98 per barrel post-2022, whereas WTI will fall to $84.98 per barrel. The EIA emphasized, however, that the price projection is ‘very unpredictable’, as actual price outcomes will be determined by the severity of Russia’s sanctions, any new potential sanctions, and the impact of individual business actions.
In 2020, during the COVID outbreak, the event suddenly draws Crude & Brent oil prices. The crude oil (WTI) starts falling from $65/barrel to $19/barrel.
The continuous fall frightens investors all over the globe. But, Ankit, Wealth Manager (USA), who is also an entrepreneur & investor at that time publicly said on his YouTube video that crude will touch($90-$100) soon due to macroeconomic conditions which central banks created by putting interest rates at an all-time low.
Ankit said in 2020, due to this petrol prices will touch Rs.100 first time in India. In 2022, he seems indeed right. Today petrol prices all over India almost hit Rs.100 due to an international price hike in Brent oil.
Today also his video is still available on his YouTube platform which he created by the name of ‘Market Maestroo’.
This video he released on Dec.25 2020. One can check it as a fact as well. He is one of the only Wealth Managers in the Globe who predicted a rise in Crude oil & only economist in India who predicted Rs100/litre of petrol.
Apart from this, his many predictions in recent times come true which also become the centre of attraction for many
investors. He also predicted inflation is coming & USA inflation may touch 10%. Today Feb 2022, USA inflation is sitting at 30 year high of 8%.
After such successful predictions, Ankit, Wealth Manager (USA), now started gaining popularity & limelight. One of his famous quote in investing is “Investing is done with a calm mind, not to calm your mind
WTI oil outlook: Oil hits $130 per barrel on fears that Russian energy products
WTI bulls move in as US and EU move towards sanctioning Russia further.
US Strategic Petroleum Reserve (SPR) does little to cool down supply concerns.
West Texas Intermediate (WTI) crude oil rose on Monday on persisting supply concerns as Russian energy sanctions are very much on the table following the Russian forces' civilian killings in north Ukraine. For a fresh high of the day, at $103.82. WTI spot is up by some 4.5% as White House's National Security Advisor, Jake Sullivan, announced that the US is working with European allies to coordinate further sanctions on Russia.
Sullivan said that they have concluded Russia has committed war crimes, Bucha offers further evidence to support that, pointing to a protracted war. '' Ukraine-Russia conflict may not be just a few more weeks, could be months.''
Ukraine’s top prosecutor has said 410 bodies had been found in towns recaptured from retreating Russian forces around Kyiv as part of an investigation into possible war crimes. The weekend media reported mass killings of civilians in the town of Bucha which had been under Russian occupation until recently.
The reports led to an array of calls from within the European Union for the bloc to go further in punishing Moscow. Consequently, a fifth package of sanctions against Russia is being arranged with the new round of measures expected to be approved later this week.
Meanwhile and despite the release of 180-million barrels from the US Strategic Petroleum Reserve (SPR) and an agreement last week from members of the International Energy Agency (IEA) to release some of their own strategic reserves, oil is firmer due to the persistence of geopolitical concerns.
"The global oil market remains in deep deficit of likely 1.5 mb/d over the last 4 weeks, before the loss of Russian supply even started, with global inventories at their lowest levels in recent history on a demand-adjusted basis and with limited OPEC and shale elasticity in months to come. Demand destruction requires higher prices, yet this dynamic is being nullified by increased government interventions in cutting gasoline taxes," Goldman Sachs said in a report.
''Indeed, while the SPR release can quell near-term tightness concerns, it does not solve the longer-term issues in the crude market. Structural deficit conditions could still persist down the road as these reserves will need to be replenished at a time when global spare capacity and inventory levels will still be stretched,'' analysts at TD Securities explained.
''In this sense, the right tail in energy markets is set to remain structurally fat as depleted reserves would add to the existing risks of self-sanctioning, stretched spare capacity across OPEC+, constrained shale production, an uncertain Iran deal and OECD inventories at their lowest since the Arab Spring. We expect this vast array of supply risks to remain the driving force in the energy market.''

WTI OIL is correcting. Continue to fall or new rally ahead?A month ago when WTI Oil was testing historic Highs due to the escalation of the Ukraine - Russia war, I called for the need to pull-back to the 1D MA50 (blue trend-line):
That day turned out to be the market top (to this date) and Oil did pull-back to the 1D MA50. In fact after the first 1D MA50 test (and hold), the price rebounded but only managed to make a Lower High and eventually got rejected back towards the 1D MA50 again, which held (so far) for the 2nd time. It is obvious that as long as it holds, it makes a stronger case for a new rebound. If that breaks above the prior Lower High/ Resistance of 117.00, then we can claim that the long-term bullish trend will be extended and in the next 3 months we will see successive Higher Highs. The basis for this, as I also analyzed on my March 08 analysis, is the similarities of the past 6 months of Oil's price action with the September 2020 - March 2021 sequence.
On the other hand, if the 1D MA50 fails and a 1D candle closes below it, WTI should seek the next Resistance Zone which consists of the Prior High of 85.50 and the 1D MA200 (orange trend-line), which is currently at 80.75. A closing below the 1D MA200, could open the way to a new Bear Cycle.
--------------------------------------------------------------------------------------------------------
** Please support this idea with your likes and comments, it is the best way to keep it relevant and support me. **
--------------------------------------------------------------------------------------------------------

Daily Technical Analysis (Brent Oil)In the chart above, Brent Crude Oil has just broken downwards from the 0.38 Fibonacci level. The second red line from the top is another level of support that oil has broken out from. Also, the Stochastic RSI diverged (Top Blue Rectangle). Since these events have occurred, the price of oil has been decreasing.
If oil carries ongoing downwards to the 0.5 Fibonacci level then we could see some good level of support, Stochastic RSI has also just diverged (Bottom Blue Rectangle). So, following this, the yellow line shows my price prediction.
If oil carries on going down it could find some support at 0.5 and then rebound upwards. Then the price could find some resistance at the 0.38 level and if the buying power is strong enough the price could breakout upwards. If the buying power is not strong enough then oil could come back to the 0.5 level. Possibly even break through the 0.5 level, but that in opinion is not that likely.

Oil two scenariosMy guess is as long as war is on play, oil will continue to go up, but there's still some possibilities to go around 80$!

LUKOY if i had to pick one russian stockIf i had to pick one russian stock after this huge sell-off, that would be LUKOIL (LUKOY).
PJSC LUKOIL engages in exploration, production, refining, marketing, and distribution of oil and gas.
Last year they had earnings of $773Bil and paid a dividend of $7.35, which is now higher than the price of one share.
It will be adjusted for sure.
The Market Cap is also low, $31.608Bil.
Looking forward to read your opinion about it.
