WTI OIL Higher Lows held. Strong rebound is expected.WTI Oil (USOIL) is about to complete an Inverse Head and Shoulders (IH&S) pattern whose Head was right above the Higher Lows trend-line.
An imminent break above the 4H MA50 (blue trend-line) will confirm the start of the new Bullish Leg towards the Resistance Zone. Our Target remains 78.50.
Notice how the 4H RSI has already broken above its Lower Highs trend-line, as it did on the September 09 break-out.
-------------------------------------------------------------------------------
** Please LIKE 👍, FOLLOW ✅, SHARE 🙌 and COMMENT ✍ if you enjoy this idea! Also share your ideas and charts in the comments section below! This is best way to keep it relevant, support us, keep the content here free and allow the idea to reach as many people as possible. **
-------------------------------------------------------------------------------
💸💸💸💸💸💸
👇 👇 👇 👇 👇 👇
Oilsignals

WTI OIL Strong buy signal on the 0.618 FibWTI Oil (USOIL) gave us the best of sell signals on our last analysis (October 08, see chart below) as the 1D MA200 (orange trend-line) initiated a strong decline that hit our 72.50 Target:
The decline broke below the 1D MA50 (blue trend-line) and even reached yesterday the 0.618 Fibonacci retracement level, which on the similar Channel Up fractal of early 2024 was the level where the Higher Low was priced, bottomed and started the next Bullish Leg.
The presence of the Lower Highs trend-line since the September 28 2023 High however, doesn't give us much upside room for a great rally, so we will turn bullish again but only for the short-term, targeting 78.50.
-------------------------------------------------------------------------------
** Please LIKE 👍, FOLLOW ✅, SHARE 🙌 and COMMENT ✍ if you enjoy this idea! Also share your ideas and charts in the comments section below! This is best way to keep it relevant, support us, keep the content here free and allow the idea to reach as many people as possible. **
-------------------------------------------------------------------------------
💸💸💸💸💸💸
👇 👇 👇 👇 👇 👇

WTI Crude Oil: Navigating Market Waves with Technical PrecisionH ello,
West Texas Intermediate (WTI) Crude Oil is a major benchmark for oil prices in the U.S. It's widely used as a reference price for oil trading and is a key indicator of global oil market trends.
Chart Explanation
Moving Averages
5-day Moving Average: $74.80
20-day Moving Average: $73.50
50-day Moving Average: $72.00
200-day Moving Average: $70.00
The price is currently above the 5-day, 20-day, and 50-day moving averages, indicating a short-term bullish trend.
Technical Indicators
Relative Strength Index (RSI): 65 (Neutral to Bullish)
MACD (Moving Average Convergence Divergence): 2.0 (Bullish)
Stochastic Oscillator: 70 (Overbought)
Chart Patterns
Candlestick Patterns: Recent patterns show a mix of bullish engulfing and doji, suggesting indecision in the market but with a slight bullish bias.
Support Levels: $72.00, $70.00
Resistance Levels: $78.00, $80.00
Analysis of Sentiments
At present, sentiment on WTI Crude Oil is rather neutral. The sentiment from the technical indicators is ‘buy’, but there is a little bit of energy demand concern as US consumer sentiment has fallen in recent weeks. This calls for a mixed sentiment in which there is hope of price rises but also provides for fears of drop in demand.
News Sentiment
Information from the latest news has been provoking nervy WTI Crude Oil sentiments. The volatility and the love-hate relationship with the Iran issue have fueled wild price speculations and tensions in the Middle East. Commentators are careful in their assessments arguing in these present price levels that there are wear and tear global political forces, however, all expect a way out that will either break prices up into summits or down into bottoms.
Conclusion
In the current prices of WTI Crude Oil, one is able to note that there is a steep bullish movement in the short run. Supported by the key indicators, an uptrend of the market is forecasted. Nonetheless, the stock has neared its peak levels and therefore caution should be taken in regard to possible corrections. The price areas close given as $72.00 and $70.00 can present purchasing chances, if any, while selling pressures, if any, at the price boundaries given as $78.00 and $80.00 will be significant to watch.
Regards,
Ely

US oil creating bullish momentum on 4H
Not stop entry
Wait for little consolidation, wicks or bullish momentum candle at entry
SL are below from golden ratio and take less risk by putting SL below the momentum candle
Actually we miss the trade but mark alert maybe market retest and you get the trade

Brent Crude Oil Analysis==>> Fundamental + TechnicalBrent Crude Oil ( FX_IDC:USDBRO ) began to rise from the Heavy Support zone($71.30-$64.80) after Iran attacked Israel . ( It seemed that before the attack of Iran, Brent oil intended to fall and correction further ).
Today's fundamental analysis of Brent crude oil prices is influenced by several key factors:
Geopolitical Tensions : The ongoing conflict in the Middle East, especially between Iran and Israel, has raised concerns about potential disruptions to oil production and exports. Any attacks on Iranian oil infrastructure, particularly in the Strait of Hormuz, a crucial passage for global oil exports, could reduce supply and drive prices higher. These concerns have contributed to the recent rise in Brent prices, pushing it above $80 per barrel.
Global Demand : China's recent large-scale economic stimulus aimed at boosting recovery has increased optimism for higher oil demand. As the world's largest oil consumer, any rise in demand from China directly influences global oil prices.
OPEC+ Supply Capacity : Although OPEC+ still has significant spare production capacity, there are worries that a severe crisis in the region could overwhelm this capacity, preventing the group from compensating for any sudden drop in supply.
Overall, the short-term outlook for Brent crude appears bullish, driven by geopolitical uncertainties and potential increases in demand from China. However, the market remains cautious to see if these trends will hold over time.
Now, according to the fundamental analysis of Brent Crude Oi, let's see which area is suitable for buying Brent Crude Oi .
Brent Crude Oil is moving near the Support zone and the Support line .
Brent Crude Oil's movement structure is corrective , and we should expect it to move upwards again .
I expect Brent Crude Oil to start rising again from or near the Support zone and at least to $81(Yearly Pivot Point) and then attack the Resistance lines .
Brent Crude Oil Analyze (USDBRO), Daily time frame⏰.
🔔 Be sure to follow the updated ideas. 🔔
Do not forget to put Stop loss for your positions (For every position you want to open).
Please follow your strategy and updates; this is just my Idea, and I will gladly see your ideas in this post.
Please do not forget the ✅' like '✅ button 🙏😊 & Share it with your friends; thanks, and Trade safe.

WTI OIL 1D MA200 rejection giving the perfect sell.WTI Oil (USOIL) hit our 76.00 Target as presented on our September 24 idea (see chart below):
Today even though the price breached the 1D MA200 (orange trend-line), it has since been forcefully rejected. This is not a surprise as all medium-term rallies coming off a Support level bounce since June 2023, were all rejected on the short-term on the 1D MA200. The July 13 2023 one got rejected back to its 0.382 Fibonacci retracement level, while the January 29 2024 one dived lower to the 0.618 Fib.
The 1D RSI (red circles) indicates that we are currently exactly on such a rejection sequence. As a result, we turn bearish on WTI, expecting at least a 1D MA50 (blue trend-line) breach at 72.50, which is a Target marginally below the 0.382 Fib.
-------------------------------------------------------------------------------
** Please LIKE 👍, FOLLOW ✅, SHARE 🙌 and COMMENT ✍ if you enjoy this idea! Also share your ideas and charts in the comments section below! This is best way to keep it relevant, support us, keep the content here free and allow the idea to reach as many people as possible. **
-------------------------------------------------------------------------------
💸💸💸💸💸💸
👇 👇 👇 👇 👇 👇

WTI: Will Iran drag Saudi into conflict? Israeli officials are considering how to respond after an Iranian missile strike on Wednesday, which caused little damage, but definitely had the potential to do so.
Their next steps could depend on the U.S. stance. President Joe Biden reaffirmed U.S. support for Israel but made it clear on Wednesday that he would not support Israeli strikes on Iran’s nuclear sites.
Oil prices have already jumped 5% after Biden mentioned discussions about possible Israeli strikes on Iran’s oil industry. Iran, the world’s seventh-largest oil producer, exports about half of its oil, mainly to China.
If tensions escalate into a broader conflict, Iran it is expected to draw Israel’s regional allies, including Saudi Arabia (an even larger oil producer than Iran) and Jordan, into the confrontation.

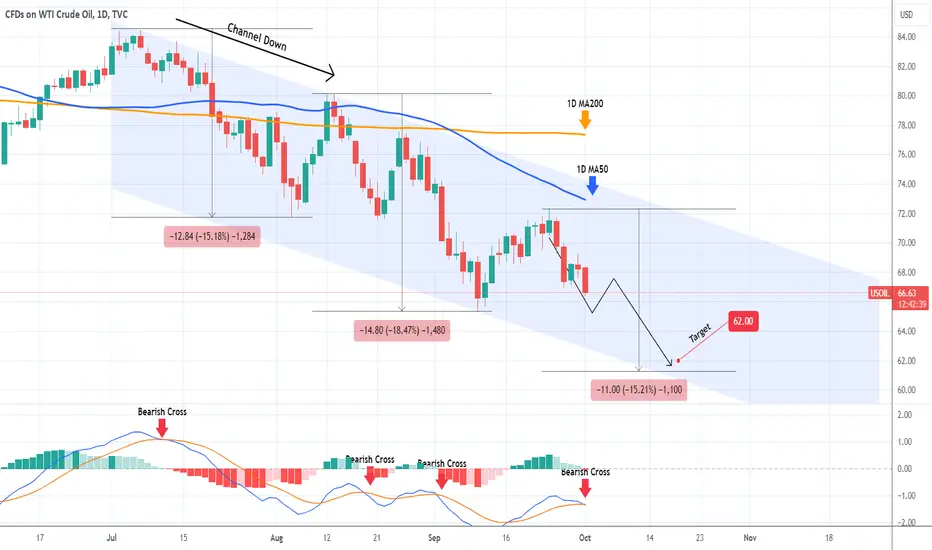
WTI OIL Channel Down prevailed. Lower Low expected.WTI Oil (USOIL) eventually failed to recover the 1D MA50 (blue trend-line), which has been the Resistance since August 13, and reversed the short-term rebound. The 3-month Channel Down appears to have prevailed and technically is now looking for its third Lower Low.
The previous two declined by -18.47% and -15.18% respectively, so roughly we same % drop. As the 1D MACD formed a Bearish Cross today, we can claim that we have the necessary confirmation for a Bearish Leg that at best, we are half-way on it.
Assuming the minimum drop of -15.18%, we expect to see at least $62.00 before this Leg prices the Lower Low.
-------------------------------------------------------------------------------
** Please LIKE 👍, FOLLOW ✅, SHARE 🙌 and COMMENT ✍ if you enjoy this idea! Also share your ideas and charts in the comments section below! This is best way to keep it relevant, support us, keep the content here free and allow the idea to reach as many people as possible. **
-------------------------------------------------------------------------------
💸💸💸💸💸💸
👇 👇 👇 👇 👇 👇
Bearish reversal off overlap resistance?USOUSD is rising towards the resistance level which is an overlap resistance that aligns with the 50% Fibonacci retracement and could reverse from this level to our take profit.
Entry: 70.48
Why we like it:
There is an overlap resistance level which aligns with the 50% Fibonacci retracement.
Stop loss: 72.55
Why we like it:
There is an overlap resistance level.
Take profit: 67.99
Why we like it:
There is a pullback support level.
Enjoying your TradingView experience? Review us!
Please be advised that the information presented on TradingView is provided to Vantage (‘Vantage Global Limited’, ‘we’) by a third-party provider (‘Everest Fortune Group’). Please be reminded that you are solely responsible for the trading decisions on your account. There is a very high degree of risk involved in trading. Any information and/or content is intended entirely for research, educational and informational purposes only and does not constitute investment or consultation advice or investment strategy. The information is not tailored to the investment needs of any specific person and therefore does not involve a consideration of any of the investment objectives, financial situation or needs of any viewer that may receive it. Kindly also note that past performance is not a reliable indicator of future results. Actual results may differ materially from those anticipated in forward-looking or past performance statements. We assume no liability as to the accuracy or completeness of any of the information and/or content provided herein and the Company cannot be held responsible for any omission, mistake nor for any loss or damage including without limitation to any loss of profit which may arise from reliance on any information supplied by Everest Fortune Group.

Bearish drop?USOUSD is rising towards the resistance level which is an overlap resistance that aligns with the 23.6% Fibonacci retracement and could reverse from this level to our take profit.
Entry: 69.06
Why we like it:
There is an overlap resistance level that aligns with the 23.6% Fibonacci retracement.
Stop loss: 71.26
Why we like it:
There is an overlap resistance level that lines up with the 61.8% Fibonacci retracement.
Take profit: 65.90
Why we like it:
There is a pullback support level.
Enjoying your TradingView experience? Review us!
Please be advised that the information presented on TradingView is provided to Vantage (‘Vantage Global Limited’, ‘we’) by a third-party provider (‘Everest Fortune Group’). Please be reminded that you are solely responsible for the trading decisions on your account. There is a very high degree of risk involved in trading. Any information and/or content is intended entirely for research, educational and informational purposes only and does not constitute investment or consultation advice or investment strategy. The information is not tailored to the investment needs of any specific person and therefore does not involve a consideration of any of the investment objectives, financial situation or needs of any viewer that may receive it. Kindly also note that past performance is not a reliable indicator of future results. Actual results may differ materially from those anticipated in forward-looking or past performance statements. We assume no liability as to the accuracy or completeness of any of the information and/or content provided herein and the Company cannot be held responsible for any omission, mistake nor for any loss or damage including without limitation to any loss of profit which may arise from reliance on any information supplied by Everest Fortune Group.

WTI OIL Still bullish, targeting the 1D MA200.WTI Oil (USOIL) eventually gave us the 2 green day streak we wanted in order to turn bullish, as per our suggestion 2 weeks ago (September 10, see chart below):
Event though it marginally broke below April's Channel Down, the buying pressure it has build is similar to all 3 major Bullish Legs since June 2023. Notice how the 1D RSI forms the same Bullish Divergence (Channel Up).
However due to the lower bottom than the one we expected, we have to change our Target to 76.00, which represents a +16.60% rise from the bottom, similar to the smaller Bullish Leg of the three that started on the June 04 2024 Low.
-------------------------------------------------------------------------------
** Please LIKE 👍, FOLLOW ✅, SHARE 🙌 and COMMENT ✍ if you enjoy this idea! Also share your ideas and charts in the comments section below! This is best way to keep it relevant, support us, keep the content here free and allow the idea to reach as many people as possible. **
-------------------------------------------------------------------------------
💸💸💸💸💸💸
👇 👇 👇 👇 👇 👇

Crude Oil Weeky key reversal bar indicator for reversal 73.70Crude oil weekly key reversal bar, made a new low closed towards high, 67.40-66.50 is 61.8% & 79.0% fib level, expecting retracement to this level for taking long position. stop loss below key reversal bar low i.e. 65.20, target: 73.70. if price breaks below the key reversal bar with increasing volume then next buying level is 64.30.

WTI OIL giving a buy signal under this condition.Last week we saw how WTI Oil (USOIL) turned bearish long-term following the 1W Death Cross and the breaking below the 16-month Higher Lows trend-line. Even on the 1D time-frame we got a Death Cross formation with the price seemingly reaching the bottom (Lower Lows trend-line) of a newly formed Channel Down.
As a result we may have a short-term buy signal but only if today's 1D candle closes in green, which together with yesterday will make it a series of green days. As you can see on the chart, every time the 1D RSI posted a Bullish Divergence (rising while Oil was falling), it posted successive 1D green candles to confirm a rebound.
So the key now is to form again a streak (even 2) of green days. If not, the buy potential is invalidated. If successful though, we will target 78.00 (top of the Channel Down, +16.55% rise as the previous Bullish Leg).
-------------------------------------------------------------------------------
** Please LIKE 👍, FOLLOW ✅, SHARE 🙌 and COMMENT ✍ if you enjoy this idea! Also share your ideas and charts in the comments section below! This is best way to keep it relevant, support us, keep the content here free and allow the idea to reach as many people as possible. **
-------------------------------------------------------------------------------
💸💸💸💸💸💸
👇 👇 👇 👇 👇 👇

XTIUSD Out look Wti crude oil is has move in bearish direction and has broken its support also going to retest its broke below resistance level also 50 SMA is showing us on 1H a bearish trend and that bearish move is likely to continue

WTI OIL formed 1st 1W Death Cross in 4.5 years!The last long-term signal (July 09, see chart below) on WTI Oil (USOIL) was a rejection (sell) at the top of the former Triangle (Lower Highs trend-line):
The price not only broke below both the 1W MA50 (blue trend-line) and the 1W MA200 (orange trend-line) but also the bottom of the Triangle. The result this week is the formation of a 1W Death Cross, the first one since the COVID crash back in March 2020!
Naturally this is a strong bearish signal, which will be confirmed if the price breaks below the Higher Lows trend-line. If it does we may see a fatal market collapse, as this is a cyclical signal (observe the Sine Waves). In May 2009, it was invalid as the Housing Crisis preceded it, in November 2014 it was halfway through the sell-off of the Oil Crisis and Chinese economic slowdown and in March 2020 it came earlier relative to the previous two but still after the price broke below the Higher Lows trend-line.
As a result, this trend-line is of the utmost importance currently and only if broken (and close a 1M candle below it) can we consider a similar collapse. If it does, we expect at least $45.00, on the way to the Symmetrical Support Zone test.
-------------------------------------------------------------------------------
** Please LIKE 👍, FOLLOW ✅, SHARE 🙌 and COMMENT ✍ if you enjoy this idea! Also share your ideas and charts in the comments section below! This is best way to keep it relevant, support us, keep the content here free and allow the idea to reach as many people as possible. **
-------------------------------------------------------------------------------
💸💸💸💸💸💸
👇 👇 👇 👇 👇 👇

CRUDE OIL (WTI) Bearish Outlook Explained
Crude Oil will most likely keep falling soon.
The price violated a key daily horizontal support and closed below that.
We can anticipate a bearish continuation at least to 71.9
Look for selling the market from a supply area based on a broken structure and a falling trend line.
❤️Please, support my work with like, thank you!❤️

CRUDE OIL (WTI) Bearish Continuation Next Week
Crude Oil will most likely keep falling next week.
The price violated a key daily horizontal support and closed below that.
We can anticipate a bearish continuation at least to 71.9
❤️Please, support my work with like, thank you!❤️

WTI OIL holding the multi-year Support Zone.As mentioned on our last analysis, it is critical for WTI Crude Oil (USOIL) to hold the 1M MA50 (red trend-line) and close the monthly candle (1M) above it. So far it has been holding, the current one is a 1W time-frame chart and as you see even on a weekly basis, all 4 last candles have held the 1M MA50.
At the same time though, the 1W MA200 (orange trend-line) is applying selling pressure for the same time period as a Resistance. If this Zone holds, we still expect a strong rally to start and peak above the 1.5 Fibonacci extension. Our Target Zone is intact at 91.50 - 92.00.
-------------------------------------------------------------------------------
** Please LIKE 👍, FOLLOW ✅, SHARE 🙌 and COMMENT ✍ if you enjoy this idea! Also share your ideas and charts in the comments section below! This is best way to keep it relevant, support us, keep the content here free and allow the idea to reach as many people as possible. **
-------------------------------------------------------------------------------
💸💸💸💸💸💸
👇 👇 👇 👇 👇 👇
WTI OIL This is why it's going to $95.00 if the 1M MA50 helps.WTI Crude Oil (USOIL) has been practically neutral within a Triangle pattern since September 2023, trading under the Resistance pressure of the Lower Highs but at the same time supported by a Higher Lows trend-line. The latter has been placed just below the 1M MA50 (blue trend-line), which is the key to Oil's price action in the coming months.
As you can see, even when the price breaks below it, Oil manages to close the 1M candle (month) above the 1M MA50. In fact the last time it closed a month below it was more than 3.5 years ago (January 2021)!
As a result, if we manage to close August above it again, we expect a strong rebound for Oil. In fact, a similar Triangle pattern was spotted back in 2011 - 2013. As you can see, after several breakings but also closings above the 1M MA50, it eventually initiated a rally that hit the Resistance 2 level.
The 1M RSI sequences among the two fractals are similar as well, so we find no reason why Oil won't stage a similar rally as long as the 1M MA50 keeps holding. Our long-term Target is $95.00.
-------------------------------------------------------------------------------
** Please LIKE 👍, FOLLOW ✅, SHARE 🙌 and COMMENT ✍ if you enjoy this idea! Also share your ideas and charts in the comments section below! This is best way to keep it relevant, support us, keep the content here free and allow the idea to reach as many people as possible. **
-------------------------------------------------------------------------------
💸💸💸💸💸💸
👇 👇 👇 👇 👇 👇

Measure move up???3 pushes down after nice bull trend, 61.8 percent pullback, micro double bottom.
Oil can goes high from here.
Chance to measure move up.
Trade safe.
Good luck.

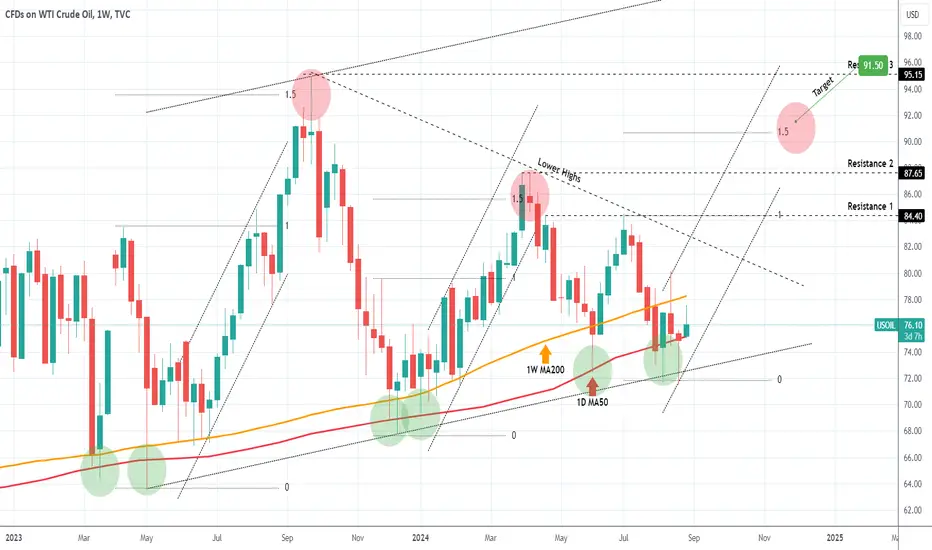
WTI OIL Short-term pullback possible but doesnt change the trendLast week (August 06, see chart below), we made a strong bullish case on WTI Crude Oil (USOIL) and why on the 1M time-frame, the long-term target is $110.00, a symmetric approach on the 10-year Super Cycles:
Today we shift back to the shorter term 1D time-frame, as the price went from $73.00 to $80.00 within a week, and we are looking for potential pull-backs. Short-term corrections on medium-term Channel Ups have been common in the past 1.5 year and are displayed by the red ellipse patterns.
Yesterday's rejection took place on the 1D MA100 (green trend-line), which is something that also took place on January 29 2024. Assuming that a new Channel Up will emerge, we expect it to reach at least the 1.5 Fibonacci extension at $91.50, similar to the April 05 2024 High.
There are numerous Resistance levels involved this time however, with the strongest being the Lower Highs trend-line that started after the September 28 2023 High. As a result caution is advised once the price approaches that level.
-------------------------------------------------------------------------------
** Please LIKE 👍, FOLLOW ✅, SHARE 🙌 and COMMENT ✍ if you enjoy this idea! Also share your ideas and charts in the comments section below! This is best way to keep it relevant, support us, keep the content here free and allow the idea to reach as many people as possible. **
-------------------------------------------------------------------------------
💸💸💸💸💸💸
👇 👇 👇 👇 👇 👇

OILUSD/H4 WTI oil fluctuates in the stable range of $70 - $80.OILUSD forecast on August 13, 2024:
WTI oil is under pressure from the war and DXY is decreasing. Currently, the oil price has risen from the $71 region back to the $80 area. It is likely that oil will experience a correction before continuing its upward trend. The trading trend today is BUY.
Key levels to watch are: 76.5, 78, 80, and 82.
Recommended orders:
Plan 1: BUY OILUSD zone 76-76.5
SL 75.5
TP 78 - 80 - 81.
Plan 2: BUY OILUSD zone 77.60 - 78.10
SL 77.20
TP 79 - 80 - 81.
Plan 3: SELL OILUSD zone 83.30 - 83.50
SL 83.80
TP 82 - 81 - 78.

Thursday Blow - Crude OilSo we have been short term bullish since we took the Weekly SSL and seen a nice trade higher.
I can imagine that we continue this today to take out some internal liquidity.
These are the short term targets as long as we respect the 15min FVG
GLGT
