Turbo Tuesday Crude OiLSo carrying on from our Bullish Bias I am expecting price to move to the Daily +oB and have an bullish reaction to PDH
Closer to NY open I will be looking for this to happen
Daily FVG CE is the target...
Oilsignals

Weekend Wizardry On Crude OilRight now It makes no sense in my mind why the market would want to return to being bearish.
Yes we are in a premium and after a couple days of upwards movement there can be some stagnent action for traders who like to take more than 25-40 ticks ona single move.
So again why would market want to move lower on a htf bases as pointed in my arrows we have a Daily FVG whcih I will be watching price to respect and create a discount in that FVG
The wicks from Friday and Monday Daily chart show immediate rebalance and a propell higher is what I am looking for.
Given Monday can be opposing price to what Tues and Wed Provide... wink wink
Magnet shows my target for next week. to revisit this and whilst in fvg how do we close? Daily fvg CE?
I really do look at price on the day to day basis weekly targets yes but this is a subconscious thought when im trading pacific times of the day.

XTIUSD(WTI/US OIL): Next Target Is $94.00Dear Traders,
Hope you are well, we have an excellent buying opportunity coming up on Oil, price rejected at key level and since then it is bullish on daily timeframe, however, we have seen some bearish correction happening. We have identified a key level where 'imbalance' zone is there. In our analysis we think price will react from this level and move toward $90 and then $94.
Team Setupsfx_

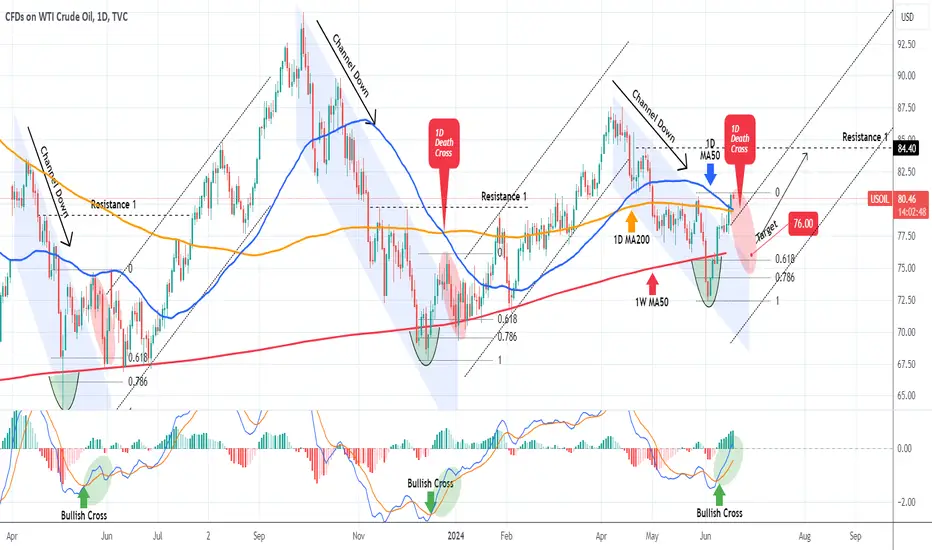
WTI OIL Shifted to longterm bullish, but expect correction firstWTI Oil (USOIL) broke above its 1D MA50 (blue trend-line) and invalidated April's Channel Down. Last time we saw such a Channel Down bullish break-out following a rebound on the 1W MA50 (red trend-line) was on December 20 2023 and before that on May 17 2023.
The common characteristic was that a 1D MACD Bullish Cross accompanied all those break-outs and the last two formed a 1D Death Cross. On both previous occasions, the price pulled back to at least the 0.618 Fibonacci retracement level, touching the 1W MA50 again.
As a result, even though we have confirmed a new long-term uptrend, we will turn bearish on the short-term, expecting a pull-back towards the 0.618 Fib, targeting $76.00.
-------------------------------------------------------------------------------
** Please LIKE 👍, FOLLOW ✅, SHARE 🙌 and COMMENT ✍ if you enjoy this idea! Also share your ideas and charts in the comments section below! This is best way to keep it relevant, support us, keep the content here free and allow the idea to reach as many people as possible. **
-------------------------------------------------------------------------------
💸💸💸💸💸💸
👇 👇 👇 👇 👇 👇
CRUDE OIL (WTI): Time For Pullback
As I predicted yesterday, WTI Crude Oil bounced and reached a key daily resistance.
After the test of the underlined blue structure, the market started to consolidate
and formed a head and shoulders pattern on an hourly time frame.
Bearish breakout of its neckline is a strong bearish signal.
It indicates that the market may retrace from the resistance.
Goals: 80.0 / 79.6
❤️Please, support my work with like, thank you!❤️

Oil Broader Support Market Optimism, Despite Lingering UncertainOil prices edged higher this week, marking their strongest gain in seven days. This upward momentum came despite a somewhat ambiguous outlook for crude itself, suggesting the driving force behind the rise lies elsewhere: positive sentiment in the broader financial markets.
Risk-On Rally Lifts Oil
The primary factor behind oil's recent rise is the prevailing "risk-on" sentiment dominating global markets. Equity indices, particularly in the United States, have been scaling new highs, with the S&P 500 reaching its 30th record this year. This optimism seems to be spilling over into the commodities market, including oil. Investors, buoyed by the positive performance in equities, are displaying a greater willingness to take on risk, and oil is seen as a potential beneficiary.
OPEC+ Cuts and Geopolitical Tensions Offer Underlying Support
Beyond the broader market sentiment, a couple of oil-specific factors are also contributing to the price increase. Firstly, the decision by OPEC+, the world's leading oil producer alliance, to extend production cuts has helped to tighten supply and prop up prices. Anxieties surrounding potential disruptions due to geopolitical tensions in major oil-producing regions like the Middle East are also lending some support.
Mixed Outlook for Crude: Demand Questions Linger
However, the outlook for crude remains somewhat clouded by uncertainties. While the supply side appears relatively stable thanks to OPEC+ intervention, demand remains a question mark. Signs of slowing economic growth in some parts of the world, particularly in Asia, raise concerns about future oil consumption. Data from China, a major consumer of oil, recently indicated weaker-than-expected industrial activity, potentially signaling a softening demand outlook. Additionally, rising gasoline prices in some regions, like India, could dampen consumer spending and lead to lower demand for fuel.
The Balancing Act: Weighing Optimism Against Uncertainty
The current situation presents a complex picture for oil markets. The positive sentiment in broader financial markets is providing a tailwind for oil prices. However, this is counterbalanced by lingering uncertainties about future demand, particularly in Asia. The net effect of these opposing forces will determine the future trajectory of oil prices.
Looking Ahead: Navigating a Volatile Market
Oil will likely see continued volatility in oil markets. Investors will be closely monitoring key factors like:
• Global economic performance: The health of major economies, particularly China, will significantly influence oil demand.
• Monetary policy decisions: Actions by central banks, especially the U.S. Federal Reserve, could impact risk appetite and indirectly affect oil prices.
• Geopolitical developments: Events in major oil-producing regions can disrupt supply and cause price spikes.
By carefully weighing these factors, market participants can navigate the current uncertainty and make informed decisions regarding oil investments.

intermediate trend is up but now trading in sidewayI've set up my TradingView chart for Crude Oil (WTI) in the 1-hour timeframe to understand the current market conditions and potential trading opportunities clearly.
1. Price Levels:
- Right now, the price of crude oil is around $78.217.
- I’ve marked key resistance levels at $80.278 and $79.988. These are the areas where I expect the price might face some selling pressure.
- On the downside, support levels are at $77.557 and $77.550, which could act as a floor if the price drops.
2. Trendlines:
- I’ve drawn a couple of diagonal trendlines that form a channel, showing the range within which the price has been bouncing around.
- These trendlines intersect at several points, which might signal potential breakouts or breakdowns.
3. Volume:
- The volume bars at the bottom are crucial. They show how much crude oil is being traded during each hour.
- Notice the spikes in volume during significant price moves—these often indicate strong market activity and can hint at future price directions.
4. Candlestick Patterns:
- I use candlestick patterns to track price action. Recently, the price has been consolidating around the $78.217 level, which suggests that the market is gathering momentum for a big move.
5. Supply and Demand Zones:
- The shaded areas highlight important supply and demand zones. These zones are where there has been significant buying or selling interest in the past.
- They help me identify potential reversal points and set my stop-loss and take-profit levels more accurately.
6. Support and Resistance Boxes:
- I’ve also drawn boxes around the main support and resistance levels to make them stand out.
- The upper box around $80.278 is a strong resistance zone, while the lower box near $77.550 is a key support area.
This setup helps me keep track of critical price levels and market behavior, making it easier to plan my trades. I rely heavily on these visual cues and patterns to anticipate where the market might head next.

Oil Price Find Footing as Inflation Cools, Russia Threatens CutThe global oil market witnessed a balancing act this week, with prices finding temporary stability despite conflicting forces. While data indicating a possible slowdown in US inflation offered some relief, Russia's vow to cut oil production cast a shadow of potential future price hikes.
West Texas Intermediate (WTI) crude oil futures, the US benchmark, remained above $78 a barrel, clinging to the gains accrued throughout the week. This stability comes after a period of volatility, with oil prices having fluctuated significantly in recent months due to ongoing geopolitical tensions and concerns about global economic growth.
The US Federal Reserve's decision to maintain interest rates at their current level was the primary source of comfort for the market. This decision, coupled with recent signs of cooling inflation, suggests a potential shift in the Fed's monetary policy stance. Earlier concerns about aggressive interest rate hikes to combat inflation had dampened economic activity and raised fears of a recession, potentially leading to a decline in oil demand. The Fed's decision to pause on rate hikes, with the possibility of one cut later in the year, provided a sigh of relief for the oil market.
However, this cautious optimism was countered by Russia's announcement of a potential production cut. Russia, a major oil producer, has been a key player in the recent oil price volatility. The ongoing war in Ukraine has disrupted global oil supplies, and Russia has hinted at further reductions in output in retaliation for Western sanctions. This threat of a supply squeeze could push oil prices higher in the coming months, potentially negating the positive sentiment stemming from the Fed's decision.
Analysts remain divided on the long-term trajectory of oil prices. Some believe that a global economic slowdown, fueled by rising interest rates and ongoing geopolitical tensions, will eventually lead to a decrease in demand. This, coupled with a potential increase in oil production from other major producers like the US, could bring prices down.
However, others warn that the geopolitical risks remain significant. The war in Ukraine shows no signs of abating, and further disruptions to Russian oil exports could trigger another price surge. Additionally, the limited spare production capacity among major producers could make it difficult to compensate for any potential Russian output cuts.
The outlook for oil prices in the coming months is thus uncertain. While the Fed's decision and signs of cooling inflation offer some hope for stability, the threat of Russian production cuts and ongoing geopolitical tensions continue to pose significant upside risks.
Looking beyond the immediate future, the long-term trend for oil prices will likely depend on the pace of the global energy transition. As countries around the world invest in renewable energy sources and push for decarbonization, the demand for oil is expected to decline over time. This could lead to a gradual decrease in oil prices in the long run. However, the transition away from fossil fuels is a complex process, and oil is likely to remain a critical source of energy for many years to come.
In conclusion, the global oil market is currently navigating a period of flux. While short-term factors like the Fed's monetary policy and potential Russian production cuts are influencing prices, the long-term trajectory remains uncertain and will depend heavily on the pace of the global energy transition. Consumers and businesses alike should brace for continued volatility in the oil market, with prices likely to remain sensitive to geopolitical developments and economic data releases.

The Petrodollar Agreement and the Future of OilThe term "petrodollar" refers to the value of oil bought with U.S. dollars. This concept was founded in 1974 when Saudi Arabia and the United States made an agreement to price Saudi oil exports exclusively in U.S. dollars. This arrangement had significant effects on the global economy and politics.
This system increased the global demand for U.S. dollars. Oil-exporting countries like Saudi Arabia committed to selling oil only in dollars, forcing other countries needing oil to acquire U.S. dollars for transactions. This continuous demand strengthened the value of the dollar in global markets.
This system also led to the widespread use of the dollar. Since oil is a strategic commodity used worldwide, the need for dollars to buy oil pushed countries to hold large reserves of dollars. This includes central banks and major companies that rely on importing oil to meet their needs.
Due to the increased demand and continuous use of the dollar, its value became stable. When there is a high and steady demand for a currency, its price fluctuations decrease, making it a stable and reliable currency for international trade. This stability enhanced the dollar's position as the world's main reserve currency.
Why Is the World Watching Now?
Recent geopolitical developments and changes in global alliances have sparked discussions about Saudi Arabia's role in the petrodollar system. Major economies like China and the European Union are emerging as key players in global oil markets, and there are serious and successful attempts to price oil in their currencies.
The BRICS aims to launch a new global economic system, and the idea of pricing oil in non-dollar currencies has been proposed. This idea is not just a theoretical study but is based on tangible real-world evidence. After the Russian war on Ukraine and the subsequent economic sanctions from the U.S. and the West, Russia announced it would sell its oil in rubles under certain conditions. In March 2023, a deal was made for Russia to sell oil to India, with payment in rubles. In the same month, Saudi Arabia announced its intention to consider exporting part of its oil to China in yuan.
The United Arab Emirates took the first step in this field by pricing gas in Chinese yuan. Last year, the Shanghai Stock Exchange announced the pricing of a shipment of Emirati gas in Chinese currency. The UAE did not immediately announce whether it would continue pricing part of its liquefied gas exports in yuan on the Shanghai Stock Exchange or if it was just testing the global market's reaction to this move.
Benefits for the UAE and China
For the UAE, the benefits include diversifying revenue sources and reducing reliance on the U.S. dollar. This move strengthens economic ties with China, the world's second-largest economy, opening up more opportunities for cooperation and joint investments. It also represents a strategic step towards achieving greater flexibility in international financial and trade dealings.
For China, this move enhances the yuan's position as an international currency, contributing to reducing reliance on the U.S. dollar in global trade. By pricing oil and gas in yuan, China can secure energy supplies with its local currency, reducing currency conversion costs and helping to enhance internal financial stability.
Impact on the Dollar
A crucial point is the global push towards renewable energy and the potential decrease in oil demand, which can significantly affect the dynamics of the petrodollar system. As the world seeks to shift to cleaner and more sustainable energy sources, the importance of oil—and thus the petrodollar—may diminish in the global economy.
Additionally, the changing political landscape, including shifts in U.S. foreign policies and Saudi Arabia's strengthening relations with other global powers, may lead to a reevaluation of the petrodollar arrangement. These political shifts might prompt Saudi Arabia and other countries to consider using alternative currencies in oil trade.
Vision for Diversification
Saudi Arabia and the United Arab Emirates aim to diversify their economies away from oil dependence to achieve long-term economic sustainability and reduce risks associated with global oil price fluctuations.
Saudi Arabia's "Vision 2030" aims to diversify income sources and develop new economic sectors such as tourism, entertainment, industry, technology, and education. This program aims to create new job opportunities, attract foreign investments, and achieve comprehensive and sustainable economic growth.
The UAE focuses on developing sectors such as tourism, aviation, trade, finance, technology, real estate, education, and renewable energy. Through this vision, the UAE seeks to strengthen its position as a global hub in various fields, which it has largely succeeded in so far, and reduce its reliance on oil as a main part of its economy.
In summary, the world is closely watching Saudi Arabia and its allies because any changes in their approach to oil trade and currency preferences can have widespread effects on global financial markets, the strength of the U.S. dollar, and international economic relations.

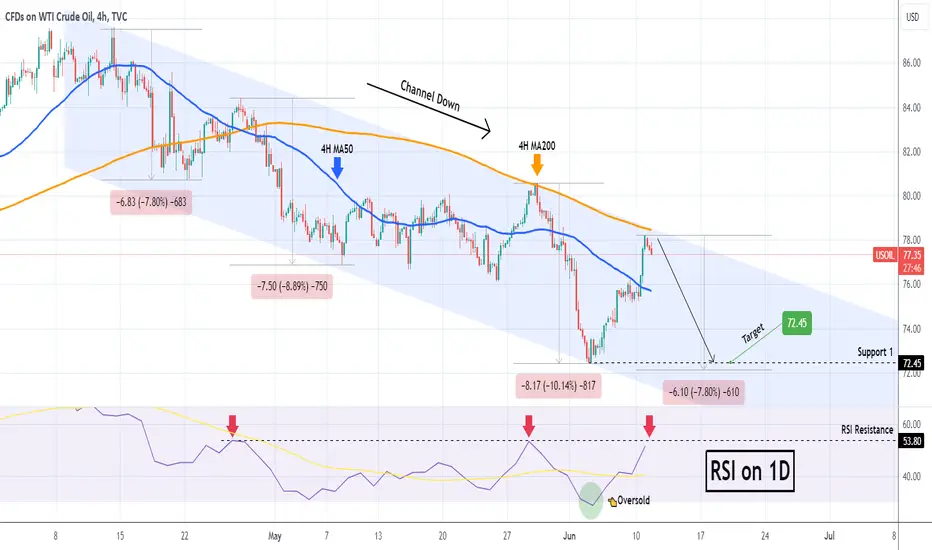
WTI OIL Sell signal at the top of the Channel Down.WIT Oil (USOIL) didn't disappoint last time we looked at it (June 05, see chart below) and delivered our buy signal, easily hitting the 75.70 Target:
The price is now at the top (Lower Highs trend-line) of the 2-month Channel Down and just below the 4H MA200 (orange trend-line), which is where the last Lower High was priced and rejected. At the same time, the 1D RSI is on the 53.80 Resistance, which was the level that priced the last two Lower Highs.
Technically this is the most optimal sell entry on this pattern. We have a modest target at 72.45 (Support 1), as despite the fact that a Lower Low is expected lower, the 1W MA200 looms as a Support and long-term may form a strong Support base. That remains to be seen, so for the time being we take only short-term targets.
-------------------------------------------------------------------------------
** Please LIKE 👍, FOLLOW ✅, SHARE 🙌 and COMMENT ✍ if you enjoy this idea! Also share your ideas and charts in the comments section below! This is best way to keep it relevant, support us, keep the content here free and allow the idea to reach as many people as possible. **
-------------------------------------------------------------------------------
💸💸💸💸💸💸
👇 👇 👇 👇 👇 👇
Turbo Tuesday Crude OilAfter a lavish bullish Monday the next target is the Daily FVG.
Pretty simple
I have a 1hr fvg box if you can see it... that is where price should stay above for price to navigate higher prices heading into NY Tuesday.

CRUDE OIL (WTI): Time to Sell?!
WTI Crude Oil is testing a recently broken horizontal support.
After a violation, it turned into a potentially strong resistance.
Approaching the underlined area, the price formed a head and shoulders pattern
on an hourly time frame.
A breakout of its horizontal neckline is a strong intraday bearish confirmation for us.
We can expect a bearish continuation now.
Goals 74.9 / 74.3
❤️Please, support my work with like, thank you!❤️

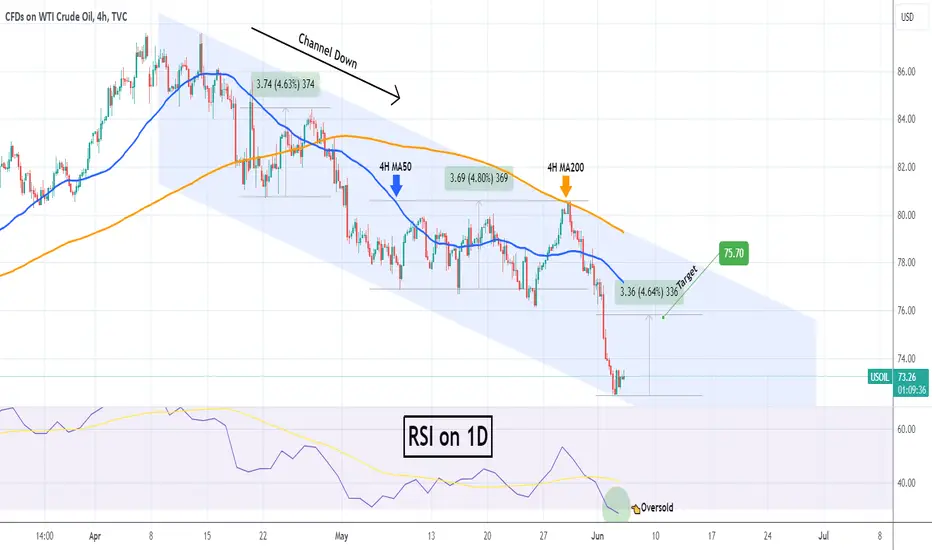
WTI OIL Oversold. Short-term buy signal.WTI Oil (USOIL) hit the bottom of the 2-month Channel Down and is consolidating since yesterday. This prompts to being a technical Lower Low for the pattern and the buy signal gets even stronger as the 1D RSI broke below the oversold barrier for the first time in 6 months (since December 06 2023).
The 4H MA200 (orange trend-line) provided the last rejection (Lower High) on May 29, so that is our Resistance and unless we break above it, the long-term trend remains bearish. But on the short-term we will use this oversold opportunity to buy and target 75.70 (+4.65% rise, which has been the minimum Bullish Leg % within the Channel Down.
-------------------------------------------------------------------------------
** Please LIKE 👍, FOLLOW ✅, SHARE 🙌 and COMMENT ✍ if you enjoy this idea! Also share your ideas and charts in the comments section below! This is best way to keep it relevant, support us, keep the content here free and allow the idea to reach as many people as possible. **
-------------------------------------------------------------------------------
💸💸💸💸💸💸
👇 👇 👇 👇 👇 👇
OPEC+ Lowers Its Sights: Farewell to $100 Oil?The Organization of the Petroleum Exporting Countries and its allies, collectively known as OPEC+, appear to be waving goodbye to their long-held pursuit of $100-a-barrel oil. This strategic shift marks a significant change for the oil cartel, which has traditionally aimed to manipulate production levels to influence global oil prices.
A New Reality Sets In
For years, OPEC+ has strived to maintain a $100 price tag for a barrel of crude. However, the rise of the American shale industry, a technological marvel that unlocked vast domestic oil reserves in the United States, threw a wrench into their plans. This newfound production glut significantly impacted OPEC+'s ability to control oil prices through production cuts.
In a recent meeting, OPEC+ acknowledged this new reality. Instead of clinging to the $100 dream, they announced a gradual increase in production quotas, likely leading to lower oil prices. This decision reflects a pragmatic approach to a market fundamentally changed by US shale production.
Pumping Now, Before the Window Closes
The decision to increase production can be seen as an opportunistic one. With global economies starting to recover from the pandemic and energy demand rising, OPEC+ sees a chance to capitalize on the current market conditions. By pumping more oil now, they can capture a larger share of the market before the shale boom potentially slows down.
However, there are also risks associated with this strategy. Flooding the market with additional crude could lead to a price drop, potentially hurting OPEC+ members' long-term revenue streams.
A Difficult Time for Saudi Arabia
The shift in strategy comes at a particularly challenging time for Saudi Arabia, the de facto leader of OPEC+. The kingdom faces ambitious spending plans to diversify its economy away from oil dependence. Lower oil prices could significantly hamper these efforts, putting a strain on Saudi Arabia's finances.
Uncertainties Remain
While the decision to increase production signifies a move away from the $100 target, the long-term implications remain unclear. The exact impact on oil prices will depend on various factors, including the pace of production increases, global economic growth, and the future trajectory of the US shale industry.
A Reshaped Oil Market
The OPEC+ decision marks a turning point in the global oil market. The era of OPEC+ wielding absolute control over oil prices seems to be over. The rise of US shale has created a new dynamic, forcing OPEC+ to adapt and adjust its strategies.
Looking Ahead
The oil market's future will likely be characterized by greater competition, with OPEC+ and US shale producers vying for market share. How this competition unfolds and how oil prices react will be a story to watch closely in the coming months and years.
Conclusion
OPEC+'s decision to increase oil production signifies a strategic shift away from their long-held pursuit of $100-a-barrel oil. While this move presents potential advantages, it also carries risks, particularly for Saudi Arabia. The future of the oil market remains uncertain, but one thing is clear: the landscape has been reshaped, and the era of OPEC+ dominance is fading.

OPEC+ Extends Production Cuts: A Calculated Volatile MoveThe recent OPEC+ meeting on June 2nd, 2024, resulted in a significant decision to extend production cuts. This move by the oil cartel, which includes major oil producers like Saudi Arabia and Russia, aims to navigate a complex economic climate and influence global oil prices.
Here's a breakdown of the key takeaways from the meeting:
• Extended Cuts of 3.66 Million Bpd Until December 2025: This is the most impactful decision. OPEC+ originally planned to ease these cuts by the end of 2024. However, extending them by a year indicates a commitment to controlling supply and potentially keeping oil prices elevated.
• Prolonged Cuts of 2.2 Million Bpd Until September 2024: These deeper cuts, initially set to expire in June 2024, have been extended for an additional three months. This further tightens the supply in the short term.
• Phased Out Production Cuts (2.2 Million Bpd) from October 2024 to September 2025: While extending cuts, OPEC+ has acknowledged the need for a gradual return to pre-cut production levels. This measured approach aims to prevent a price shock if all cuts were lifted abruptly.
Understanding the reasoning behind these decisions requires looking at the current oil market landscape. Several factors are likely influencing OPEC+'s strategy:
• Geopolitical Tensions: The ongoing conflict between Russia and Ukraine continues to disrupt global energy supplies. This disruption, coupled with potential sanctions on Russian oil, has tightened supply and driven prices upwards. OPEC+ may be aiming to maintain a price floor by keeping production cuts in place.
• Post-Pandemic Recovery: The global economy is still recovering from the COVID-19 pandemic. While demand for oil is increasing, it hasn't fully reached pre-pandemic levels. OPEC+ might be cautious about increasing supply too quickly, fearing it could outpace demand and lead to a price slump.
• Shale Oil Production: The resurgence of shale oil production in the United States is a factor to consider. OPEC+ might be strategically keeping production cuts to maintain its market share and influence over global oil prices.
The decision to extend cuts is likely to have a domino effect:
• Impact on Oil Prices: Analysts predict that the production cut extensions will likely lead to a continued rise in oil prices. This could benefit oil-producing nations but put a strain on consumers and industries reliant on oil, potentially leading to higher transportation costs and production expenses.
• Global Economic Growth: Higher oil prices can dampen economic growth as consumer spending power decreases due to increased energy costs. This is a concern for countries already grappling with inflation.
• Shift Towards Renewables: OPEC+'s move to control supply could incentivize a faster transition towards renewable energy sources. Countries looking to lessen their dependence on volatile oil prices might accelerate investments in clean energy alternatives.
The future trajectory of the oil market remains uncertain. OPEC+'s decision to extend production cuts is a calculated move to navigate a complex economic climate. While it might benefit oil-producing nations in the short term, it could also have consequences for consumers and the global economic recovery. How this strategy unfolds and how the market reacts will be interesting to watch in the coming months.

Crude Monday Drab Bias and ForecastI am HTF bearish on Crude OiL
I have PD arrays marked out that should be respected if market was to retrace and take some BSL.
The targets for today are Lows marked out.
Pretty simple.
Stay bellow 1hr fvg and 1hr -OB = BEARISH
Close above the 1hr FVG start looking for short term BSL

USOIL - NEW BREAKOUT !
After a huge bearish move (double top pattern)
The USOIL reached the support level (77.98 - 76.82) and failed to break it!
The price formed a rectangle pattern.
Currently, The resistance level and line are broken.
So, I expect a bullish move📈
----------------
TARGET: 83.20🎯

CRUDE OIL (WTI): Is That a Bull Trap?!
Crude Oil may drop after a potential bullish trap:
we see a bullish inducement and a violation of a key horizontal resistance,
followed by a strong bearish imbalance.
I think that the market may drop at least to 78.8 level.
❤️Please, support my work with like, thank you!❤️

WTI OIL Bullish Divergence aiming higher.WTI Oil (USOIL) has been consolidating within the 1D MA200 (orange trend-line) and the 1W MA200 (red trend-line) for a full month. We have previously seen the same king of consolidation in mid-2023 and then November 2023 - January 2024. On both occasions, the price then entered a medium-term Channel Up.
Also on all occasions, the 1D RSI was on Higher Lows, while the price has been on Lower Lows, which is an indication of a Bullish Divergence. It is the exact same formation that Oil is currently on. As a result, we turn bullish on Crude for the medium-term, targeting $84.00 (just above the 0.618 Fibonacci retracement level and on the Lower Highs trend-line).
-------------------------------------------------------------------------------
** Please LIKE 👍, FOLLOW ✅, SHARE 🙌 and COMMENT ✍ if you enjoy this idea! Also share your ideas and charts in the comments section below! This is best way to keep it relevant, support us, keep the content here free and allow the idea to reach as many people as possible. **
-------------------------------------------------------------------------------
💸💸💸💸💸💸
👇 👇 👇 👇 👇 👇

Friday retracement?? Forecasting.I am looking at crude to make a retracement today after couple days of down movement its been nice but can;t last forever.
So the arrows display where I think price will go today as a first target and second PDL
Keep it real simple on Fridays you got the weekend coming and you don't want to go into it with a loss or a win stay neutral.

Crude Wednesday Pre NewsSo this is the forecast for Crude pre 1030est news.
I'm favouring some BSL to be taken if the 1hr FVG gets disrespected.
With 1hr fvg above and the BSL that is pointed out with the arrows.
If we show rejection from the 1hfvg we are currently near then PDL will be the target.
With news there is no certainty.
Overall I am HTF bearish however a sweep on BSL could be on the cards today.

Crude oil analysis
Crude oil prices are struggling as investors weigh recent hawkish comments from the Federal Reserve despite cooling U.S. consumer inflation data last week. Fed Vice Chairman Michael Barr said on Monday that the Fed is in a good position to keep policy steady and focus on the economy.
Cleveland Fed President Loretta Mester said she no longer believes three rate cuts in 2024 are appropriate. She stressed that inflation risks are skewed to the upside and given the strength of the economy, there is no harm in taking more time to collect inflation data.
The probability of a 25 basis point rate cut by the Federal Reserve in September fell slightly to 60% from 65% on Monday, according to the CME FedWatch tool.
In Canada, the expanded Trans Mountain pipeline (TMX) began commercial operations this month, overcoming years of regulatory delays and construction setbacks. The expansion will transport an additional 590,000 barrels per day from Alberta to Canada's Pacific Coast.
Investors are now turning their attention to supply from OPEC and its affiliates (OPEC+). They are scheduled to meet on June 1 to set output policy, which will include a decision on whether to extend voluntary production cuts of 2.2 million barrels per day by some members.

WTI OIL Strong rejection on 1D MA200 but be aware of a break-outWTI Oil (USOIL) made yesterday a strong rejection on the 1D MA200 (orange trend-line), which has been essentially the Resistance since the price broke below it on May 01. Having this level as a Resistance for 3 weeks makes it the strongest sell entry candidate, considering also the fact that this is the top of the 1-month Channel Down, thus a new Lower High.
As long as we don't close a 1D candle below the 1D MA200, we will be bearish, targeting 74.00 (-7.75% decline, similar to both previous Bearish Legs of the Channel Down). If we do close a 1D candle above the 1D MA200, we will take the small loss and target 83.00 (the 2.0 Fibonacci extension). The reason for being prepared for a long position as well, is because the 1D MACD formed a Bullish Cross.
-------------------------------------------------------------------------------
** Please LIKE 👍, FOLLOW ✅, SHARE 🙌 and COMMENT ✍ if you enjoy this idea! Also share your ideas and charts in the comments section below! This is best way to keep it relevant, support us, keep the content here free and allow the idea to reach as many people as possible. **
-------------------------------------------------------------------------------
💸💸💸💸💸💸
👇 👇 👇 👇 👇 👇
