WTI Crude Oil Stalls At Technical JunctureCrude oil has enjoyed a decent rally in recent weeks thanks to improved sentiment and OPEC+ scaling back production. Yet momentum turned against bulls on Tuesday, despite positive trade talks between the US and China. Today I discuss whether this could be a turning point for oil, or simply a bump in the road.
Matt Simpson, Market Analyst at City Index and Forex.com
Oiltrading

WTI CRUDE OIL: Channel Down needing to fill its top. Bullish.WTI Crude Oil turned bullish on its 1D technical outlook (RSI = 62.137, MACD = 0.740, ADX = 26.844), having completed a very strong 1W candle last week. This is the continuation of the May 5th bottom rebound. All prior such rebounds have filled at least the 1W MA50, having touched the 0.618 Fibonacci retracement level. The 1W RSI LH trendline gives a good sense of where to sell, but since the 0.618 Fib is the guide, the target is TP = 71.15.
## If you like our free content follow our profile to get more daily ideas. ##
## Comments and likes are greatly appreciated. ##

Crude oil-----Sell near 64.00, target 63.00-62.00Crude oil market analysis:
Crude oil is still bearish, and we will continue to sell on rebounds. If it does not break 65.00, it will fluctuate. The general trend is bearish. If it breaks, we will adjust our thinking. Today's crude oil is the key. Will it start to take off before the data? The previous crude oil inventory data did not allow crude oil to break the position. The crude oil fluctuation range is 60.00-65.00. If it breaks this range, we will adjust our thinking on fluctuations.
Operational suggestions
Crude oil-----Sell near 64.00, target 63.00-62.00

USOIL:Go short first today
USOIL: Crude oil downward momentum gradually stronger, the day's trend is weak, trading ideas first short.
Trading Strategy:
SELL@63.3-63.5
TP: 62.5-62.3
↓↓↓ More detailed strategies and trading will be notified here ↗↗↗
↓↓↓ Keep updated, come to "get" ↗↗↗

Crude oil----sell near 64.00, target 63.00-60.00Crude oil market analysis:
Yesterday's crude oil still failed to rise. The buying price still failed to stand above 65.00 and was still fluctuating. Today, we continue to look at the range wave. We still consider selling it when it is close to 64. The crude oil inventory data does not give us much room for imagination. In addition, the recent fundamentals of crude oil are not strong, and they do not support the long position of crude oil, which has caused crude oil to fluctuate and hover. The current fluctuation range we see is 65.00-60.00.
Operation suggestions:
Crude oil----sell near 64.00, target 63.00-60.00

USOIL:Go long
Crude oil prices rose due to ongoing tariff uncertainty as well as ongoing geopolitical tensions in the Middle East.
From the chart, the K line has repeatedly appeared long lower shadow small solid positive line, indicating that the lower buying long support is strong. Expected intraday crude oil short - term trend still exists a wave of upward space.
Trading Strategy:
BUY@62.5-62.6
TP: 63.5-64
↓↓↓ More detailed strategies and trading will be notified here ↗↗↗
↓↓↓ Keep updated, come to "get" ↗↗↗

Crude oil futures Trade the range In this video I look at the current range that we are in and I have laid out a plan in the scenario that we break that range to the upside and what we could possibly expect .
I have given some reaction zones where I anticipate price to react when we reach there .
I have used Fibonacci, volume profile, and vwap in this video .
Thankyou for your support

WTI CRUDE OIL: Repeated rejections on the 1D MA50.WTI Crude Oil is neutral on its 1D technical outlook (RSI = 46.483, MACD = -0.530, ADX = 16.270) as it is trading sideways for the past 2 weeks, unable however to cross above the 1D MA50, which along with the LH trendline, keep the trend bearish. Sell and aim for thr S1 level (TP = 56.00). Emerging Bearish Cross also on the 1D MACD.
## If you like our free content follow our profile to get more daily ideas. ##
## Comments and likes are greatly appreciated. ##

BRENT outlook: Watching for a move toward the upper boundary (D)Price is currently trading within a broad range, and the main expectation is a move toward the upper boundary — but confirmation is key.
I'm watching the high of the May 22 bar as a key level, since it holds the highest traded volume in recent days.
If price breaks and holds above 64.987 ,
🎯 First target: 67.791
🎯 Second target: 68.619

Oil Prices Up as Trump Delays EU Tariffs (Temporary Relief?) The global oil market, a sensitive barometer of economic health and geopolitical stability, registered a slight uptick in prices following the news that the Trump administration would extend the deadline for imposing new tariffs on a range of European Union goods. This minor rally, however, comes against a backdrop of a broader downtrend that has characterized the oil markets since mid-January. The persistent downward pressure has been largely attributed to the chilling effect of existing and threatened tariffs, not just between the US and the EU, but on a global scale, which have cast a long shadow over the outlook for global energy demand.
To understand the significance of this deadline extension and its nuanced impact on oil prices, it's crucial to first appreciate the environment in which it occurred. For several months, the dominant narrative surrounding oil has been one of demand-side anxiety. President Trump's "America First" trade policy, which has seen the imposition of sweeping tariffs on goods from various countries, most notably China, and the persistent threat of more to come against allies like the European Union, has injected a significant dose of uncertainty into the global economic system.
Tariffs, at their core, are taxes on imported goods. Their imposition typically leads to a cascade of negative economic consequences. Businesses that rely on imported components face higher input costs, which can either be absorbed, thereby reducing profit margins, or passed on to consumers in the form of higher prices. Higher consumer prices can dampen spending, a key driver of economic growth. Furthermore, the uncertainty created by an unpredictable trade policy environment often leads businesses to postpone investment decisions and hiring, further stagnating economic activity.
This economic slowdown, or even the fear of it, directly translates into weaker demand for oil. Manufacturing activity, a significant consumer of energy, tends to decline. Global shipping and freight, which rely heavily on bunker fuel and diesel, slow down as trade volumes shrink. Consumer demand for gasoline and jet fuel can also wane if economic hardship leads to reduced travel and leisure activities. The retaliatory measures often taken by targeted nations – imposing their own tariffs on US goods – only serve to exacerbate this negative feedback loop, creating a tit-for-tat escalation that further erodes business confidence and global trade flows.
It is this overarching concern about a tariff-induced global economic slowdown that has been weighing heavily on oil prices since the middle of January. Market participants, from large institutional investors to commodity traders, have been pricing in the potential for significantly reduced oil consumption in the months and years ahead if these trade disputes were to escalate or become entrenched. Every new tariff announcement or threat has typically sent ripples of concern through the market, often pushing oil prices lower.
Against this gloomy backdrop, the news of an extension to the tariff deadline on EU goods, while not a resolution, acts as a momentary pause button on further immediate escalation. It offers a temporary reprieve, a brief window where the worst-case scenario of new, damaging tariffs being instantly applied is averted. This is likely why oil prices "edged higher."
The market's reaction can be interpreted in several ways. Firstly, it reflects a slight easing of immediate downside risk to the European economy. The EU is a massive economic bloc and a significant consumer of oil. The imposition of new US tariffs on key European goods, such as automobiles or luxury products, would undoubtedly have a detrimental impact on European industries, potentially tipping already fragile economies closer to recession. An extension of the deadline pushes this immediate threat further down the road, offering a sliver of hope that a negotiated solution might yet be found, or at least that the economic pain is deferred. This deferral, however slight, can lead to a marginal upward revision of short-term oil demand expectations from the region.
Secondly, the extension can be seen as a signal, however faint, that dialogue and negotiation are still possible. In the fraught world of international trade diplomacy, any indication that parties are willing to continue talking rather than immediately resorting to punitive measures can be interpreted positively by markets. It reduces, fractionally, the "uncertainty premium" that has been built into asset prices, including oil.
However, it is crucial to temper any optimism. The fact that oil only "edged higher" rather than surged indicates the market's deep-seated caution. An extension is not a cancellation. The underlying threat of tariffs remains very much on the table. The fundamental disagreements that led to the tariff threats in the first place have not been resolved. Therefore, while the immediate pressure point has been alleviated, the chronic condition of trade uncertainty persists.
The oil market is acutely aware that this extension could simply be a tactical move, buying time for political reasons without altering the fundamental trajectory of trade policy. If, at the end of the extended period, no agreement is reached and tariffs are indeed imposed, the negative impact on oil demand expectations would likely resurface with renewed force. The market is therefore likely to adopt a "wait and see" approach, with traders hesitant to make significant bullish bets based solely on a deadline postponement.
Furthermore, the US-EU trade dynamic is just one piece of a larger global puzzle. The ongoing trade tensions with China, for instance, continue to be a major drag on global growth projections and, by extension, oil demand. Progress, or lack thereof, on that front often has a more substantial impact on oil prices than developments in the US-EU relationship, given the sheer scale of US-China trade and China's role as the world's largest oil importer.
The slight rise in oil prices also needs to be seen in the context of other market-moving factors. Supply-side dynamics, such as OPEC+ production decisions, geopolitical events in major oil-producing regions like the Middle East, and fluctuations in US shale output, constantly interact with demand-side sentiment. A deadline extension on EU tariffs might provide a small boost, but it can be easily overshadowed by a surprise inventory build, an unexpected increase in OPEC production, or signs of weakening economic data from other major economies.
In conclusion, the decision by the Trump administration to extend the tariff deadline on EU goods offered a moment of temporary relief to an oil market that has been under duress from trade war anxieties. This relief manifested as a marginal increase in oil prices, reflecting a slight reduction in immediate perceived risk to global economic activity and oil demand, particularly from Europe. However, this should not be mistaken for a fundamental shift in market sentiment or a resolution to the underlying trade disputes. The threat of tariffs remains, and the broader concerns about a global economic slowdown fueled by protectionist policies continue to loom large. The oil market's cautious reaction underscores the prevailing uncertainty, suggesting that while this extension provides a brief breathing space, the path ahead for oil prices will continue to be heavily influenced by the unpredictable currents of international trade policy.

USOIL:Long at 61.3-61.5
Last week's long target has been completed, the current decline is mainly due to concerns that global supply growth may exceed demand growth, from the technical trend, the objective trend of the middle line downward, short term long and short frequently alternate, pay attention to the support point of 60.3-60.5 within the day. Considering that it has been around this point of shock and not broken, short - term trading to do more.
So the trading strategy :BUY@61.3-61.5 TP@62.5-62.7
↓↓↓ More detailed strategies and trading will be notified here →→→
↓↓↓ Keep updated, come to "get" →→→

USOIL:Go long first
Crude oil short-term trend to maintain weak shock upward rhythm, K line closed long lower shadow line, there are signs of rebound. Short - term moving average system gradually long arrangement, relying on oil prices, short - term objective trend direction to upward. It is expected that the intraday trend of crude oil will continue to extend upward, hitting around 62.8-63
Recommended Trading Strategies:
61-61.2 range to be long, short-term target to see 62, break through the target to see 62.8-63
↓↓↓ The detailed strategy club will have tips, updated daily, come and get them →→→

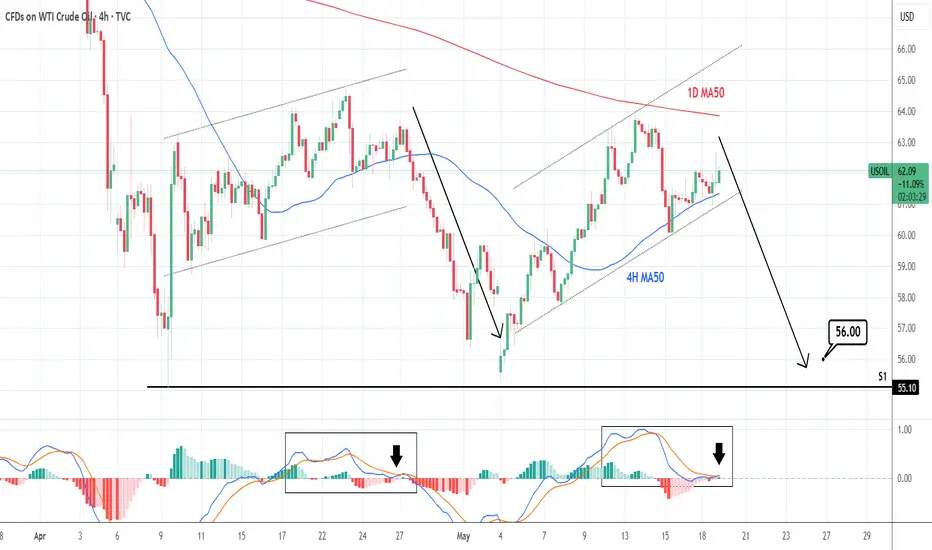
WTI CRUDE OIL: Mirror pattern calls for a sell.WTI Crude Oil is neutral on its 1D technical outlook (RSI = 50.222, MACD = -0.370, ADX = 25.154) as the price is just under the 1D MA50, where it got rejected last Tuesday. In the meantime, it has the support of the 4H MA50, hence stuck inside a neutral range. This pattern is however identical to April, after which the price declined aggressively to the S1 level. Sell, TP = 56.00.
See how our prior idea has worked out:
## If you like our free content follow our profile to get more daily ideas. ##
## Comments and likes are greatly appreciated. ##
TP REACHED ON USOILEarlier I posted to buy on USOIL, now the price reached our target to leave us with he first profitable trade of the day!
Follow for more!

BUY USOILBeen a while since I last posted about American Market,
I'm sharing with you a trade I caught on OIl that you still can take with the same SL and TP as mine.
Follow for more!

Bullish bounce off overlap support?WTI Oil (XTI/USD) is falling towards the pivot and could bounce to the 1st resistance, which is a pullback resistance.
Pivot: 59.97
1st Support: 57.60
1st Resistance: 63.27
Risk Warning:
Trading Forex and CFDs carries a high level of risk to your capital and you should only trade with money you can afford to lose. Trading Forex and CFDs may not be suitable for all investors, so please ensure that you fully understand the risks involved and seek independent advice if necessary.
Disclaimer:
The above opinions given constitute general market commentary, and do not constitute the opinion or advice of IC Markets or any form of personal or investment advice.
Any opinions, news, research, analyses, prices, other information, or links to third-party sites contained on this website are provided on an "as-is" basis, are intended only to be informative, is not an advice nor a recommendation, nor research, or a record of our trading prices, or an offer of, or solicitation for a transaction in any financial instrument and thus should not be treated as such. The information provided does not involve any specific investment objectives, financial situation and needs of any specific person who may receive it. Please be aware, that past performance is not a reliable indicator of future performance and/or results. Past Performance or Forward-looking scenarios based upon the reasonable beliefs of the third-party provider are not a guarantee of future performance. Actual results may differ materially from those anticipated in forward-looking or past performance statements. IC Markets makes no representation or warranty and assumes no liability as to the accuracy or completeness of the information provided, nor any loss arising from any investment based on a recommendation, forecast or any information supplied by any third-party.

Crude oil------sell near 65.00, target 63.00-62.00Crude oil market analysis:
Gold has been moving recently, and crude oil has also moved with it. Yesterday's crude oil daily line closed with a big positive, and is currently testing the big pass near 65.00 on the weekly line. If this position is broken, we will be bullish on the long-term trend of crude oil. Today's crude oil idea is to rebound in the short term, and the general trend is bearish. Consider selling when it approaches 65.00 for the first time. 61.30 is the buying and receiving position. Pay attention to the inventory changes of crude oil later.
Operational suggestions:
Crude oil------sell near 65.00, target 63.00-62.00

USOIL UPDATEHello friends
Given the recent growth in oil prices, it is natural for the price to correct. Now we have obtained the most important price support areas for you and we have also specified the target. If you are willing to enter the transaction, be sure to observe capital management.
*Trade safely with us*

XTIUSD Crude oil Raid Plan: Snag Profits Before the ATR Trap!🌍 Greetings, Wealth Warriors! Salut! Ciao! Salaam! 🌟
Fellow Profit Pirates, 🤑💰🚀
Crafted with 🔥Bandit Blueprint analysis🔥 (technical + fundamental), here’s our cunning scheme to raid the "XTIUSD / WTI Oil" Energy Market. Follow the charted course for a long entry, aiming to slip away near the high-stakes ATR Zone. Watch out—overbought signals, consolidation, or a trend flip could trap the unwary where bearish bandits lurk! 🏴☠️💸 "Cash out and celebrate, traders—you’ve earned it! 🎉💪"
**Entry 📈**: "The vault’s open! Await the MA breakout (64.00), then strike—bullish riches await!"
Pro tip: Set buy stop orders above the Moving Average or place buy limit orders at the latest 15/30-min swing low/high for pullback entries.
📢 Set a chart "alert" to catch the breakout moment!
**Stop Loss 🛑**: "📣 Heads up, crew! 🗣️ For buy stop orders, hold off on placing that stop loss until the breakout sparks 🚀. Stick to my marked spot 📍 or go rogue at your own peril 😎—it’s your gamble! ⚠️"
📍 Bandit SL set at the recent 3H swing low (60.00) for swing trades.
📍 Adjust SL based on your risk, lot size, and number of orders.
**Target 🎯**: 70.000 or bail out before the finish line.
🧲 **Scalpers, listen up** 👀: Stick to long-side scalps. Big bankrolls can dive in; smaller stacks, join the swing trade heist. Use trailing SL to shield your loot 💰.
💸 **US Oil Spot / WTI** Swing Trade Plan: Bullish vibes 🐂 are surging, fueled by key drivers. ☝
📰 **Dive Deeper**: Check Fundamentals, Macro Trends, COT Reports, Seasonal Patterns, Intermarket Insights, Inventory Data, and Future Targets 👉🔗
⚠️ **Trading Alert: News & Position Tips** 🗞️ 🚨
News drops can shake prices and volatility. To protect your haul:
- Skip new trades during news events.
- Use trailing stops to lock in gains.
💖 **Fuel our heist!** 💥Tap the Boost Button💥 to power up our profit raid. Join the Bandit Trading Crew, snatching wins daily with ease! 🏆🤝🎉
Stay sharp for the next caper—see you soon! 🤑🐱👤🚀
---
Real-Time Data (UTC+1, May 14, 2025) 📊
**WTI Oil (XTIUSD)**:
- **Price**: ~$63.80 (based on latest market data)
- **MA Breakout Level**: ~$64.00 (as per strategy)
- **Stop Loss Level**: ~$60.00 (3H swing low)
- **Target**: $70.00
- **Market Sentiment**: Bullish 🐂, driven by inventory draws and geopolitical factors (per recent analysis).
**Latest COT Data (Friday, May 9, 2025)**:
- **Commercial Hedgers**: Increased net long positions in WTI futures, signaling bullish bias.
- **Large Speculators**: Moderately net long, cautious due to overbought risks.
- **Data Source**: CFTC (official Commitment of Traders report).
**Key Fundamental Drivers**:
- **Inventory**: EIA reported a -2.5M barrel draw last week, supporting bullish momentum.
- **Geopolitical**: Middle East tensions continue to prop up oil prices.
- **Seasonal**: Summer demand expectations rising.
🔔 **Note**: Monitor upcoming EIA inventory data (Wednesday, May 14, 2025) for volatility.
---
💥 Boost this plan and let’s plunder the markets together! 🚀

US-Oil will further push upside After Testing TrendlineHello Traders
In This Chart XTIUSD HOURLY Forex Forecast By FOREX PLANET
today XTIUSD analysis 👆
🟢This Chart includes_ (XTIUSD market update)
🟢What is The Next Opportunity on XTIUSD Market
🟢how to Enter to the Valid Entry With Assurance Profit
This CHART is For Trader's that Want to Improve Their Technical Analysis Skills and Their Trading By Understanding How To Analyze The Market Using Multiple Timeframes and Understanding The Bigger Picture on the Charts

WTI CRUDE OIL: Short term rebound on RSI Bullish DivergenceWTI Crude Oil is bearish on its 1D technical outlook (RSI = 38.958, MACD = -2.110, ADX = 28.985) as it remains on a multi-month Low. The 1D RSI however displays a HL Bullish Divergence and this can cause a short term price rebound. The Resistance is the Pivot Zone and short term the LH trendline is what maintains the downtrend. Consequently, we are now bullish, TP = 64.90.
## If you like our free content follow our profile to get more daily ideas. ##
## Comments and likes are greatly appreciated. ##

Oil - Short Term Sell Trade Update!!!Hi Traders, on April 17th I shared this idea "Oil - Looking To Sell Pullbacks In The Short Term"
I expected to see bearish continuation until the two Fibonacci resistance zones hold. You can read the full post using the link above.
Price moved lower as per the plan here!!!
Price respected the first Fibonacci resistance zone, created a false break of it and moved lower as expected!!!
If you enjoy this idea, don’t forget to LIKE 👍, FOLLOW ✅, SHARE 🙌, and COMMENT ✍! Drop your thoughts and charts below to keep the discussion going. Your support helps keep this content free and reach more people! 🚀
-------------------------------------------------------------------------------------------------------------------
Disclosure: I am part of Trade Nation's Influencer program and receive a monthly fee for using their TradingView charts in my analysis.

Price OIL will continue falling ?!According to Global Channel
According to minor channel
According to Flag Pattern
According to CCI under zero
According to Breakout Support Level @ 66 USD.
