Oil prices have stopped falling, and the bulls are back?Crude oil was suppressed by fundamentals and high pressure. Yesterday, the daily line fell all the way, and finally the daily line closed the negative line. Crude oil currently continues to maintain a wide range of oscillations on the daily line. The 4-hour level trend is also after a continuous decline. The current deviation rate is slightly too large, and the technical patterns on the small-cycle trend are also beginning to be gradually repaired, and there is a high probability that there will be some room for rebound and repair in the short-term trend.On the news side, short-term attention will be paid to Powell's further remarks and EIA data within the day.
Operationally, crude oil is recommended to be short at 78.3, below the target of 76.6.
In order to facilitate you to continue to follow up on my analysis and sharing, you can like and follow me. In addition, you can enter my channel for free in the following ways to follow real-time views and operational strategies.
TVC:USOIL TVC:GOLD FOREXCOM:XAUUSD
Oiltrading

$CL_F: Time to buy oil...I'm already long via a number of energy stocks I have been buying recently but now Oil futures are finally onboard. I was thinking that inflation remaining stickier was proof of post COVID lock downs induced supply disruptions being still a factor, and now that we have China reopening and an increase in demand of 'atoms' thanks to the transition to renewable energy and electric vehicles, combined with the long term dynamics of nearshoring/onshoring/friendshoring, I think oil and oil stocks, biofuel producers, coal, refineries, etc. offer nice upside. Think that India and Mexico will require larger amounts of energy for the wave of industrial activity that will be unleashed there once Western firms move their production to ally nations rather than relying on China, while China reopens and activity resuming unleashes pent up demand on the same finite resources. It's an interesting juncture, and a recipe for potentially explosive upside in certain names.
Let's see how this goes, pick your poison, as far as instruments better suited to express this view in the long term...
Best of luck!
Cheers,
Ivan Labrie.

The morale of crude Oil bulls is strong, breakthrough!Fundamentals:
On Tuesday (March 7), international oil prices tended to fluctuate.Previously, the UAE's withdrawal from the Organization of Petroleum Exporting Countries was proved to be untrue, and there was a need for technical correction after the surge in oil prices.And cautious investors are waiting for Fed Chairman Powell's upcoming testimony later this week.However, signs of China's economic rebound have prompted Saudi Arabia to continue to increase its prices in Asia, bringing support to the oil market.
Technical aspects:
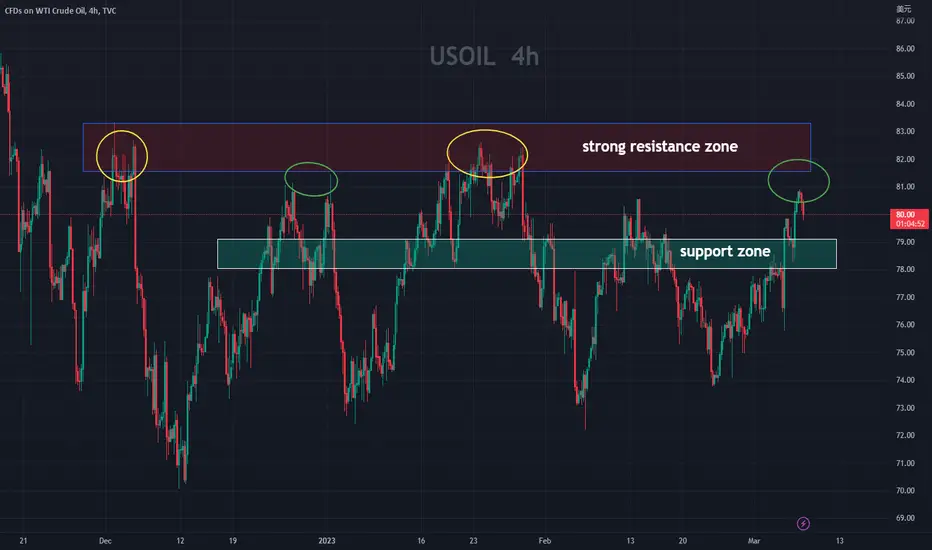
At the daily level, after oil prices have risen for five consecutive trading days, oil prices have initially stood above the 80 integer mark. The daily line has gotten rid of the downward trend channel, and the opening of the technical indicator Bollinger band continues upward. MACD golden fork, KD stochastic indicator golden fork, technical bullish signal continues, if it can withstand the short-term pullback pressure, it is expected to continue to oscillate higher, the initial resistance is near the Bollinger band rail 82; further strong resistance is near 83, which is where the top of the box that has oscillated extensively since the end of November is located. If it breaks further, it will increase the medium- and long-term bullish signal.
At the 4-hour level, oil prices as a whole are still in the channel of rebounding upward trend, but they are still suppressed by the short-term moving average, and the KD stochastic indicator sends a short-term overbought signal. It is still necessary to beware of the risk of short-term oil prices falling back.However, the short-term volatility here is still within the normal range, which is a technical repair to the short-term rally, and the 79 position of the 20-day moving average below has been transformed into a preliminary support position. If this position is lost, it can be judged to weaken the bullish signal in the future.
Taken together, today's short-term crude oil operation ideas are mainly based on stepping back and lower, supplemented by rebounding high altitude, which can be done at the 79 position and the target position is 80.5

Oil: Go long on this range.
After analyzing the 4-hour chart of crude oil, it is found that yesterday's market first fell and then rose, rebounding after reaching support near 78. In the short term, it has broken through resistance at 79 and 80 and now support has formed around 78 and 79. If there is a substantial breakthrough and stabilization around 81.5, there is a high probability of further rising towards the strong resistance level near 83. However, the market currently needs further consolidation and momentum to complete the potential breakthrough, so we recommend shorting at higher levels and going long at lower levels.
The specific recommendations are as follows:
short around 81-80, long around 79-78, with a stop loss of 70 points and a take profit of 200 points for each.
OIL IS LIKELY GOING TO SELLWhen examining this asset, there is evidence of an M-pattern formation occurring across weekly, 4-hour, and 1-hour time frames.
Although the right arm of the M-pattern has not yet begun on the weekly timeframe, it is about to commence on the 4-hour timeframe. There is also a clear formation of the right arm of the M-pattern taking place on the 1-hour timeframe.
Aggressive traders may opt to enter using the 1-hour timeframe, while conservative traders may prefer to use the 4-hour timeframe. Conservative and long-term holders may choose to ride with the weekly timeframe.
Ultimately, the choice of timeframe depends on individual trading style.
Follow for more tips, and share your thoughts by commenting, liking, and sharing.

OIL | WTI |Crude Oil | US OIL SPOT Trading IdeaOil Buy with 78.5 and Stop Loss Will be 77.9 TP 80-82
1. MA 100
2. Supply Area/ Demand Zone
3. 0.618 Fibbo
4. GAP
Best Regards,
Forex Pharmacy
Muhammad Raheel Khan

US Oil - Last downward leg- Pt.2- About to become impulsive?Hello traders,
in our previous posts about oil we highlighted how we expect cycle wave 2 to complete around the 57-63 area with the final C wave of the corrective structure.
We then showed how we applied leading indicators to obtain confirmation of more downside: .
We entered at the golden zone (61.8%fibo) strong volume rejection.
We are short from @78.18 aiming to ride the microcount outlined in the chart. Stop loss on entry as per the update in previous post.
Cheers
GMR

WTI Oil Uptrend Critical Levels, Elliot Wave Analysis for ProfitWTI oil has been on an upward trend for eight consecutive days, gaining as much as 5.50-6% since its lowest price. The current trend is expected to continue into next week, with recent sideways movement in a 1-hour time frame. The Elliot Wave Pattern shows impulse and correction visible on the chart. Traders should watch the critical levels of 78.70 for selling and 77.00 for buying.
Although the trend remains healthy, a breakdown may occur upon completion and retracement of the wave. It's important to remain vigilant and monitor the market closely. Another possible scenario is a continuation of another wave, but this seems unlikely due to stronger resistance at the 80.20 level. For more updates and analysis, follow my account and feel free to share your thoughts and ideas to make our trading journey more successful. By collaborating and sharing knowledge, we can all potentially profit from the opportunities in the market.

SELL CL1!Good morning traders !
As usual today I'm sharing with you my trade on CRUDE OIL, as you can see on the chart on thr 1st arrow there was a fake break out of the channel, now after getting a clear one we got in as sellers and after that the market moved I shared it with you as usual since I can't give it to public at the same time I give it to my clients.
SL and TP set them at your own risk
In case you got any question don't hesitate to ask !

USOIL : Master Of Washing Account's TVC:USOIL
Hi , Trader's .. I am keeping chart very simple for you to understand
Price touching Resistance 1 , If price failed to break R 1 than it can Fall to pivot point around 76$
Price needs to Retest Pivot again for any further bullish momentum
Pivot point Will play a vital role as a death cross for oil

USOUSD (Crude Oil) 3H: 22/02/2023: Bull or... ?
Main Idea:
You can see all the details on the chart.
Around 74$ (with low time frame confirmation) it can be a good area to buy.
If you have questions, feel free to ask.
💡Wait for the update!
🗓️22/02/2023
🔎 DYOR
💌It is my honor to share your comments with me💌

Recap of my trade for todayGood afternoon traders, our trade for today on CRUDE OIL was as good as expected, after breaking the channel we got in with one contract exactly on the candle I put the 1st arrow on on the left, then after having a configuration I can't share with the public we added another contract on the 2nd arrow on the left, then the 3rd contract on the 3rd arrow and finally closed after having a squeeze pattern.
In case you got any question don't hesitate to ask !

WTI OIL Rally is halfway there. Still a buy.WTI Crude Oil is now supported on the MA50 (4h).
The Channel Up that started on Support Zone (1) is similar to all previous 4 Channels that started on that level.
Price got rejected on the Mid level structure, indicating that we are only halfway there.
Trading Plan:
1. Buy on the current market price.
Targets:
1. 80.50 (under Resistance Zone 1).
Tips:
1. The Declining Resistance shows that since November, there have been 2 such Cycles and we are about to completed the 2nd.
2. MACD (4h) right over its neutral level, an additional factor indicating that the Channel Up is halfway there.
Please like, follow and comment!!
Notes:
This is an extension of this trading plan:

USOIL free signalas you can see here we have a good chance to take sell USOIL we have a good setup , good price action also the market now in a strong zone

OIL SELLWelcome . oil market. in a very negative state. With the price reaching strong support 77.50, and breaking the pattern. double bottom, there is a lot of pressure from sellers to downgrade the market. To 75 levels in the first stage. And level 74 good luck. Note: If you like this analysis, please give your opinion on it. in the comments. I will be glad to share ideas Thank you

WTI OILWTI Oil, a benchmark for crude oil prices, has been gradually rising recently, indicating an uptrend in the market. By analyzing the available charts, it is possible to identify entry points for traders to buy at the same time as identifying an exit point.
To further refine the strategy, traders can use different technical indicators to help them make informed decisions. One potential approach involves looking for a little pullback on the middle trendline, which can serve as a testing ground for a "BUY" signal.
Overall, this strategy can be effective for traders looking to capitalize on the current trend in the WTI Oil market. By carefully monitoring the charts and utilizing appropriate indicators, traders can identify optimal entry and exit points to maximize their profits.

Sasol Inv Cup and Handle just made it bearish to R221.11Inv Cup and Handle formed on Sasol.
The price broken below the brim level.
The gap was filled when the price went back up to close and form the right handle.
Then the supply side kicked back in dropping it further.
We also see bearish indicators.
200 > 21> 7 - Bearish
RSI<50 (Lower highs) - Bearish
Target R221.11
ABOUT
Sasol is a global energy and chemicals company based in South Africa. It was founded in 1950 and was originally named the South African Coal, Oil and Gas Corporation.
The company is primarily focused on the production of synthetic fuels, chemicals, and gas. Sasol is one of the world's leading producers of synthetic fuels.
Sasol operates in more than 30 countries around the world and employs approximately 30,000 people.
The company is listed on the Johannesburg Stock Exchange and the New York Stock Exchange.
Sasol is one of the largest producers of low-emission transportation fuels in the world, including synthetic diesel, jet fuel, and naphtha.
In addition to its energy and chemicals operations, Sasol is involved in a number of other businesses, including mining, power generation, and technology.

USOIL - CRUDE OIL BULLISH REVERSAL EXPECTED MOVEoil is about to retrace back to 76-78 zone be realistic and never enter before confirmation in LTF
I am not your investment advisor, enter at your own!


USOIL - CRUDE OIL Investment & Uses🛢⛽Hi Traders, Investors and Speculators of the Charts 📈📉
Oil gets a bad rap these days, but the stuff is actually quite incredible. Many people think of crude oil as a thick, black liquid that is used to source our unquenchable thirst for gasoline and suffocate marine life. Although this isn't untrue; the reality is that each barrel of oil is refined to be used in a variety of applications that includes fuel, cosmetics, plastics, rubber, and candle wax.
Recently I saw many news outlet's post on the price of crude oil at their economic section. the sentiment was the same - buy. The reasoning was that oil will become more scarce in coming weeks and therefore, the demand will increase. Unsurprisingly, the price of oil has gone DOWN. These are usually coordinated traps in the market, and it's best to counter trade when the media is going with one sentiment.
The price of oil is declining seriously, with strong bearish pressure at $82. We see a nasty double top in the weekly, and I'll be looking for an entry between the support zone pointed out on the chart.
So, why consider oil as an investment?
The truth is, oil isn't going anywhere, any time soon. This is a commodity with a broad use case, and if you plan your trades, low risk trades with good profits can be made.
Here is everything that can be made from just one barrel of oil: 🛢
🚗 Enough gasoline to drive a medium-sized car over 450km (280 miles)
🚛 Enough distillate fuel to drive a large truck for almost 65km (40 miles)
⛽Nearly 70 kWh of electricity at a power plant generated by residual fuel
💥 About 1.8 kg (4 lbs) of charcoal briquettes
🏕 Enough propane to fill 12 small (14.1 ounce) cylinders for home, camping or workshop use
🚧 Asphalt to make about 3.8 L (one gallon) of tar for patching roofs or streets
⚙ Lubricants to make about a 0.95 L (one quart) of motor oil
🎂 Wax for 170 birthday candles or 27 wax crayons
But that’s not all. After producing all of the above products, there’s also enough petrochemicals leftover to be used as a base for one of the following:
👩👧👦 39 polyester shirts
👩🦰 750 pocket combs
😁 540 toothbrushes
🧺 65 plastic dustpans
⭕ 23 hula hoops
🧃 65 plastic drinking cups
🥛 195 one-cup measuring cups
☎ 11 plastic telephone housings
🥎 135 four-inch rubber balls
The above serves as one example of how a single barrel could be used, but here’s a list of many other oil applications. It includes everything from guitar strings to antihistamines. Whatever your opinion is on fossil fuels, it’s still pretty astonishing what can be produced out of each barrel of oil.
Here's a nice infographic to visualize :
_______________________
📢Follow us here on TradingView for daily updates and trade ideas on crypto , stocks and commodities 💎Hit like & Follow 👍
We thank you for your support !
CryptoCheck

Oil buyPeace be upon you, there is a high probability of oil rising with the formation of the descending channel. Now he is correcting the golden ratio of Fibonacci 61%. We have two very positive candles in the four-hour time frame

Oil and Gold analysis for NYYou can skip through the oil as the sound did not come out or watch it as it is self-explanatory with the drawings and the following side notes:
''Bullish above 79.30 alarm set. alarm set 78.67. hard to form a directional bias on this one...BIS in London's sell-off, but D1 longs still in control from LoD (higher low) and could turn out to be an FGD, first Green Day/ bullish close, to trigger a bull rally on Friday in line with daily chart bullish bias. On the other hand, it has a broken structure in London and there is resistance 70.20/50 so we could come down into D1 longs for low-hanging fruit below LoD set in London/NY gap time to target 78 and 77.50. Can't figure out a bias for the day until we see D1 and D2 bulls committing to 78.50s retests in NY.''
As for Gold, we need to break through a lot of BS and volume to go lower...

Oil buyPeace be upon you. How are you? There is a high probability of oil rising with the formation of the ascending channel and the re-testing of the trand. What do you think my friends
