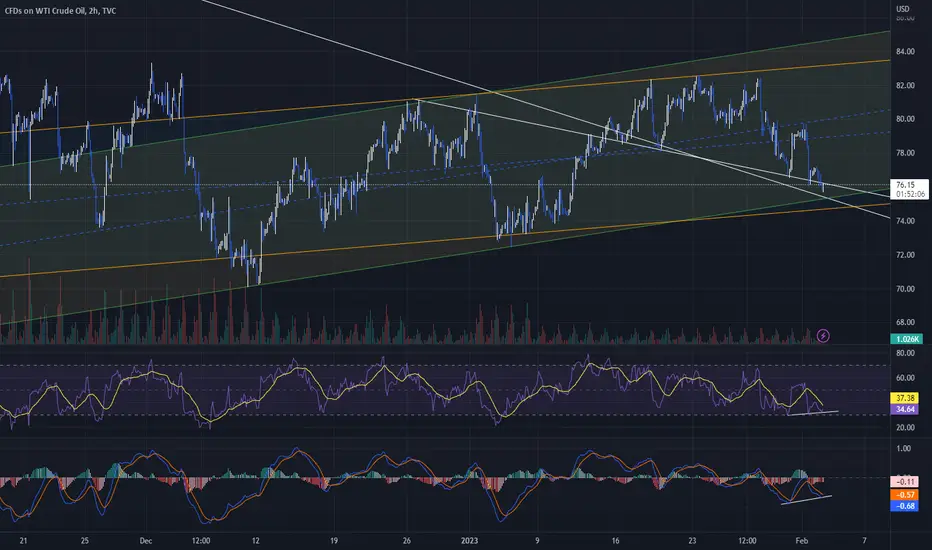
WTI analysisOil buyers are strong and due to hitting the ceiling of the channel, we don't see a heavy drop and it is a sign for more growth
As long as it is above the box, it is an upward trend
Oiltrading

ERF pivot right above the 20 day ERF pivot right above the 20 day. Price and volume contraction mving into the pivot area.

Will oil rise again?An excellent area for oil support, which gives us a very good position with the break of the downward trend line and Gulback
Also, please note that the analysis is done on a weekly basis
⚠️ This Analysis will be updated ...
👤 Banipal : @hosseinbakrani
📅 02.12.2023
⚠️(DYOR)
❤️ If you apperciate my work , Please like and comment , It Keeps me motivated to do better ❤️

Crude oil analysisMy bias about the chart is LONG but i have mentioned both plans long or short depending on the movement of it.

Oil Failing at Key AreaOil failing to breakout higher here, suggests that we are likely heading much lower.

WTI OIL: This uptrend has more fuel.As WTI Oil hit technical neutrality on the 1D time-frame (RSI = 51.471, MACD = -0.510, ADX = 37.488), it reached Pivot1 (P1) and the 4H MA200 to pause and consolidate. As with the previous two rallies, we expect this to have some more fuel left and we are aiming at the 1D MA100 (TP = 80.50) that rejected the last uptrend 3 times.
After that, our sell trigger is a break below P1, and we will aim at the top of S1 (TP = 73.50). We are not waiting for the extension to R1 but rather will wait for the HH to break (bullish trigger) and aim below R2 (TP = 87.00).
P.S. Perfect execution of our last Oil signal:
## If you like our free content follow our profile to get more daily ideas. ##
## Comments and likes are greatly appreciated. ##

Oil's long term re-test before upcoming rally? 13.2.2023Simple 1+1 equals 2.
There's a couple factors here.
1) Long-term support since March 2023 kept with multiple re-tests.
2) Long-term 8 month wedge consolidation with recent Jan 2023 breakout up together with RETEST of that breakout at 74.80-75.20 as of today.
If the week closes above this support, VERY high chance for continuation of breakout up and 80's-90's even 100 to be reached within coming weeks.
If the support of 74.80-75.20 breaks down, retest of long-term March 2021 to today support trend-line is possible at 71.40-60.
-------------------------------------------------------------------------------------------------------------------
I encourage to do your own research and trade with caution
Thank you for reading and would very much appreciate your comments and questions!
------------------------------------------------------------------------------------------------------------------

CL1 on its way up $CL1! is rocking today right now its sitting at the 61.80% fib level on the 4hr chart im looking for a push up to retest my zone karound $80.00

USOIL is bleeding into support!Oil appears to be selling into some key parallel channels and also forming bullish divergences. With China reopening on the horizon and the SPR at record lows I believe we should be bullish on oil. This is a medium term opinion, yet this trade could offer up a nice midterm set up as we are getting higher highs and higher lows.
CRUDE OIL - US OIL - SELL RIGHT NOW INTRADAY TRADEi am not your investment advisor, so its just my analysis on SPX and always go with the flow and never enter without confirmation.
Always use stop loss and always follow the trend as trend is your freind.
Consistency and patence is the key to success!
US OIL CRUDE OIL SELL TRADE

OIL BUY POSITIONCRUDE OIL: as you can see it broke out from a trendline and came back to grab some liquidity. this is why it's good to have patience in the market.
we can also spot a double bottom which signifies an up trend.
TIPS
1: always wait for a for a retest when a trendline is broken
2: always map out zones in every trendline breakout as I did so.
3: also it is advisable to do top down approach before entering any trade

Brent showing a further plummet to $67.89 Rising Flag has formed after the downtrend with Brent.
The price has broken below the rising flag which confirms bearishness.
200 > 21 > 7 - Bearish
RSI <50
Target $67.89
FUNDAMENTALS:
We've seen the US Dollar start to strengthen a bit which is can continue to do so for the next few weeks.
A strengthening US dollar can cause Brent crude price to drop because oil is priced in dollars. When the value of the dollar increases relative to other currencies, it makes oil more expensive for buyers using those currencies, which can result in decreased demand and lower prices. Additionally, a strong dollar can also make it more attractive for investors to sell commodities, including oil, in exchange for the higher-valued currency, putting downward pressure on prices.

Leading Indicators To Improve Decision Making in Oil TradingHello Traders!
As you know, trading is a game of probabilities and navigating the financial markets is not always easy.
Different strategies that we use, such as Elliott wave analysis and pattern trading, can provide different scenarios for market movements.
However, market conditions are often uncertain and can extend beyond what is predicted by these strategies. In such cases, it is useful to have access to scientifically proven tools that can help us better assess the probabilities of different scenarios. One such tool is the use of leading indicators.
In this educational idea, we will explore the use of a leading indicator for Wti prices that embodies information from futures term spread and Relative Inventories.
Correlation with Relative Inventories is due to the basic supply and demand dynamics of the market. When inventories are high, there is an oversupply of oil which puts downward pressure on prices. Conversely, when inventories are low, there is a shortage of oil which puts upward pressure on prices.
Another useful metric for predicting oil prices is the term spread. The term spread refers to the difference between the prices of two oil contracts with different delivery dates. Researchers have found that changes in the term spread can be a leading indicator of future prices. The relationship between the term spread and oil prices comes from the fact that the term spread reflects changes in market expectations about future supply and demand for oil.
Studies have confirmed the predictive power of both relative inventories and the term spread. Starting in a seminar paper by Hamilton (1983), it was demonstrated that changes in inventories had a significant impact on future oil prices. Similarly, other research has shown that changes in the term spread have a strong correlation with future oil price movements (e.g., Kilian and Murphy, 2009), and now there are a vastity of academic paper that explores that correlations and the predictive possibilities.
Here another couple of references:
www.sciencedirect.com
gupea.ub.gu.se
Now, I want to bring you an example of how these empirical result can be exploited and used in trading.
In the main chart indeed I show an indicator constructed to reproduce the forecasting model proposed in the last article that I linked (Larsson, 2018).
This Forecasting Model is a time series ARIMA model that uses both relative inventories and term spread between 3-months ahead contract and the 40-months ahead contract, together with squared relative inventories to capture non linearities in the relation between inventories and wti price.
You can see the forecasted model in the red line, while the blue line is the weekly oil closing price.
I will report again here the chart for clarity:
After the uptrend ended, in which the forecasting model overshooted before crossing back, we can see that every time the red line (forecasting model) retested the blue line (actual price) the retest was followed by a strong decrease in price.
This was use for us as confirmation for our bearish scenario on oil, that we are still trading.
I hope you can find this post useful!
If you have any comment, please share, we will be happy!
Cheers, GMR

US OIL Break DownWhat's your current take on US Oil. This market seems to have really peaked my interest and I believe most of my profits this year will come from oil.
Just a quick breakdown of what I see potentially happening for oil.

USOUSD (Crude Oil) Daily: 06/02/2023: Does it fall more?
Main idea:
According to the weekly analysis, we expect a bear market.
In this case, there is a liquidity pool below 72.42 that can be defined as a first target. There is good support at 72.05, if the price can break this support, the price can fall to 67.5.
After collecting liquidity under 72.42, the price may have a short-term upward move. We can define 74.83- 75.7 as a supply zone that can push the price down.
💡Wait for the update!
🗓️06/02/2023
🔎 DYOR
💌It is my honor to share your comments with me💌

USOUSD (Crude Oil): 06/02/2023: Key levels of weekly chart
Well here is our long-term view of crude oil.
As you can see, the price is in the downtrend and we expect a continuation of a bear market.
Bear scenario: In this scenario, we have 66.13- 69.544 as a key zone. The price should break down this zone and stay below. For this goal, the price can move upward till around 75 and then start the main decrease.
Bull scenario: Although I see the market in a downtrend, I believe we should be ready for both sides of the market. In this scenario, there is a liquidity pool below 70.22 and exactly after that, we have an important demand zone of 66.13- 69.544. If this zone work, the price can rise to 78.18 as the first target after that goes higher than 82.37, and 87.83 is our last target.
💡Wait for the update!
🗓️06/02/2023
🔎 DYOR
💌It is my honor to share your comments with me💌


OIL BUYA golden opportunity in the oil market with a positive candle and an upward channel with a strong upward correction. Please do not miss the opportunity and thank you dear traders 💷💵🥲♥️

💡 Don't miss the great Buy opportunity in USOIL (WTI)Hi dears
We are in a very good support zone to buy. I think that oil has the potential to grow up to 100 dollars. The first target I set for it is $87, and after crossing this target, I entered a buy position for $100.
What do you think? I will be happy to tell you your opinion

Sell CL1 Crude OiL Now With high probability !Sell CL1 Crude OiL Now With high probability
The price in Crude Oil Will visite Other KEy Levels .
Tp1 is The first Take profit than You can Do Breakeven.

GTE The breakdown of the diagonal is likely a HTF Primary W1 into W2 because it's on the monthly. Typically a leading diagonal is a bearish precursor to a reversal.
Also leading diagonals most likely form a wave 1 into w2 set ups.
The 786% might be too optimistic, as the wave 1 was 5 up which means sub wave A which equals the 5 up diagonal which equals the HTF w1 is a HTF Zig Zag & Zig Zags can bounce off the 50%-618%.
But the underlying nature of W2 is to destroy any hope of the wave 3.
So rather the 786% is usually a trademark of the wave 2.
Basically a lot of conflicting forces at play here as to where the bottom forms.
But catching this dip for a LT play seems very smart as W3 is targeting $16-$18 & Wave 5 $200 plus.

WTI: Safety net 🧗Although the Oil might need a little persuasion, we're expecting the course to drop below the support line at $70.08 to continue with the downwards slope of the blue wave within the green target zone. Once completed, the blue wave should pump the course back up, before it ultimately hits the corrective low of the green wave .

Crude Oil at Various Support Levels As you can see Crude is currently positioned on a 4/5 year support level which was first tested in May 2018.
As well as that it has reached the breakout point of the descending triangle and has perfectly placed itself on the 0.786 fib retracement level.
All of these indicate a bullish reversal in my opinion, however I wouldn't be surprised to see a bounce before those levels are broken to get rid of weak hands.
Let me know what you think!
