OKBUSDT Death Cross can be bullish? The full picture.The OKB token (OKBUSDT) is the Global Utility Token that was launched by the OK Blockchain Foundation and OKX exchange in 2017, to serve as a bridge to connect OKX and its users. On this post, we will analyze how current pattern may be bullish short-term against popular belief and how it may play out on the long-term.
** Technical Analysis **
The most important development at the moment is the formation of the Death Cross on the 1D time-frame. That is when the 1D MA50 (blue trend-line) crosses below the 1D MA200 (orange trend-line), which is technically a bearish formation. However as you see on this chart, which displays OKB's price action since May 2021, all past three Death Crosses have been formed on or straight after market bottoms. Especially in the cases of July 03 2021 and October 15 2021, OKB rose significantly following the Death Cross. See also how similar their 1D RSI sequences look like.
A potential rise short-term, is still limited to the Resistance force set by the Lower Highs trend-line that started on the May 03 2021 market Top. This is where the price got rejected on December 17 2021 and more recently August 14 2022. Technically only a break above this trend-line can be considered as a long-term break-out signal, we us preferably looking for a closing above the 0.382 Fibonacci retracement level, in order to call for a potential bullish reversal.
Until then, the OKB token can continue trading within that long-term Triangle pattern designated by the May 2021 Lower Highs and the Support Zone (green) that started on the May 19 2021 Low and since then had another four contacts made. This can be touched again if the Bottom Higher Lows trend-line (dashed), which is holding since June 19 2022, breaks.
** Fundamental Analysis **
Fundamentally, OKBUSDT remains an excellent investment opportunity as it goes hand in hand with the long-term growth of the OKX exchange. With a market cap of $3.91B, the price of OKB token is ensured by sending tokens to a burning address every 3 months, each burning report could be checked by users. OKB holders could enjoy up to 40% trading discounts (based on how many OKB tokens they hold), participate in token sales, earn passive income, enjoy security, utility and financial services by spending OKB on cooperated platforms and other added values.
With 28,548,715.55 OKB already burnt, the current circulating amount is now 271,451,284.45 OKB. OKB is designed by OKEx's top Research and Develop personnel based on the blockchain technology with the use of a token economic model to connect the world's highest quality innovative digital assets with OKEx platform users. OKB has built up a better OKEx ecological closed loop, and achieved a win-win in the blockchain industry.
-------------------------------------------------------------------------------
** Please LIKE 👍, SUBSCRIBE ✅, SHARE 🙌 and COMMENT ✍ if you enjoy this idea! Also share your ideas and charts in the comments section below! This is best way to keep it relevant, support me, keep the content here free and allow the idea to reach as many people as possible. **
-------------------------------------------------------------------------------
You may also TELL ME 🙋♀️🙋♂️ in the comments section which symbol you want me to analyze next and on which time-frame. The one with the most posts will be published tomorrow! 👏🎁
-------------------------------------------------------------------------------
👇 👇 👇 👇 👇 👇
💸💸💸💸💸💸
👇 👇 👇 👇 👇 👇
Okbusdt

OKB - Subtle Uptrend TouchThe uptrend line has been touched!
This touch has already begun leading to big continuation upwards, we will likely see more as time progresses
Daily timeframe

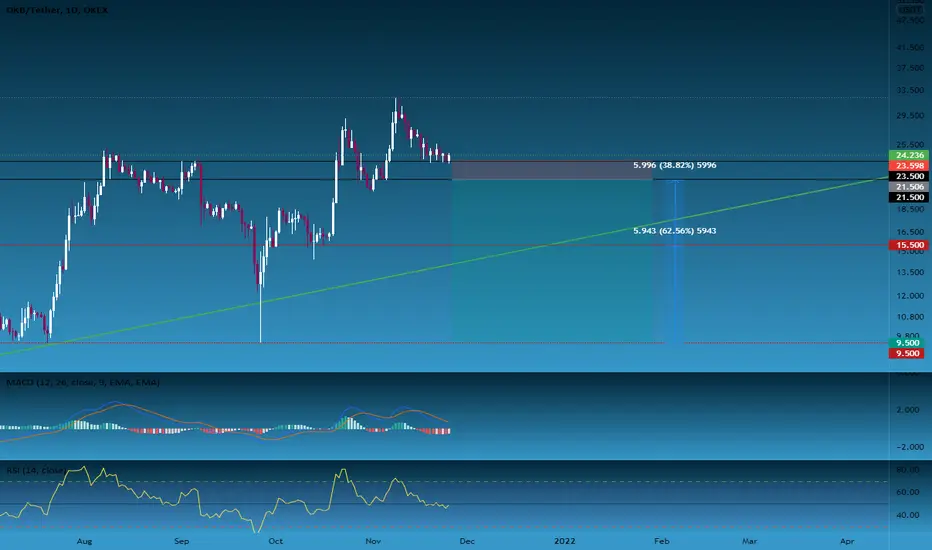
Target 16.12Following weekly chart.
Found a good long opportunity ( around 25%) RSI support a long signal also.
TP 16.12
SL 10.63 - Plase wait for candle close to stop position.

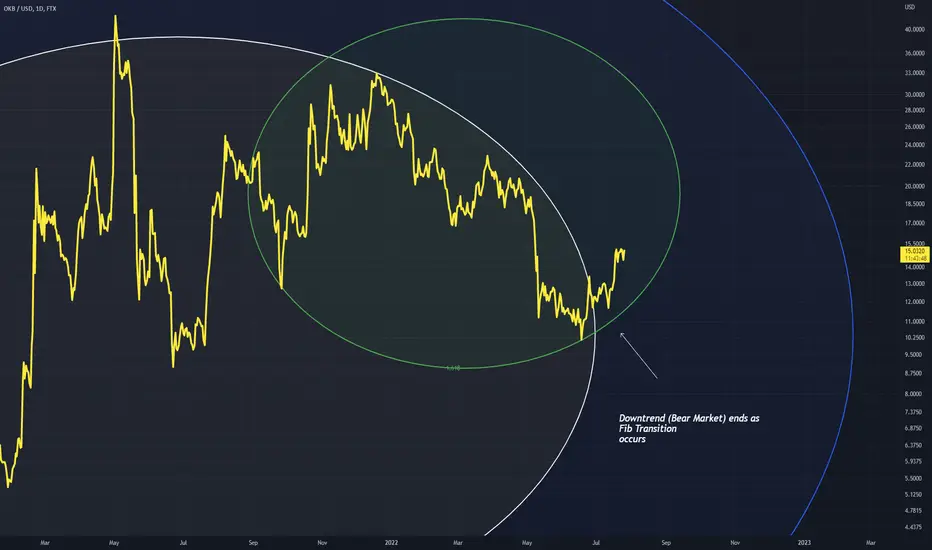
OKB - Bear Market End The end of the bear market can be observed as price transitions through 1.618
A bull market will begin, (early stages of trend reversal)
This correlates well with where BTC and ETH are currently poised
OKB Price PredictionDue to the markets condition i expect OKB to touch the $9.15 support.
Looking forward to read your opinion about it.


OKB Price Targets and Stop LossOKB/USDT
Entry Range: $19 - 21.20
Price Target 1: $22.80
Price Target 2: $23.90
Price Target 3: $28
Stop Loss: $18.50

OKB Price Targets and Stop LossOKB/USDT
Entry Range: $20 - 21.20
Price Target 1: $22.80
Price Target 2: $23.90
Price Target 3: $28
Stop Loss: $18.50

WAVES Looks Like It May Have LegsLooking bullish. Much like BCH the bulls are stealthily in control.

$OKB 9-12x opportunityMid term (1-3 month).
Take profit 1: 180$
Take profit 2: 240$
Stop loss: 10$
Do your own research.

OKBUSDT Sweet bounce (Long)Looks like OKB is ready to have a sweet bounce.
Here is why i think its a good long position:
- 50 MA touch
- 61.8% Fib touch
- Bollinger bands bottom touch
- RSI oversold
- sweet falling wedge pattern
Entry: 27,93
Stop Loss: 25,79
Profit Target: 33,00

OKB - $50OKB is currently trading above the support zone at $27.49. As long as this support is maintained, we could start seeing a move towards $32.60, $35.58, $39.38 and $50.36. Failure to hold the support at $27.49 could lead to a drop towards $24.26 and $21.55.

OKB/USDTesting/tracking elliot wave theory. Please do not trade off idea without S/L. Not financial advice.


OKB USDT SIGNALIt seems that we will soon see a decrease in prices.
Enter the deal with caution.
#REZA_VGR
hptusdt 4hours chart hptusdt 4hours chart ellite web reddi 5 lage st 0.007 and tgt 1 0.0086 tgt 2 0.01

OKB Price Analysis: Bollinger Bands Squeeze and Hook PatternOKB has been one of the top-performing cryptocurrencies over the past week, with more than 58% gains. A very rare chart pattern, which on the surface might not say much, is pointing to a trend in the making. The recent explosive move was triggered by the Bollinger Bands squeeze and hook pattern.
Bollinger Bands Squeeze Pattern
In technical analysis, the Bollinger Bands squeeze happens when the two bands turn flat and get closer to each other. This indicates that there is an ongoing ranging market. This implies that when the Bollinger Bands are flat, the price tends to make explosive moves in either direction.
Often, consolidations lead to trend expansion, but many times there are false breakouts too. To distinguish between a false breakout and a genuine breakout, the Bollinger Bands come in handy.
When we have a breakout and the upper band “hooks” upwards, while the lower band hooks downwards, there is a higher probability of a trend continuation in the direction of the breakout.
The daily OKB price chart displays the exact pattern described above. The upside breakout was accompanied by the Bollinger Bands hook in the opposite direction.
Moving forward, if OKB sustains the break above the $25.21 resistance level, there is a high probability for the bulls to challenge the next resistance level found at $42.16.

OKB/USDT GO THE MOON⭕Hello friends, I am happy to comment on this analysis below this post. ⭕📌Please like this post to support us and follow us. Thank

$OKB start of movement ... start of movement. Investors in platform currencies. Good platform and its currency is good for long distance investment.
good luck for every one invest in.


OKB (OKB) - July 7Hello?
Welcome, traders.
By "following", you can always get new information quickly.
Please also click "Like".
Have a good day.
-------------------------------------
(OKBUSDT 1W chart)
We need to see support at the 9.601 point and move above the 13.451 point to see if the uptrend can continue.
(1D chart)
We need to see if we can get support by moving up to the 12.587-15.409 section.
As it fell from the 12.587 point, it is effectively entering the mid- to long-term investment area, so careful trading is required.
In order to transition into an uptrend, the price must rise to the 15.409-21.053 section and hold.
-------------------------------------
(OKBBTC 1W chart)
If the price is maintained above the 35000 satoshi point, it is expected to continue the upward trend.
(1D chart)
If the price is maintained in the 32040 Satoshi-40790 Satoshi section, it is expected to turn into an uptrend.
If it falls from the 27670 Satoshi point, there is a possibility of entering the mid- to long-term investment area, so careful trading is required.
------------------------------------------
We recommend that you trade with your average unit price.
This is because, if the price is below your average unit price, whether it is in an uptrend or in a downtrend, there is a high possibility that you will not be able to get a big profit due to psychological burden.
The center of all trading starts with the average unit price at which you start trading.
If you ignore this, you may be trading in the wrong direction.
Therefore, it is important to find a way to lower the average unit price and adjust the proportion of the investment, ultimately allowing the funds corresponding to the profits to regenerate themselves.
------------------------------------------------------------ -----------------------------------------------------
** All indicators are lagging indicators.
Therefore, it is important to be aware that the indicator moves accordingly with the movement of price and volume.
However, for the sake of convenience, we are talking in reverse for the interpretation of the indicator.
** The wRSI_SR indicator is an indicator created by adding settings and options to the existing Stochastic RSI indicator.
Therefore, the interpretation is the same as the traditional Stochastic RSI indicator. (K, D line -> R, S line)
** The OBV indicator was re-created by applying a formula to the DepthHouse Trading indicator, an indicator disclosed by oh92. (Thanks for this.)
** See support, resistance, and abbreviation points.
** Support or resistance is based on the closing price of the 1D chart.
** All descriptions are for reference only and do not guarantee a profit or loss in investment.
Explanation of abbreviations displayed in the chart
R: A point or section of resistance that requires a response to preserve profits.
S-L: Stop Loss point or section
S: A point or section where you can buy for profit as a support point or section
(Short-term Stop Loss can be said to be a point where profit and loss can be preserved or additional entry through split trading.
GAP refers to the difference in prices that occurred when the stock market, CME, and BAKKT exchanges were closed because they are not traded 24 hours a day.
G1 : Closing price when closed
G2: Opening price
(Example) Gap (G1-G2)

OKB Resistanceit seems like we are in decision time. if bitcoin not goes crazy for sure.
( that is not any financial advice )

OKB (OKB) - June 8Hello?
Welcome, traders.
By "following", you can always get new information quickly.
Please also click "Like".
Have a good day.
-------------------------------------
(OKBUSDT 1W chart)
If it moves sideways in the 14.984-23.800 section, it is expected to lead to an uptrend.
However, if the 14.984 point falls, the 14.984-23.800 section acts as a resistance section and may take time to rise, so it is important to find support at the 14.984 point.
(1D chart)
It remains to be seen if the 12.587-15.409 section can find support and move up.
If it goes down from the 12.587 point, it could touch the 4.121 point, so you need to be careful with your trades.
If it moves above the 16.887 point and finds support, we expect the uptrend to continue.
However, in order to accelerate the upward trend, it must rise above the 26.697-29.519 section.
-------------------------------------
(OKBBTC 1W chart)
If the price holds above the 0.0004448 point, it is expected to maintain an uptrend.
(1D chart)
We need to see if we can move up along the uptrend line.
If it finds support by moving towards the 0.0004953-0.0005390 section, I expect the uptrend to accelerate.
If it falls from the 0.0004079 point, Stop Loss is required to preserve profit and loss.
------------------------------------------
We recommend that you trade with your average unit price.
This is because, if the price is below your average unit price, whether it is in an uptrend or in a downtrend, there is a high possibility that you will not be able to get a big profit due to psychological burden.
The center of all trading starts with the average unit price at which you start trading.
If you ignore this, you may be trading in the wrong direction.
Therefore, it is important to find a way to lower the average unit price and adjust the proportion of the investment, ultimately allowing the funds corresponding to the profits to regenerate themselves.
------------------------------------------------------------ -----------------------------------------------------
** All indicators are lagging indicators.
Therefore, it is important to be aware that the indicator moves accordingly with the movement of price and volume.
However, for the sake of convenience, we are talking in reverse for the interpretation of the indicator.
** The wRSI_SR indicator is an indicator created by adding settings and options to the existing Stochastic RSI indicator.
Therefore, the interpretation is the same as the traditional Stochastic RSI indicator. (K, D line -> R, S line)
** The OBV indicator was re-created by applying a formula to the DepthHouse Trading indicator, an indicator disclosed by oh92. (Thanks for this.)
** See support, resistance, and abbreviation points.
** Support or resistance is based on the closing price of the 1D chart.
** All descriptions are for reference only and do not guarantee a profit or loss in investment.
Explanation of abbreviations displayed in the chart
R: A point or section of resistance that requires a response to preserve profits.
S-L: Stop Loss point or section
S: A point or section where you can buy to make a profit as a support point or section.
(Short-term Stop Loss can be said to be a point where profit and loss can be preserved or additional entry can be made through split trading. It is a short-term investment perspective.)
GAP refers to the difference in prices that occurred when the stock market, CME, and BAKKT exchanges were closed because they are not traded 24 hours a day.
G1 : Closing price when closed
G2: Opening price
(Example) Gap (G1-G2)
