Omisego

OMG 4HR Buy ZoneOMG approaching a key support level.
The purple lines are resistance/support.
The orange are the trend lines.
Here's a quick run down:
- Volume is looking good and is declining.
- MACD is looking to swing onto the bull side.
- Candles are still getting rejected to by the 10 EMA but despite that, all three of them are getting close to catching up with the 4 hr candles.
Most importantly though, the RSI tends to bounce from 25-30 and currently it's around 43 so it still has some ways to go. (I've been using RSI a lot more over the last few months as it's been very useful.)
The buy zone I've indicated between 1450 and 1370 is where I'm looking to scale in and buy some OMG.

Becky on OMG - Mcdonald it up!?Hey lovers, today we're looking at a smaller yet VERY promising coin!
OMG is one of these coin that every crypto professional has been looking at for a LONG TIME. We are all optimistic about OMG future but when is it gonna launch to the moon FOR REAL!? Well we have established a pretty strong floor at the 110 level and I really dont think we will see OMG go any lower ever again. For investors out there OMG is a very good pick. Anything under 150 is a good entry point.
T1: 163
T2: 174
T3: 187
Stop loss: 133
If we break 194 then we have a very good chance of MOON'ing
If we break 113 then RIP time to panic :D
Who's Becky? What's her background? I am a crypto enthusiast and have been since early 2015. I have already made millions in the crypto world and am financially set for the rest of my life. I recently decided to start helping other people get rich. I like helping people, it makes me feel good. Let's share the journey together! Follow me on Tradingview/Telegram <3

OMG another leg up sooner than laterOmiseGo is soft touching an ascending trend line, is in the pitchfork mid area, the only thing it needs is to cross above EMAs 10-26-55 and close the candle above them in the daily Chart. It's growth has been a sustainable one so I don't see other reason than a bitcoin price action reason not to have a healthy growth in the short-mid term for OMG. Modest Target should be the average line of the pitchfork in the mid run, that's over 300k sats.
It also needs a lot of more volume and buying pressure to sustain the uptrend, but this is not outta ordinary situation in the actual market panorama.
Can it go lower? yes, everything can turned out different in the next 12 hrs, at 6hrs chart it has support by Ichimoku cloud so the odds it can bounce from that point are good.

OMISEGO: NEW PARTNERSHIPS & EXCHANGE LISTINGS - PROFIT = 19.14% Our "Crypto Bottom" Trade Indicator has correctly identified a buy in point on the 29th of May 2018 .
Using this buy in point and selling at today's peak price as identified by our NEW "Crypto Peak" Trade Indicator, you would have expected to net 19.14% PROFIT!!!
The increase in price may also be explained by positive developments including:
September 5 2017: Omise partners with McDonald’s Thailand to provide seamless payment experience for online and mobile orders
5th April: Omise and OmiseGO sign a Memorandum of Understanding with ShinhanCard (a subsidiary of Shinhan Financial Group, a major player in South Korea’s banking and payments arena). This aims to identify opportunities to leverage OmiseGo's payment technology and solutions, and OmiseGO’s server and mobile SDKs
26th April: The OmiseGo cryptocurrency lists on the Bithumb (one of Korea's largest exchanges by volume ).
(NEW) April 26: Zebpay lists Omise Go.
(New) May 14: London Block Exchange lists Omise Go. It is the only exchange in London to provide Great British Pound trading pair.
(New) May 14: Omisego team signed an agreement with Shinhan and Woori (two major South Korean bank). Both banks will work on Omisego’s Blockchain to ease financial transactions.
(New) May 23: Unicoin (India's top cryptocurrency exchange) lists Omise Go.
The general uptrend in the crypto markets as well as the positive developments outlined above.
***The "Crypto Bottom Signal" and "Crypto Peak Signal" used in this analysis is included as part of the Crypto Trade Signals subscription.***

OmiseGO legendary wyckoff distribution?The chart is pretty self explanatory. It had a epic rise near the beginning, then consolidated in the large blue rektangle, what if it starts heading down here having ultimately done a wyckoff distribution thing?

OMG - Finds a breakout back to BULLOMG broke through the downward resistance point this evening, which also matched a reverse FIB level .236
I ran a trend based FIB extension on the current spike and found a 1:1 extension at .001658 for sell order. Expecting this trend to continue, but will need more details before elaborating.

$OMG - OmiseGo Daily ChartI look for enty for OMG here as i believe it will be a good longer term investment. Here we see some divergence developing with the BB% and we eventually see a pull away from the lower bollinger band, but its been very slow and still hasn't gone positive with weak volume. The AC oscillator is coming close to the zero line signifying a possible change in trend and we are at the very top of the current channel. We sit against line of monthly resistance now so in order to consider a buy in, I want to see a closing candle outside this channel, and then I want to see if we can see a push past the 20 period moving average. If we can not break through the channel or unable to break through the lines of resistance here, the next line of possible support isn't until 134375 SATS so I would wait to see if we get the trend change there before considering entry.


OmiseGO at supportOmiseGO (OMGUSD) has been dropping since the beginning of this month and is now back to the support level around $9,00.
If price reacts and rallies from the support area, we can expect it to reach the resistance area around $13.
Once price reaches $13, we can expect some reaction to the downside.
If price continues to drop, we can expect the drop to continue to around $6,00.
Good Luck,
CryptoTrendline

OMG road to the moon Medium-term chart for Omise Go. Excellent fundamentals, road map moved (POS+plasma+important associations incoming), great team led by Jun , Vitalik and Joseph Poon. The target is only the first, in the long term I consider much higher targets but it is too quick to make calculations.
Not financial advice.

Gain more ETH with this OMG trade on Binance!! It's buy time!!-Great Cross on the MACD.
-The EMA is about to give us the golden cross for some nice gains.
-The volume is picking up
-Holding old support levels
*** The market is bearish right now but we can still gain more Ethereum through this trade. For example if you invested 1 Eth into OMG at 0.020000 and the trading pair increases to 0.030000 then your 1 Eth is now 1.5 Eth. So you have gained 0.5 Eth, which is great for when the markets turn bullish because that 0.5 Eth that you have earned will gain more cash value as the price of Eth increases. Basically you invested 0.5 Eth for free, the more Eth you gain now the more money you will make when the market picks up!!


OmiseGoBreak out resistance line of falling wedge. And now moving in triangle with increasing. First target 23.6% level fibonacci (0.00157)

OMGBTC (OMISEGO Token) Ready, Set…………..!OMGBTC (OMISEGO Token) 05/26/18, 8:15 PM EST, by Mike Mansfield
Good evening, trader friends! Thanks for stopping by. No, no, no, I am not here to wrangle a thumbs up from you on this one. However, if you just love any of the other forecasts, feel free to like away! ;-)
OMISEGO sounds a bit like what “oh my gosh” would be in another language.
Perhaps you can relate to the following statement: "Sometimes I literally “know” what an outcome of a chart will be with a high degree of clarity, probability, and ultimately accuracy." However, this is not one of those times. I can rationally make the case for several outcomes. That is not something I love….but since someone asked for this, I’ll map out the 3 patterns and their likely paths and change of trend times and price areas to watch for.
BOTTOM LINE: UG! We have patterns within patterns, but the cycles look good!
Pattern-1 is long-term neutral:
Large triangle wedge pattern (lime green and dark red lines) may be forming. If correct, it is unfinished and will have at least one, possibly two, more legs down toward the red long-term support trend trend-line, before we can say for sure if the pattern will resolve to the upside and moonshot, or tank into crypto oblivion.
Pattern-2 is medium-term bearish. Maybe:
Bearish rising wedge (cyan blue trend-lines) lines are converging in an upward direction. But it’s not super perfect pattern, as they sometimes look. Rising wedges typically resolves to the downside in a significant way. Moreover, OMG broke the lower support line at the recent May 23 low, which likely means eventually lower prices.
Pattern-3 is short-term bullish:
Falling wedge (yellow downward trend-lines) is short-term bullish and no matter what,
a cyclical bounce is due now based on the two quite accurate cycles thus far.
CYCLES:
Two nicely aligning cycles lows are nesting now (making a low). OMG should have a tradable rally to the green downtrend line.
Green cycle moving up and due to peak June 18,
Green cycle bottoms again July 15th.
Pink cycle is also moving up. Both the pink and green cycle are both due to top around August 10 also, =/- 2 days.
INDICATORS:
Klinger Volume Force is in a wedge. It also supports the idea that the eventual breakout, up or down, should be big.
MACD is rounding in line with cycle lows due any day now.
SUMMARY:
Short-term pattern and cyclical are bullish for a bounce, or more, perhaps until mid June.
Then, another selloff back to the lower cyan support trend-line, in alignment with the cycle low of the shorter-term green cycle, while the larger pink cycle is
moving up.
OMG with then either breakout the upside in line with the pink cycle moving up until about August 10th, while the pink longer-term cycle is also moving up and
blast off.
If the breakout does not happen by the peak of the Pink cycle (Aug 10th), then OMG is very bearish, and the bigger triangle/wedge will likely end badly for OMG.
If OMG breaks out to the upside between now and June 18th, then it might retest the breakout line or pullback around July 15th then have a cyclical peak
August 10th +/- 2 days.
POTENTIAL TRADE:
Consider looking for a short-term cyclical long trade. Lower risk area could be at the first higher swing low once a 34-50 bar EMA
average (or something better) turns up and price is also closing above the average. If The trade doesn't move nicely after the first or second pullback on a 240 minute chart, then the outlooks would be quite bearish short-term and long-term.
DISCLOSURE:
This analysis is meant for educational purposes only. You trade at your own risk!
Cheers!
Michael Mansfield CIO

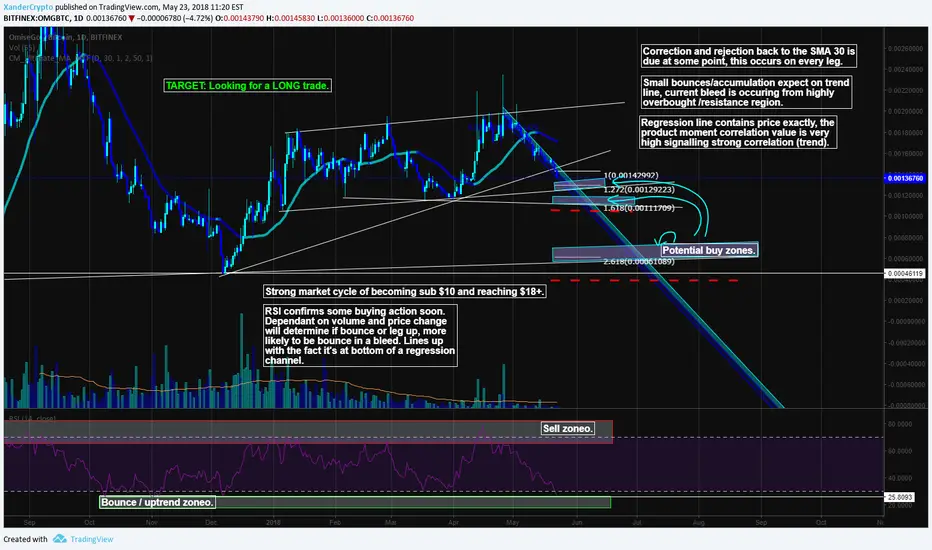
OmiseGO, a Mid - Longterm analysis [OMG/BTC]A Mid-Longterm look on OMG/BTC
One of my favourite projects, with a cyclic nature will hit back soon. A common cycle is sub $10, then above the $18+ region.
Here we want to pick up OMG around a support region after it has some good buyback volume after selling volume thins or shakeout occurs.
In this trade I use:
~SMA 30.
~Trendlines.
~Horizontal support lines.
~Volume for confirmation of bleed.
~RSI.
~Fibonacci retracement to line up with targets of trendlines / to see if these regions naturally occur.
~Stoploss / sell zone on a fakeout of a buy in.
Want to join a private trading group?
PM me.
This is NOT a buy OR a sell signal. I'm not a financial adviser and nothing I say is a fact, any losses made through these decisions do not hold me accountable and you should never invest more than you're willing to lose.
Thanks for reading, a follow on tradingview and a like would be greatly appreciated.
1k followers ~ FACE REVEAL
Xander


$OMG We're going down for a bit - New support lineFollow the Dark blue line. That's the new support line. Got it? Good.

OMGUSD (OmiseGo) wave analysis update: 4hr tfMy previous post on OMGUSD (4hr tf) can be found here:
It was mentioned in the previous post that a price close below ~$12.50 favored a bearish scenario for OmiseGo (OMGUSD). Price swing downwards from ~$17.82 on April 26, 2018 is therefore identified in this analysis to be a triple zigzag Elliott wave structure (W-X-Y-X-Z) that is not yet complete as we are in the last leg of the structure i.e. Wave Z.
The horizontal red lines on the chart from the previous post mark the region that is still favored for the termination of wave Z, before any bullish momentum can be sustained by OmiseGo (OMGUSD).
The point of invalidation (POI) of this analysis is a price close above ~$16.05 at which point OmiseGo (OMGUSD) would have invalidated the proposed Elliott wave structure.

My thoughts on $OMG currentlyMy current thoughts on $OMG at the moment. What do you all think? Let me know my good peoples

OmiseGO Machine Learning AI Crypto SignalThe rolling three-day signal for OmiseGO (OMG) is "Don't Own". This is day one of the three-day signal. The signal will be updated again Friday. For further details or discussion, feel free to leave any questions or check out signature/profile.
