SPX - Are you catching the rotation trends? SPX is still holding very bullish price action. Technicals are pointing towards higher price and todays inside consolidation day certainly helps digest recent gains.
Along with the flat indices market session, we did observe some massive capital rotation trends.
Financials saw a pretty strong down move across the board. JPM / BAC / C all saw large outflows. We were positioned on the short side of financials and took profits on JPM puts.
Even with the big selloff in financials, SPX held up surprisingly well.
Capital simply rotated instead of outright leaving the market. Bullish Signal.
Technology, Energy, Materials, Health care, Transports all saw capital inflow trends.
Rotation into under preforming sectors is a sign that markets could be staging another healthy leg up.
We still have an upside target over 6300 on SPX.
ON

Bitcoin Between Strength and Suspension Tactical Inflow Anomaly.⊣
⟁ BTC/USD – BINANCE - (CHART: 1H) – (Jul 03, 2025).
◇ Analysis Price: $109,716.55.
⊣
⨀ I. Temporal Axis – Strategic Interval – (1H):
▦ EMA 9 – ($109,510.76):
∴ Price remains above EMA9, sustaining the short-term bullish impulse;
∴ The EMA 9 is ascending with consistent candle-body support across recent sessions.
✴ Conclusion: Tactical momentum persists as long as price holds above EMA9 on closing basis.
⊢
▦ EMA 21 – ($109,064.37):
∴ EMA 21 serves as dynamic support, unbroken since the July 2nd surge;
∴ Distance between EMA9 and EMA21 confirms preserved trend integrity.
✴ Conclusion: No structural weakness observed; trend foundation remains intact under current volatility.
⊢
▦ Volume – (Visual estimation, TradingView):
∴ Volume surged during July 2 rally; subsequent bars show diminishing interest;
∴ Last high-volume candle aligns with recent local top attempt.
✴ Conclusion: Buyer aggression is fading. Volume must return for any continuation to be credible.
⊢
▦ Bollinger Bands (20, 2.0) – (Upper: $110,050.15 / Lower: $108,545.25):
∴ Price recently tapped upper band and pulled back slightly without breakdown;
∴ Bands are widening after expansion, indicating active volatility but no climax.
✴ Conclusion: System operates in elevated volatility regime, with breakout potential still valid if supported.
⊢
▦ Price Action (66, 6, 5) – (Visual structure, local range):
∴ Price formed a clean higher low and higher high sequence starting July 2nd, confirming bullish microstructure;
∴ Current candles show upper wick formation at ~$110,050, indicating rejection and absorption at resistance.
✴ Conclusion: Uptrend structure is valid but approaching short-term exhaustion. If support holds at $109,100–108,900, continuation remains viable.
⊢
▦ RSI + EMA9 – (RSI: 62.69 / EMA: 63.27):
∴ RSI dipped below its own EMA9, indicating weakening strength in recent hours;
∴ RSI remains above 60, preserving bullish territory but signaling caution.
✴ Conclusion: Early-stage exhaustion detected. Zone of hesitation active.
⊢
▦ ATR (14, RMA) – (447.69):
∴ Average volatility is still elevated relative to June baseline;
∴ Slight decline in ATR may suggest slowing force behind directional moves.
✴ Conclusion: Tactical volatility is active but not expanding. Suitable for traps or distribution setups.
⊢
🜎 Strategic Insight – Technical Oracle:
∴ The structural setup holds a bullish bias with dynamic supports (EMA9/EMA21) intact;
∴ Bollinger expansion and RSI positioning signal a zone of heightened interest, but the fading volume and early RSI crossover inject caution;
∴ This is a tactically suspended state where continuation is possible but dependent on incoming confirmation volume.
⊢
⟁ II. ARCANVM SIGNAL - (Bitcoin Inflow +5,000):
∴ Current Hourly Inflow: 20,788.10 BTC;
∴ Structural Threshold (30EMA): ~3,200 BTC;
∴ Trigger Threshold: ≥ 5,000 BTC.
✴ Conclusion and Interpretation: This event constitutes a critical liquidity anomaly under the Silent Sentinel Protocol. While it does not inherently dictate trend direction, its magnitude-6.5x above the structural average-configures:
∴ A probable institutional move for redistribution or liquidity unlocking;
∴ Elevated risk for short-term distortion events, particularly across the H1–H4 timeframes;
∴ An urgent need to monitor subsequent Netflow, to confirm whether real outflow pressure follows.
⊢
∫ III. On-Chain Intelligence – (Source: CryptoQuant):
▦ Exchange Netflow Total - (All Exchanges):
∴ Current: +555 Bitcoin net inflow;
∴ The ARCANVM inflow (+20,788 Bitcoin) has not been fully absorbed or reversed.
✴ Conclusion: Some liquidity remains inside exchanges. Potential for redistribution or silent preparation.
⊢
▦ Exchange Reserve - (All Exchanges):
∴ Continuously declining; current: ~2.44M Bitcoin;
∴ The inflow did not shift the macro trend of reserve depletion.
✴ Conclusion: Structural scarcity preserved. Inflow likely tactical and non-systemic.
⊢
▦ Futures Perpetual Funding Rate 7D-SMA - (All Exchanges):
∴ Holding near 0.01% – neutral bias;
∴ No evidence of directional crowding in perpetuals.
✴ Conclusion: Perpetual markets in tactical balance. Spot-driven price action dominates.
⊢
🜎 Strategic Insight – On-Chain Oracle:
∴ Despite the aggressive ARCANVM signal, the absence of structural reversals in reserves and neutral derivatives positioning confirms the move is non-structural.
∴ Markets remain in equilibrium.
∴ No emergent directional force-just silent posture-shifting.
⊢
⧈ Codicillus Silentii – Strategic Note:
∴ This is a state of tactical ambiguity. Breakout or failure depends on external triggers, as neither volume nor derivatives offer decisive guidance.
∴ The structure listens, not speaks.
⊢
▦ Tactical Range Caution:
∴ Resistance Watch Level: $110,050;
∴ Tactical Support: $109,100;
∴ Structural Alert Level: $108,400.
⊢
𓂀 Stoic-Structural Interpretation:
∴ Structurally Bullish – Tactically Suspended;
⊢
⧉
⚜️ Magister Arcanvm – Vox Primordialis!
𓂀 Wisdom begins in silence. Precision unfolds in strategy.
⧉
⊢

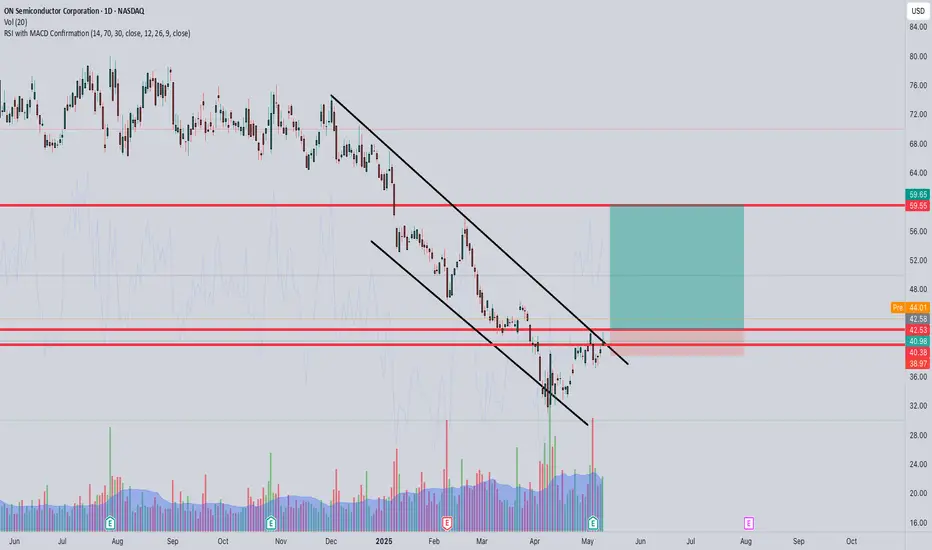
ON is on!!We are opening at 44 which is the contracts the flow picked up (once again they were right)
But this chart is showing a lot of potential, as we broke above the trendline, i will watch 45 for an entry with a possible $60 target
AMD: A Once-in-a-Lifetime Opportunity!**🔥 AMD: A Once-in-a-Lifetime Opportunity!**
In pre-market, AMD briefly touched **$125** following earnings. You all know how this works—sooner or later, the algos will bring it back to that level. No hesitation, I’m **quadrupling my bet—going in MASSIVELY!** 🚀💰

Act/UsdtBINANCE:ACTUSDT
📉 **ACT price analysis**:
- The current price is **0.2591**, which is holding at the previous resistance level. If it stays here, the price could try to move higher to these resistance levels:
1. 🔝 **0.2843**
2. 🔝 **0.300**
3. 🔝 **0.3454**
4. 🔝 **0.400**
- If the price **doesn’t** hold here and starts dropping, it might find support at the following levels:
1. ⬇️ **0.2445**
2. ⬇️ **0.2143**
---
🚨 **Disclaimer**: This is not financial advice. Always do your own research before making any trading decisions! 😊

NVDA is coming backWent below the earnings low but the stock has a strong support around 127 and 132 range. Relative strength is pretty good and it seems like is trying to come back. The fundamentals are still good.
Therefore, I have this trade idea to buy the stock of the 130 with a very tight stop at 125 and my target is 165.

EURUSD ON The Rise BUYEURUSD Looks like it will make a good move and here are the details
the market is trading on 1.0720
Baise >>> Bullish
Goal >>> 1.0793
Recommended Stoploss 1.0687
Time Frame 8H Signal

Intel Corporation (INTC) Stock: A Investment Opportunity ?Intel Corporation's recent earnings report has raised some concerns, but there are several reasons to remain optimistic about INTC stock.
Despite a challenging Q2, Intel is strategically shifting production to its high-volume plant in Ireland, positioning itself for long-term gains.
The company's focus on cutting-edge chip manufacturing and AI advancements highlights its commitment to innovation.
Moreover, Intel's diverse portfolio, including the promising Gaudi AI products, provides a solid foundation for future growth.
With strategic cost-cutting measures and a strong financial position, Intel is poised to rebound and deliver value to its investors.

ON potential Buy setupReasons for bullish bias:
- Price gave triangle breakout
- Price bounce from support
- LH breakout
- No divergence
Here are the recommended trading levels:
Entry Level(CMP): 78.74
Stop Loss Level: 58.74
Take Profit Level 1: 98.74
Take Profit Level 2: 110.26
Take Profit Level 3: Open

NVDA to correct back to 122NVDA's chart needs to rebuild even if still more bullish legs to come - Most likely pulling back to 122 - we will reassess if a long trade is prudent depending if and how we get to 122 area

Can SMCI hit 1080 on Nasdaq 100 inclusion?Can SMCI hit 1080 on Nasdaq 100 inclusion?
Target might be much higher but lets see the next $170 move first

Bitcoin Is Trading At The Support As Stocks PullsbackHey traders
I this video I will take look at NVIDIA which I think it can be moving into a correction and can possibly be headed down for deeper prices. So if today major stocks indicies will have second red day in a row, then possibly next week there can be more risk-off. In such case I think its better to wait on any long ideas on cryptos (short-term), and wait on much better timing for potential long entires, which can be maybe after summer, or during elections when normal markets tend to be in bull run. Additionally, any rate cut later this year can be alos supportive for stocks and other assets.
When I look at bitcoin, I think that 50k is very good potential support; if it gets there.
Have a nice weekend.
Grega

Add long SQQQ May 31st $10.50+ Calls HereI bought long SQQQ $10-$10.50 May 24th to 31st calls this morning, if we hit 5400 i'll add.
The VIX is bouncing as suspected at $12 and the S&P500 wants to dip below and confirm a 5300 fake out which was my bias and the DOW (DJIA) wants to do the same at 40k
bitcoin is faking out above 67500 into an expanded flat pointing to my 63,300-63,500 short term short trajectory

AVAX MVRV Detailed Analysis AVAX 1W MVRV and Price Analysis
Hi folks,
Let's take a look at some on-chain data.
What is MVRV (Market Value to Realized Value)?
MVRV is an on-chain indicator used to analyze the valuation of cryptocurrencies. It is a simple but powerful tool that shows investors how overvalued or undervalued a cryptocurrency is at the moment.
Simply 👇🏻
MVRV is below 1: This means that most investors are at a loss and can be interpreted as a potential buying opportunity.
MVRV is above 1: This means that investors are in profit and the price may be overheating.
However, when performing cyclical analysis of each instrument, we can see that different MVRV levels are critical. In instrument X, 1.15 may indicate that the price is overheating, while in instrument Y, 2.00 may indicate that the price is overheating.
Now let's examine AVAX with MVRV Data
In the bull rally we experienced in 2021, AVAX had risen from $5 to $150.
When we examined the MVRV, we witnessed that it had risen from 0.64 to 1.27 points.
When we examine AVAX historically, we can observe that the price overheats when the MVRV score exceeds 1.11 points. However, it should not be forgotten that we are making this examination on weekly data. Therefore, selling everything you have when the MVRV score exceeds 1.11 points will NOT help you maximize your profit in a bull run.
Instead, strategies can be created for gradual selling along with the MVRV score exceeding 1.11 in AVAX. It may be beneficial to do this in 5 or 10 steps. From now on, it is up to you.
Conclusion
In conclusion, by examining the MVRV score of an instrument, we can deduce that investors are at a loss if the price is below 1 (relatively cheap), and relatively profitable if it is above 1.
Historical examinations made specifically for the instrument help us to understand where the price of an instrument heats up based on the MVRV score. In this way, we can create a gradual selling strategy specific to the instrument.
When we look at AVAX, we can see that it offered selling opportunities after 1.11 points in the previous bull run. Following the 1.11 points closely can be beneficial for investors in this bull run.
Thank you for reading.

On Running Stock Leaps 18.28% On Earnings BeatOn Holding ( NYSE:ONON ), the parent company of On Running, has reported earnings of 36 cents per share, more than doubling from the 17 cents reported last year. Revenue jumped nearly 20% to a record $561 million, although sales growth slowed for the fifth quarter in a row. FactSet analysts expected adjusted earnings to tick down 2 cents to 15 cents per share. On's direct-to-consumer sales increased 48.7% year-over-year on a constant currency basis, making up 37.5% of On's total net sales.
On maintained its outlook of at least 30% net sales growth for the year and expects to achieve a gross profit margin of around 60% for the year. FactSet predicts 2024 an 87.5% earnings increase, to 75 cents per share, on 23% revenue growth to $2.511 billion.
On Holdings ( NYSE:ONON ) reports first quarter 2024 results, with On surpassing CHF 500 million in a single quarter for the first time in its history. Total net sales reached CHF 508.2 million, a growth of 20.9% year-over-year and by 29.2% on a constant currency basis. The significant increase in DTC net sales, which now make up 37.5% of On's total net sales, and efficient inventory management support On's further expansion of its premium gross profit margin to 59.7%.
The continued high demand for the On brand provides further confidence in the stated goals for 2024 and beyond. On reiterates its full year expectation of at least 30% growth in net sales on a constant currency basis, which translates to reported net sales of at least CHF 2.29 billion at current spot rates.
Technical Outlook
On Holdings shares ( NYSE:ONON ) closed up 18.28% on Tuesday's market trading which is moderately overbought with a Relative Strength Index (RSI) of 63. The stock has concurrently being in consolidation zones but has managed a 34.6% gain for the year through Tuesday's close.

ON potential Buy setupReasons for bullish bias:
- Price bounced from support
- Bullish Harmonic XABCD pattern
- Strong bullish candles at support
- Positive Earnings
Here are the recommended trading levels:
Entry Level(CMP): 73.58
Stop Loss Level: 67.16
Take Profit Level 1: 80
Take Profit Level 2: 85.99
Take Profit Level 3: Open

AGLD On-Chain ThoughtThis may be a esoteric thought and/ or conclusion
There tends to be a divergence between the price of AGLD and Whale assets
Now there is something of note in this that is super important.
I am unsure on the quality of these on-chain metrics and for that matter the coin itself
Now with that being said it does have high beta and massive surges in price, but for one only investing with spot it is hard to manage.
Now lets get out the crystal ball and say if it were to be a parabolic run and it was highly correlated to BTC we could see it break ATH levels
Looks like a bad coin but doesn't mean there is no money to be made
I also doubt that these metrics inherently hold ANY alpha since they don't appear to front run, etc, etc.
That's why quant exists, going to have to look a lot further and even see if its worth buying in the medium and long-term.

MTL loves a good wickGreen buy signal on the machine learning indie on 3 Day chart. Back test accuracy is 95%.
This usually follows with a wick to the upside, to one of the orange trendlines. Setting multiple take profits.
As always, this is for entertainment purposes only.

$INTC - Rising Trend Channel [MID-TERM]🔹Between support 32.86 and resistance 37.24 in Rectangle Formation.
🔹In case of a NEGATIVE reaction, it has support at approximately 33.
🔹Technically POSITIVE for the medium long term.
Chart Pattern:
◦ DT: Double Top | BEARISH | 🔴
◦ DB: Double Bottom | BULLISH | 🟢
◦ HNS: Head & Shoulder | BEARISH | 🔴
◦ REC: Rectangle | 🔵
◦ iHNS: inverse head & Shoulder | BULLISH | 🟢
Verify it first and believe later.
WavePoint ❤️

AFRM - Rising Trend Channel [MID-TERM]🔹Breakdown support of rising trend channel in the medium long term.
🔹Support at 13.81 and Resistance at 19.99 in Rectangle formation
🔹Slightly risen above the resistance level of 17.
🔹Technically POSITIVE for the medium long term.
Chart Pattern:
🔹DT - Double Top | BEARISH | 🔴
🔹DB - Double Bottom | BULLISH | 🟢
🔹HNS - Head & Shoulder | BEARISH | 🔴
🔹REC - Rectangle | 🔵
🔹iHNS - inverse head & Shoulder | BULLISH | 🟢
Verify it first and believe later.
WavePoint ❤️

ONON On Holding AG Options Ahead of EarningsAnalyzing the options chain and the chart patterns of ONON On Holding AG prior to the earnings report this week,
I would consider purchasing the 35usd strike price Puts with
an expiration date of 2023-8-18,
for a premium of approximately $2.42.
If these options prove to be profitable prior to the earnings release, I would sell at least half of them.
Looking forward to read your opinion about it.

ON - RisingTrend Channel [MID TERM]- ON is in a rising trend channel in the medium long term.
- ON has broken a resistance level and given a positive signal for the long-term trading range.
- In case of a negative reaction, the stock has support at approximately 76.00 .
*EP: Enter Price, SL: Support, TP: Take Profit, CL: Cut Loss, TF: Time Frame, RST: Resistance, RTS: Resistance to be Support LT TP: Long Term Target Price
*Chart Pattern:
DT - Double Top | BEARISH | RED
DB - Double Bottom | BULLISH | GREEN
HNS - Head & Shoulder | BEARISH | RED
REC - Rectangle | BLUE
iHNS - inverse head & Shoulder | BULLISH | GREEN
Verify it first and believe later.
WavePoint ❤️

ON - Rising Trend Channel [MID TERM]- ON is in a rising trend channel in the medium long term.
- The stock has broken up through resistance at 76.00.
- In case of negative reactions, there will now be support at 76.00.
- The stock is assessed as technically positive for the medium long term
*EP: Enter Price, SL: Support, TP: Take Profit, CL: Cut Loss, TF: Time Frame, RST: Resistance, RTS: Resistance to be Support LT TP: Long Term Target Price
*Chart Pattern:
DT - Double Top | BEARISH | RED
DB - Double Bottom | BULLISH | GREEN
HNS - Head & Shoulder | BEARISH | RED
REC - Rectangle | BLUE
iHNS - inverse head & Shoulder | BULLISH | GREEN
Verify it first and believe later.
WavePoint ❤️
