ONDOUSDT 1DONDO ~ 1D
#ONDO If you still have Conviction on this coin,. Maybe you can consider this support block to start buying gradually. Minimum target 15%+
Ondoanalysis

Are ONDO Bulls Preparing for a Major Comeback?Yello, Paradisers! Is the recent breakdown in #ONDOUSDT just a trap to shake out weak hands? The price action is hinting at a potential manipulation move, and if bulls can reclaim a key level, we could be in for a speedy reversal. Let’s dive into the key areas that will make or break this move.
💎A few days ago, #ONDO breached a key support level, but interestingly, this breakdown didn’t trigger any major sell-off. This lack of follow-through from sellers is an early clue that this could be a deviation—a classic shakeout move to trap shorts before sending the price higher.
💎Now, ONDO is about to test a critical resistance zone between $1.30 and $1.34. If bulls can reclaim this level, the deviation will be confirmed, and we could see a strong bullish reversal kick in.
💎If bulls manage to break above $1.34 level, then a quick move towards the $1.60 level is highly likely, followed by a move towards the strong resistance zone between $1.70 and $1.75. This upper resistance zone is key because it aligns with the 0.618 Fibonacci retracement level, which is known to trigger heavy profit-taking. We’ve seen it time and time again—this level tends to attract sellers, so caution is warranted if the price approaches this area.
💎On the downside, ONDO currently has strong support between $1.10 and $1.15, a zone that has consistently attracted buyers. The repeated reactions from this support suggest that buyers are actively defending this level, which could give bulls the confidence to push through the immediate resistance above.
Paradisers, this setup is looking very promising—but don’t forget, discipline and patience are key in this market.
MyCryptoParadise
iFeel the success🌴

ONDO/USDT Falling Wedge in Play Is it Set to Soar?Pattern
The chart is forming a Falling Wedge pattern, which is typically a bullish reversal structure.
Key Levels to Watch
Support Zone
Lower trendline support around $1.05.
Strong horizontal support near $1.00, making this a potential entry point for long positions.
Resistance and Target
If a breakout occurs, the expected upside target is $1.60+, with further momentum possibly driving the price even higher.
Insights
The falling wedge narrows as price action consolidates, indicating reduced bearish strength.
A breakout above the upper trendline would confirm a bullish move.
Trading Strategy
Look for confirmation of breakout or bounce from $1.05 or $1.00 before entering.
Set stops below $1.00 to manage risk.
Potential profit taking levels could be around $1.60 or higher depending on market momentum.
This chart signals a promising bullish setup. Monitor closely for breakout confirmation to capitalize on the potential upward move.


ONDOUSDT Analysis: Promising Buy ZoneThe blue box highlighted on the chart represents a key demand zone and could serve as an excellent buying opportunity for ONDOUSDT. This area is carefully selected using advanced market analysis tools.
Key Highlights:
Demand Zone: The blue box is a high-probability reaction area where buyers may become active.
Market Context: Keep an eye on overall market sentiment and conditions to align your strategy.
Confirmation Indicators:
To ensure precision, I utilize CDV, liquidity heatmap, volume profile, volume footprint , and upward market structure breaks on lower time frames when trading the blue box.
Learn My Techniques:
Interested in mastering these strategies? DM me to learn how to effectively use advanced trading tools like CDV and liquidity heatmaps.
Risk Management:
Always manage your risk carefully and approach the market with a disciplined mindset. Good luck!
If you think this analysis helps you, please don't forget to boost and comment on this. These motivate me to share more insights with you!
I keep my charts clean and simple because I believe clarity leads to better decisions.
My approach is built on years of experience and a solid track record. I don’t claim to know it all, but I’m confident in my ability to spot high-probability setups.
If you would like to learn how to use the heatmap, cumulative volume delta and volume footprint techniques that I use below to determine very accurate demand regions, you can send me a private message. I help anyone who wants it completely free of charge.
My Previous Analysis (the list is long but I think it's kinda good : )
🎯 ZENUSDT.P: Patience & Profitability | %230 Reaction from the Sniper Entry
🐶 DOGEUSDT.P: Next Move
🎨 RENDERUSDT.P: Opportunity of the Month
💎 ETHUSDT.P: Where to Retrace
🟢 BNBUSDT.P: Potential Surge
📊 BTC Dominance: Reaction Zone
🌊 WAVESUSDT.P: Demand Zone Potential
🟣 UNIUSDT.P: Long-Term Trade
🔵 XRPUSDT.P: Entry Zones
🔗 LINKUSDT.P: Follow The River
📈 BTCUSDT.P: Two Key Demand Zones
🟩 POLUSDT: Bullish Momentum
🌟 PENDLEUSDT.P: Where Opportunity Meets Precision
🔥 BTCUSDT.P: Liquidation of Highly Leveraged Longs
🌊 SOLUSDT.P: SOL's Dip - Your Opportunity
🐸 1000PEPEUSDT.P: Prime Bounce Zone Unlocked
🚀 ETHUSDT.P: Set to Explode - Don't Miss This Game Changer
🤖 IQUSDT: Smart Plan
⚡️ PONDUSDT: A Trade Not Taken Is Better Than a Losing One
💼 STMXUSDT: 2 Buying Areas
🐢 TURBOUSDT: Buy Zones and Buyer Presence
🌍 ICPUSDT.P: Massive Upside Potential | Check the Trade Update For Seeing Results
🟠 IDEXUSDT: Spot Buy Area | %26 Profit if You Trade with MSB
📌 USUALUSDT: Buyers Are Active + %70 Profit in Total
🌟 FORTHUSDT: Sniper Entry +%26 Reaction
🐳 QKCUSDT: Sniper Entry +%57 Reaction
📊 BTC.D: Retest of Key Area Highly Likely
I stopped adding to the list because it's kinda tiring to add 5-10 charts in every move but you can check my profile and see that it goes on..

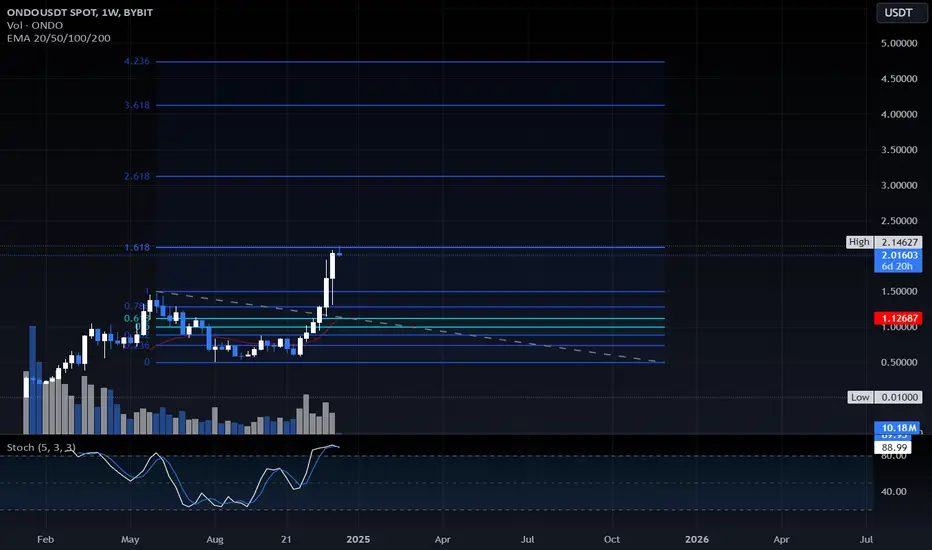
ONDOUSDT Is This the Beginning of a Parabolic Run?
BYBIT:ONDOUSDT has demonstrated impressive strength following a decisive breakout above the $1.5 resistance level. Notably, the recent market-wide dump had minimal impact on BINANCE:ONDOUSDT.P , with the previous resistance level now acting as robust support. This resilience, coupled with strong trading volume, suggests underlying bullish momentum.
Traders are now eyeing a potential parabolic move towards the $4 target. However, it is crucial to exercise prudent risk management. Implement a strict stop-loss order below the recent swing low to protect profits and mitigate potential losses.
BITGET:ONDOUSDT Currently trading at $1.68
Buy level: Above $1.5
Stop loss: Below $1.175
Target : $4
Max Leverage 3x
Always keep Stop loss
Follow Our Tradingview Account for More Technical Analysis Updates, | Like, Share and Comment Your thoughts

Potential X10 TOP RWA $ONDO A significant bullish on LSE:ONDO has proved that it is one of the winner token in this cycle, besides the prices that going up, LSE:ONDO is also a token that has good fundamental that backed by Black Rock, Founder Funds, Pantera Capital, and Coin Base. LSE:ONDO also (rumored) being bought by Donald Trump which makes it easy x10 for $ONDO. At this time LSE:ONDO valued at 2$ which still undervalue so much. what is on your thought about LSE:ONDO ? lmk
ONDO price preparing a surprise for us?Yesterday, OKX:ONDOUSDT price was bought back quite nicely
The critical level for the start of the growth wave is $0.58
And if we're lucky, we can catch a 75% price movement CRYPTO:ONDOUSD
_____________________
Did you like our analysis? Leave a comment, like, and follow to get more

[ONDOUSDT] - time to buy!on the verge to breakout the pattern in daily chart.
expect at least 100% profit from this point
best regards Ceciliones🎯

ONDOUSDTONDO ~ 1D ✅
#ONDO Make purchases gradually from here. It's only a matter of time until this descending pattern is broken.

ONDOUSDTONDO ~ 1D
#ONDO Make purchases gradually on this support block. Minimum target of 10-20% for the short term.

Is ONDOUSDT Heading for a Major Downturn? Key Levels to Watch!Yello, Paradisers! Are we about to witness a significant move in #ONDOUSDT? Let’s break down the current situation.
💎#ONDO has broken the ascending channel support, indicating a potential bearish momentum. The price recently bounced off the demand zone at 0.9, suggesting a possible upward retest before continuing its downward movement.
💎If the price breaks below the 0.9 demand zone, we could see a further decline towards the strong demand area at 0.687, and potentially even lower to the OB area around 0.48.
💎However, if ONDO manages to reclaim the price above the ascending channel support and breaks the resistance at 1.295, this would invalidate the bearish momentum. In this case, the price has the potential to continue its upward movement.
Stay sharp, traders, and keep these critical levels in mind as you navigate the market.
MyCryptoParadise
iFeel the success🌴

#ONDO/USDT#ONDO
The price is moving within a descending channel pattern on the 1-hour frame and is expected to rise after it has been largely committed to it
We have a downtrend on the RSI indicator that is expected to break upwards and we have a tendency to stabilize above it
We have a major support level in green at a price of 0.9200
We have a tendency to stabilize above the moving average 100
Entry price 0.9300
First target 0.9613
Second target 0.9925
Third target 1.03

ONDOUSDT 12HONDO ~ 12H
#ONDO The resistance of this descending channel is getting weaker. It is only a matter of time until this resistance line is broken.


ONDOUSDT 8HONDO ~ 8H
#ONDO Make purchases gradually after successfully breaking through this resistance line.

ONDOUSDT 1DONDO ~ Update
#ONDO After a 76%+ rise, It Looks Like #ONDO Is Making a Bullish Pattern Again.
The best strategy when the market is uncertain. Buy gradually within this pattern or buy after breaking through the resistance line of this pattern.

ONDOONDO / USDT
ONDO one of few coins that showed strength in current boring / bearish season
Its being accumulated in falling wedge and above MA / bullish trendline since long time
As long as these bullish patterns are holding priority is bullish
The best approach for buying it if market give us another dip towards the trendline then a bullish bounce with easy invalidation at that point or after breakout confirmation of the falling wedge overall looks bullish

#ONDO BREAKOUT THIS BULLISH PENNANT PATTERN!#ONDO Breakout this bullish pennant pattern and currently retesting the support, and then we can expect a potential rally. Technically, as per the pattern, we can expect almost a 150% rally.
Entry: CMP and add more up to $0.848
SL: $0.77
DYOR, NFA
#Crypto LSE:ONDO

#ONDO/USDT Trade Setup! Entry, SL and Target!#ONDO is breaking out on the daily chart! A retest is likely, targeting the yellow box.
Best entry: $0.75 to $0.85
Aggressive entry: $0.85 to $0.96
Target: 50% to 100%
Stop Loss: $0.6811 (Since the SL is significantly lower than the current market price, keep your position small and consider adding more on dips if you like the setup.)
The strategy is to enter slowly and always keep your leverage low.
This applies to every setup I share.
DYOR, NFA
Please hit the like button if you want me to post more.
Thank you
#PEACE

ONDO/USDT bullish Pennant expecting breakout? 👀🚀💎 Paradisers, take note: #ONDOUSDT is currently trading within a bullish pennant pattern, suggesting a high probability of an upward breakout.
💎 Currently, #ONDO is testing the resistance of the pennant. If the price successfully breaks out and sustains momentum, there's a strong likelihood of a robust upward move targeting our predetermined resistance levels.
💎 Considering market volatility, should the price of LSE:ONDO lose momentum and break below the pennant's support, this could indicate a weakening of the bullish trend, potentially leading to a significant price decline.
MyCryptoParadise
iFeel the success🌴

ONDO 120% potential?I want to remind you how market volatility works, from decreasing volatility to sudden increases. ONDO is consolidating into a triangle, and volatility is decreasing. Be prepared for an impulse, especially if the market shows strength; ONDO could easily show 100-120% growth. Keep an eye on it. Currently it is one of the strongest asset in the market.
