#ONDO/USDT#ONDO
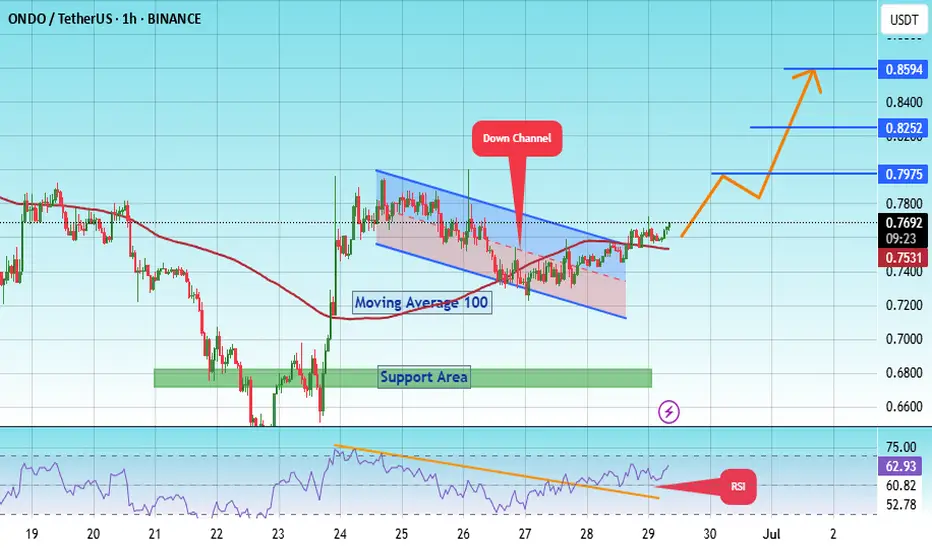
The price is moving within a descending channel on the 1-hour frame, adhering well to it, and is heading for a strong breakout and retest.
We have a bounce from the lower boundary of the descending channel. This support is at 0.7220.
We have a downtrend on the RSI indicator that is about to be broken and retested, supporting the upside.
There is a major support area in green at 0.6757, which represents a strong basis for the upside.
Don't forget a simple thing: ease and capital.
When you reach the first target, save some money and then change your stop-loss order to an entry order.
For inquiries, please leave a comment.
We have a trend to hold above the 100 Moving Average.
Entry price: 0.7975
First target: 0.7975
Second target: 0.8252
Third target: 0.8600
Don't forget a simple thing: ease and capital.
When you reach the first target, save some money and then change your stop-loss order to an entry order.
For inquiries, please leave a comment.
Thank you.
Ondobtc
#ONDO/USDT#ONDO
The price is moving within a descending channel on the 1-hour frame, adhering well to it, and is heading for a strong breakout and retest.
We are experiencing a rebound from the lower boundary of the descending channel, which is support at 0.9200.
We are experiencing a downtrend on the RSI indicator, which is about to break and retest, supporting the upward trend.
We are looking for stability above the 100 moving average.
Entry price: 0.9700
First target: 1.013
Second target: 1.048
Third target: 1.093

ONDO 4H – Fake Breakdown Reversed, Bullish Momentum BuildsBYBIT:ONDOUSDT is exhibiting a strong bullish reversal pattern on the 4H chart, aligning with the broader ascending channel observed on the daily timeframe. After a brief deviation below the channel, which acted as a bear trap, the price swiftly re-entered the channel and broke above the descending resistance trendline. This move indicates a resurgence of buyer strength and a potential shift in market sentiment.
Following the breakout, COINBASE:ONDOUSD has been consolidating above the broken trendline and the ascending channel's support, suggesting that the previous dip was a false breakdown. This consolidation phase often precedes significant upward movements. If the bullish momentum continues, we can anticipate ONDOUSDT targeting the mid-channel resistance around 1.40, with the possibility of challenging the 2.00 zone or even reaching new all-time highs.
On the fundamental front, Ondo Finance has recently made headlines by engaging in discussions with the U.S. Securities and Exchange Commission (SEC) regarding the tokenization of U.S. securities. This strategic move aims to bridge traditional finance with blockchain technology, enhancing the project's credibility and long-term growth prospects.
🔔 Follow for real-time updates!

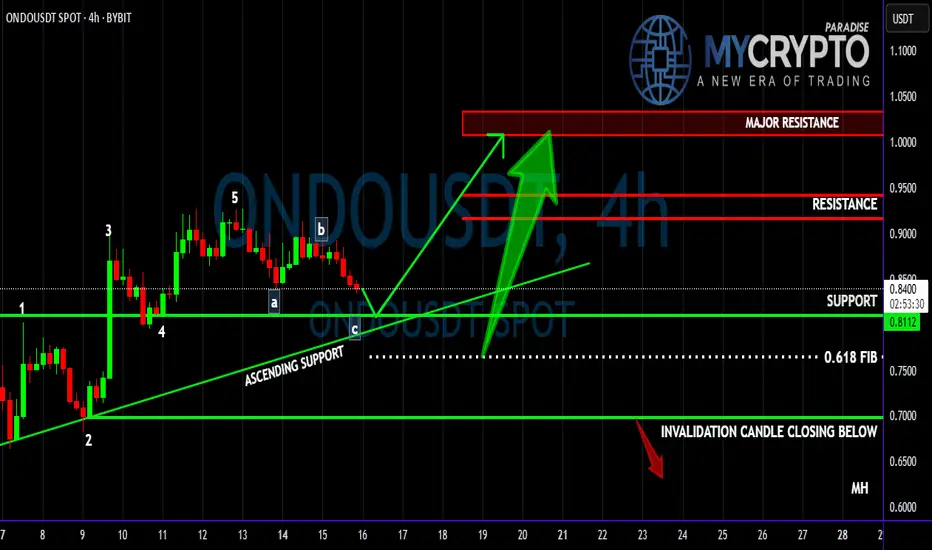
Is ONDO About to Crash Before the Next Big Rally? Yello Paradisers, are you ready for the next big #ONDOUSDT move, or will you be caught off guard by the next dump? Let’s break down what’s really happening here before it’s too late.
💎#ONDOUSDT has been following a clear Elliott Wave impulse structure. After completing the 5th wave of the impulse move, we’ve now entered the corrective phase. So far, the A and B waves have already played out, and now the C wave seems to be on its way — likely heading toward a key support area around 0.8112.
💎This support level is not just psychological — it also aligns perfectly with a well-respected ascending trendline, giving the level even more technical confluence. If buyers step in strongly here, this could be the launching point for the next impulsive bullish leg.
💎However, if the 0.8112 zone fails to hold, there’s a high probability we could see a deeper correction — potentially down toward the 0.618 Fibonacci level. This would still be a technically valid correction and might attract even stronger buying interest.
💎On the flip side, confirmation of bullish continuation would come once the pair regains momentum from the support zone and pushes towards the higher resistance levels. Watch closely for reactions in those zones — they will dictate the strength of the next leg up.
💎The invalidation of this bullish structure would be confirmed if we get a candle close below 0.6967. This would mean a break below both the ascending trendline and the 2nd wave of the Elliott impulse — a clear sign to reassess the structure.
Strive for consistency, not quick profits. Treat the market as a businessman, not as a gambler. Stay sharp and follow the structure — it's unfolding right in front of us, Paradisers.
MyCryptoParadise
iFeel the success🌴
#ONDO/USDT#ONDO
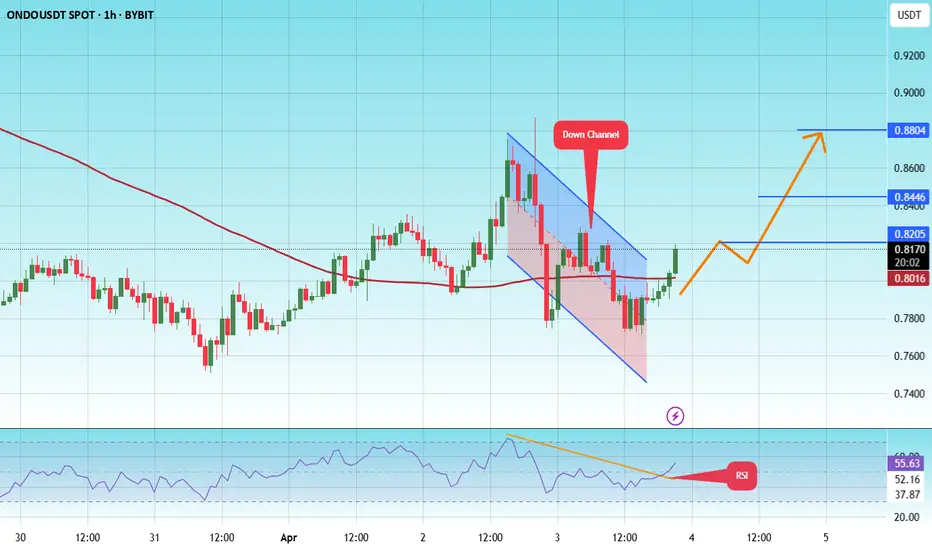
The price is moving within a descending channel on the 1-hour frame and is expected to continue upward.
We have a trend to stabilize above the 100 moving average once again.
We have a downtrend on the RSI indicator that supports the upward move with a breakout.
We have a support area at the lower boundary of the channel at 0.7600.
Entry price: 0.8200
First target: 0.8200
Second target: 0.8446
Third target: 0.8800
ONDO looks bullish (1D)ONDO appears to be in wave D of a larger pattern (possibly a triangle).
Wave D seems to be a diametric or symmetrical structure. This diametric may complete in the green zone, leading to an upward reversal.
We are looking for buy/long positions in the green zone. Targets are marked on the chart.
A daily candle closing below the invalidation level will invalidate this analysis
For risk management, please don't forget stop loss and capital management
When we reach the first target, save some profit and then change the stop to entry
Comment if you have any questions
Thank You

#ONDO/USDT#ONDO
The price is moving in a descending channel on the 1-hour frame and is adhering to it well and is heading to break it strongly upwards and retest it
We have a rebound from the lower limit of the descending channel, this support is at a price of 0.7550
We have a downtrend on the RSI indicator that is about to be broken and retested, which supports the rise
We have a trend to stabilize above the moving average 100
Entry price 0.8180
First target 0.8890
Second target 0.9588
Third target 1.034

#ONDO/USDT #ONDO
The price is moving in a descending channel on the 1-hour frame and sticking to it well
We have a bounce from the lower limit of the descending channel, this support is at a price of 1.25
We have a downtrend on the RSI indicator that is about to be broken, which supports the rise
We have a trend to stabilize above the moving average 100
Entry price 1.42
First target 1.51
Second target 1.64
Third target 1.76

ONDO looks bullish (8H)ONDO seems to be in a complex correction.
As long as the green zone holds, it can move upward. The target could be the red box or even the hunt-in box.
A daily candle closing below the invalidation level will invalidate this analysis
invalidation level: 1.19$
For risk management, please don't forget stop loss and capital management
Comment if you have any questions
Thank You

ONDO ANALYSIS (4H)From the point marked as "start" on the chart, it seems the ONDO correction has begun.
This correction appears to be a diametric pattern.
If it reaches our entries, we will open positions.
The targets are specified on the chart.
Closing a daily candle below the invalidation level could invalidate this analysis.
For risk management, please don't forget stop loss and capital management
Comment if you have any questions
Thank You

Are ONDO Bulls Preparing for a Major Comeback?Yello, Paradisers! Is the recent breakdown in #ONDOUSDT just a trap to shake out weak hands? The price action is hinting at a potential manipulation move, and if bulls can reclaim a key level, we could be in for a speedy reversal. Let’s dive into the key areas that will make or break this move.
💎A few days ago, #ONDO breached a key support level, but interestingly, this breakdown didn’t trigger any major sell-off. This lack of follow-through from sellers is an early clue that this could be a deviation—a classic shakeout move to trap shorts before sending the price higher.
💎Now, ONDO is about to test a critical resistance zone between $1.30 and $1.34. If bulls can reclaim this level, the deviation will be confirmed, and we could see a strong bullish reversal kick in.
💎If bulls manage to break above $1.34 level, then a quick move towards the $1.60 level is highly likely, followed by a move towards the strong resistance zone between $1.70 and $1.75. This upper resistance zone is key because it aligns with the 0.618 Fibonacci retracement level, which is known to trigger heavy profit-taking. We’ve seen it time and time again—this level tends to attract sellers, so caution is warranted if the price approaches this area.
💎On the downside, ONDO currently has strong support between $1.10 and $1.15, a zone that has consistently attracted buyers. The repeated reactions from this support suggest that buyers are actively defending this level, which could give bulls the confidence to push through the immediate resistance above.
Paradisers, this setup is looking very promising—but don’t forget, discipline and patience are key in this market.
MyCryptoParadise
iFeel the success🌴


ONDOUSDT Analysis: Promising Buy ZoneThe blue box highlighted on the chart represents a key demand zone and could serve as an excellent buying opportunity for ONDOUSDT. This area is carefully selected using advanced market analysis tools.
Key Highlights:
Demand Zone: The blue box is a high-probability reaction area where buyers may become active.
Market Context: Keep an eye on overall market sentiment and conditions to align your strategy.
Confirmation Indicators:
To ensure precision, I utilize CDV, liquidity heatmap, volume profile, volume footprint , and upward market structure breaks on lower time frames when trading the blue box.
Learn My Techniques:
Interested in mastering these strategies? DM me to learn how to effectively use advanced trading tools like CDV and liquidity heatmaps.
Risk Management:
Always manage your risk carefully and approach the market with a disciplined mindset. Good luck!
If you think this analysis helps you, please don't forget to boost and comment on this. These motivate me to share more insights with you!
I keep my charts clean and simple because I believe clarity leads to better decisions.
My approach is built on years of experience and a solid track record. I don’t claim to know it all, but I’m confident in my ability to spot high-probability setups.
If you would like to learn how to use the heatmap, cumulative volume delta and volume footprint techniques that I use below to determine very accurate demand regions, you can send me a private message. I help anyone who wants it completely free of charge.
My Previous Analysis (the list is long but I think it's kinda good : )
🎯 ZENUSDT.P: Patience & Profitability | %230 Reaction from the Sniper Entry
🐶 DOGEUSDT.P: Next Move
🎨 RENDERUSDT.P: Opportunity of the Month
💎 ETHUSDT.P: Where to Retrace
🟢 BNBUSDT.P: Potential Surge
📊 BTC Dominance: Reaction Zone
🌊 WAVESUSDT.P: Demand Zone Potential
🟣 UNIUSDT.P: Long-Term Trade
🔵 XRPUSDT.P: Entry Zones
🔗 LINKUSDT.P: Follow The River
📈 BTCUSDT.P: Two Key Demand Zones
🟩 POLUSDT: Bullish Momentum
🌟 PENDLEUSDT.P: Where Opportunity Meets Precision
🔥 BTCUSDT.P: Liquidation of Highly Leveraged Longs
🌊 SOLUSDT.P: SOL's Dip - Your Opportunity
🐸 1000PEPEUSDT.P: Prime Bounce Zone Unlocked
🚀 ETHUSDT.P: Set to Explode - Don't Miss This Game Changer
🤖 IQUSDT: Smart Plan
⚡️ PONDUSDT: A Trade Not Taken Is Better Than a Losing One
💼 STMXUSDT: 2 Buying Areas
🐢 TURBOUSDT: Buy Zones and Buyer Presence
🌍 ICPUSDT.P: Massive Upside Potential | Check the Trade Update For Seeing Results
🟠 IDEXUSDT: Spot Buy Area | %26 Profit if You Trade with MSB
📌 USUALUSDT: Buyers Are Active + %70 Profit in Total
🌟 FORTHUSDT: Sniper Entry +%26 Reaction
🐳 QKCUSDT: Sniper Entry +%57 Reaction
📊 BTC.D: Retest of Key Area Highly Likely
I stopped adding to the list because it's kinda tiring to add 5-10 charts in every move but you can check my profile and see that it goes on..


ONDOUSDT Hits New ATH – 200% Rally Ahead?ONDOUSDT Technical analysis update
BYBIT:ONDOUSDT has reached a new all-time high (ATH) after 185 days of consolidation. The price has surged over 180% from its previous bottom, demonstrating strong bullish momentum. With the breakout supported by increased trading volume, ONDO shows potential for another 100-200% move in the coming days.

ONDO Looks BullishFrom where we put the red arrow on the chart, it seems that the ONDO correction has started, and where we put the green arrow, it seems that the ONDO correction has ended and entered the bullish phase of Sat.
This correction looks like an X wave.
The bullish phase looks like an ABC, as we are now in wave B.
Wave B looks like a triangle as we are now in wave d of B. The best place to rebuy is the green range.
The targets are marked on the chart.
Closing a daily candle below the invalidation level will violate the analysis
For risk management, please don't forget stop loss and capital management
When we reach the first target, save some profit and then change the stop to entry
Comment if you have any questions
Thank You

ONDO UPDATE (12H)This analysis is an update of the analysis you see in the "Related Ideas" section
According to the previous analysis, we were in the F wave of Diametric, and the price hit the red range of the previous analysis and was rejected downwards.
But what is on the chart, the F wave developed and took more time so now the G wave can have a good launch power. The price has recently entered the G wave.
When ONDO reaches the first target, save some profit and place the stop on entry.
The targets are clear on the chart.
Closing a daily candle below the invalidation level will violate the analysis.
For risk management, please don't forget stop loss and capital management
When we reach the first target, save some profit and then change the stop to entry
Comment if you have any questions
Thank You

#ONDO/USDT#ONDO
The price is moving within a descending channel pattern on the 1-hour frame and is expected to rise after it has been largely committed to it
We have a downtrend on the RSI indicator that is expected to break upwards and we have a tendency to stabilize above it
We have a major support level in green at a price of 0.9200
We have a tendency to stabilize above the moving average 100
Entry price 0.9300
First target 0.9613
Second target 0.9925
Third target 1.03

ONDO buy setupONDO is doing internal pullback.
The larger structure is bullish. Therefore, we can look for buy/long positions in demand areas.
By maintaining the green range, it can move towards the targets.
We have specified the targets on the chart.
Closing a daily candle below the invalidation level will violate the analysis.
Note that the financial market is risky, so:
Do not enter a position without setting a stop and capital management and confirmation and trigger.
When we reach the first TP, save some profit and try to move the stop continuously in the direction of your profit.
If you have any comments please post them, comments will help us improve our performance
Thanks

ONDOONDO / USDT
ONDO one of few coins that showed strength in current boring / bearish season
Its being accumulated in falling wedge and above MA / bullish trendline since long time
As long as these bullish patterns are holding priority is bullish
The best approach for buying it if market give us another dip towards the trendline then a bullish bounce with easy invalidation at that point or after breakout confirmation of the falling wedge overall looks bullish

ONDO looks bearishWe have a bear CH on the chart. The price then moved back up and swept the sell orders.
It seems that now the price can be rejected towards the lower areas.
The targets are clear on the chart.
Closing a daily candle above the invalidation level will violate the analysis.
Note that the financial market is risky, so:
Do not enter any position without confirmation and trigger.
Do not enter a position without setting a stop.
Do not enter a position without capital management.
When we reach the first TP, save some profit and try to move the stop continuously in the direction of your profit.
If you have any comments please post them, comments will help us improve our performance
Thanks

ONDO tries to breakout !ONDO / USDT
In LTF price is trying to breakout the mega phone pattern
If price will able to hold above resistance line in next few hours we can another bullish wave

$ONDO HAS NEVER BROKEN THIS RESISTANCE | ATH SOON | LONGOndo Finance has never broken this bottom resistance in this multi-tier ascending channel I have been tracking. I admit, my chart is messy and complicated. I have been tracking many patterns here, but all of them are bullish.
ONDO has been resilient during this current Bitcoin crash and recovery. The price has continued trading in a range from the.60s to $1. Finally, it has stabilized in the.75–.90 range. The price is coming much closer to testing the bottom resistance line of the channel, which has never broken.
I am bullish on the price of ONDO, but it will depend on overall market sentiment. Whether up or down, I know for sure that a large move is coming. Wait for a bounce and confirmation to enter a long position or to buy a spot position. A breakout here would send us up to ATH's around 1.05.
