ONDO:What are the implications of being listed on an exchange?Hello friends🙌
What are the implications of being listed on an exchange?
✅Well, the first question that comes to mind when a currency is listed on an exchange is what impact does it have? Will the price be pumped or dumped? Let's examine it together.
✅Well, many currencies are listed on exchanges, and not every currency that is listed is necessarily pumped or dumped.
Many factors are involved in this, the most important of which is the chart.
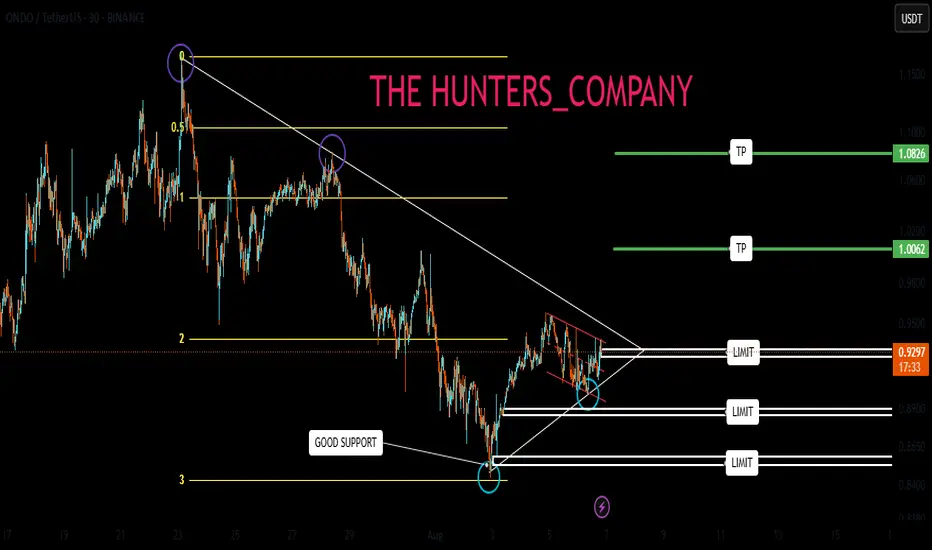
✅So, if we look at the chart of this currency in the 30-minute time frame, which can be considered a short-term time frame, we see that we had a decline due to the selling pressure in the market for the past few days, and now we see that in the third leg of the Fibonacci, buyers supported the price and created higher lows.
✅Now, these higher lows alone are not enough for us to buy, we need other confirmations, the most important of which is a valid breakdown of the identified resistance.
By breaking this resistance validly, we can buy in the areas we have identified for you in a stepwise manner, with capital and risk management, and move towards the specified goals.
If it fails to break the specified resistance and the buyers do not have enough power, we will refrain from buying it.
✅So this was the listing of currencies on the exchange and its impact on the currency price.✅
🔥Follow us for more signals🔥
*Trade safely with us*
ONDOUSD
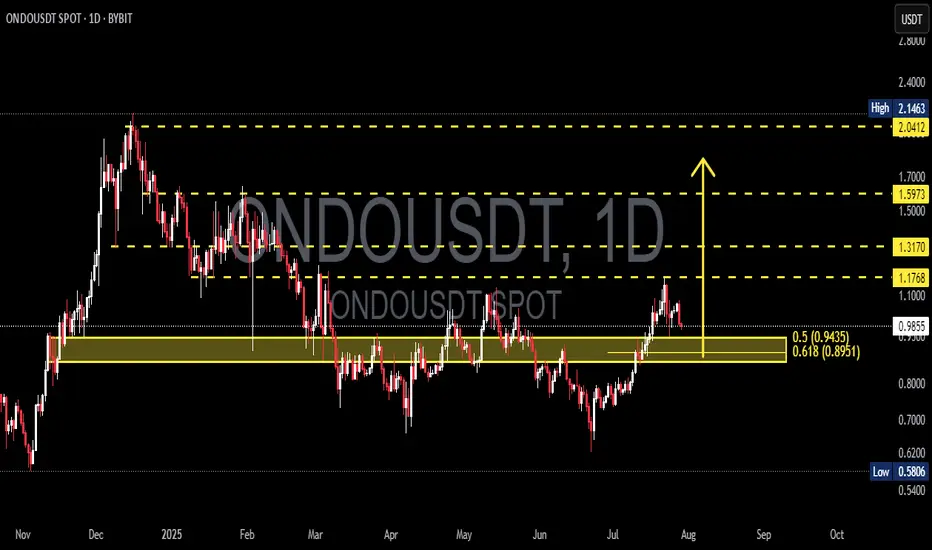
ONDOUSDT at a Critical Fibonacci Zone! Will Move Toward $2+?ONDOUSDT is currently trading at a critical technical zone — the Fibonacci Retracement Golden Pocket (0.5–0.618) — following a significant upward rally. Historically, this zone often acts as a high-probability reversal area, or at the very least, a zone for major consolidation before the next big move.
---
🧠 Market Structure & Price Action
After reaching a local high near $1.17, price retraced and is now approaching the key support zone between $0.9435 (Fib 0.5) and $0.8951 (Fib 0.618).
This zone also coincides with a previous strong resistance, which could now act as new support (role reversal).
Current price action shows selling pressure, but there is no confirmed breakdown from the Golden Pocket yet.
---
🧩 Pattern Recognition & Key Levels
Potential Reversal Pattern: Look for a bullish falling wedge or descending channel on lower timeframes as a signal for reversal.
Demand Zone (Yellow Box): The zone between $0.8951–$0.9435 is reinforced by horizontal price structure support.
Layered Resistance Levels:
$1.1768 → Recent swing high
$1.3170 → Mid-range resistance
$1.5973 → Psychological and retracement target
$2.0412 → Range top / full recovery zone
Minor Support: If the Golden Pocket fails, potential downside targets include $0.70 and the major low at $0.5806.
---
📈 Bullish Scenario
✅ Strong bounce from the Golden Pocket
✅ Bullish candlestick confirmation (e.g., bullish engulfing or pin bar)
✅ Rising volume showing buyer presence
✅ Break above $1.1768 would signal continuation toward:
🎯 Target 1: $1.3170
🎯 Target 2: $1.5973
🎯 Target 3: $2.0412 (full structural recovery)
---
📉 Bearish Scenario
❌ If price breaks below $0.8951 with a strong bearish candle and high volume:
The structure shifts bearish, increasing risk of a drop to $0.70 – $0.62
Worst-case scenario: retest of $0.5806, the major bottom
Bullish structure invalidated upon confirmed breakdown
---
🎯 Strategy & Takeaway
ONDOUSDT is currently in a "make or break" zone. The Golden Pocket between $0.895–$0.943 could either:
Act as a springboard for the next bullish leg,
Or fail, triggering a deeper correction.
Traders should wait for confirmation via:
Candlestick patterns
Volume breakout/inflow
Break above or below the key structure
This area offers a high-reward, controlled-risk setup for swing traders, with invalidation just below the Golden Pocket.
---
📌 Summary of Key Levels
Level Description
$0.9435 Fibonacci 0.5 (support)
$0.8951 Fibonacci 0.618 (Golden Pocket)
$1.1768 Minor resistance
$1.3170 Mid-level resistance
$1.5973 Bullish target
$2.0412 Major resistance / recovery top
$0.5806 Extreme support (macro low)
#ONDOUSDT #CryptoTechnicalAnalysis #GoldenPocket #FibonacciLevels #CryptoTrading #SupportResistance #BullishSetup #BearishScenario #SwingTrade #AltcoinAnalysis
Ondo USDT SCALP TRADEIF this 4hr fvg breaks then I will look for short, otherwise expecting to hold this level and wipe out previous liquidation.

ONDO/USDT Breakout Watch – Reversal Incoming
🔍 Overview:
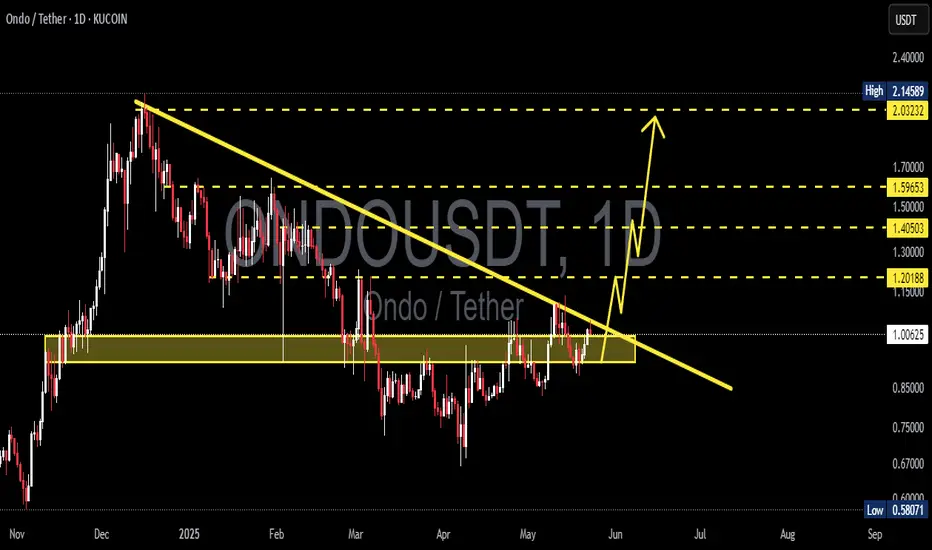
The ONDO/USDT pair is currently at a critical inflection point. After months of being suppressed in a downtrend, price action is now testing a major descending trendline that has capped the market since the peak in December 2024. A breakout here could be the beginning of an explosive bullish phase — but failure might confirm further downside.
📉 Pattern: Descending Trendline Compression
ONDO has been forming consistent lower highs, creating a clear descending trendline structure.
Price is now pressing against this resistance, attempting a breakout with a strong 2D candle.
A confirmed breakout will occur once ONDO closes above $0.916 on the 2D chart, which also acts as a horizontal resistance.
✅ Bullish Scenario – The Start of a Mid-Term Reversal?
If the breakout is confirmed, we could see strong upward momentum, as there’s relatively little resistance in the upper zones.
🎯 Potential Targets:
1. $1.11 – First psychological and technical resistance.
2. $1.327 – Previous consolidation zone from Feb–Mar 2025.
3. $1.577 – Major supply zone before the heavy correction started.
4. $2.045 - $2.145 – All-time high area, the ultimate mid-to-long-term target.
📈 Note: Although not shown in this chart, RSI is likely leaving oversold territory, supporting the bullish momentum shift.
❌ Bearish Scenario – Classic Bull Trap Ahead?
If price fails to break and close above the trendline and $0.916, this could turn into a fakeout or bull trap.
📉 Possible downside levels:
$0.8399 – Minor support currently holding.
$0.70 – Strong horizontal demand zone.
$0.53 – Long-term support base, potential double bottom zone.
If momentum fades here, ONDO could revisit these lower areas before finding a true bottom.
🧠 Sentiment & Trading Strategy:
Breakout confirmation: Wait for a solid 2D candle close above the descending trendline and $0.916. Look for volume spike.
Conservative strategy: Enter on break + retest of the trendline, with SL below $0.83 and multi-level TPs.
Aggressive strategy: Enter on the initial breakout with dynamic trailing stops and resistance-based targets.
🏁 Conclusion:
ONDO/USDT is at a make-or-break moment. A confirmed breakout from this long-term descending structure may trigger a strong reversal with over 100% potential upside. However, if the market rejects this breakout attempt, it could extend its bearish trajectory.
Patience, confirmation, and disciplined risk management are key here.
📌 Key Levels to Watch:
Support: $0.8399 – $0.70 – $0.53
Resistance: $0.916 – $1.11 – $1.327 – $1.577 – $2.045 – $2.145
#ONDO #ONDOUSDT #CryptoBreakout #BullishSetup #AltcoinAnalysis #CryptoReversal #TradingViewSignals #TechnicalBreakout #DescendingTrendline #PriceAction

ONDOThis this my Candlestick Technical Analysis based on Bullish Engulfing. If we see and Same Pattern then the market will Bonus.

Ondo Scalp trade take with sl , this is a 5m scalp trade, So take it at your own risk with small amount

#Ondo Finance this is a possible scenario of how #ondo could play out this cycle if all goes well…. Not financial advice DCA safely

#ONDO/USDT#ONDO
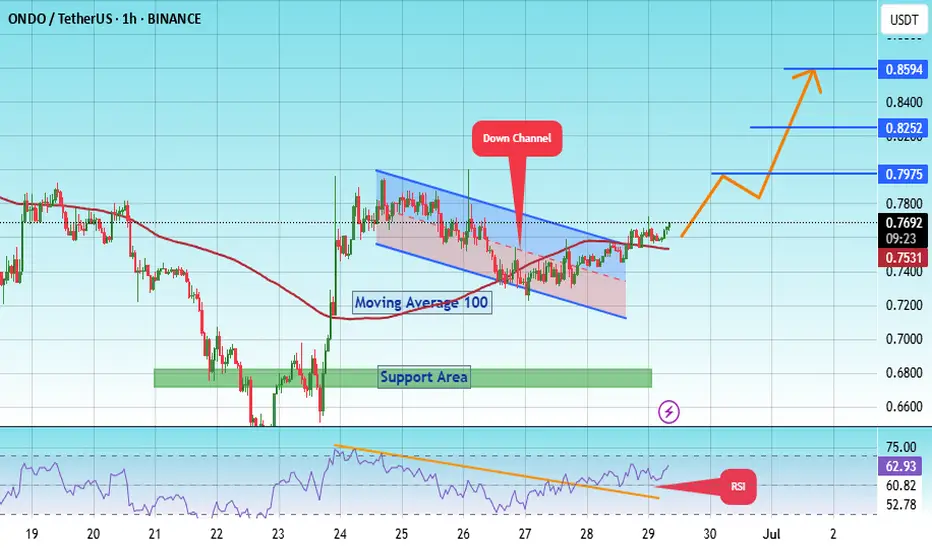
The price is moving within a descending channel on the 1-hour frame, adhering well to it, and is heading for a strong breakout and retest.
We have a bounce from the lower boundary of the descending channel. This support is at 0.7220.
We have a downtrend on the RSI indicator that is about to be broken and retested, supporting the upside.
There is a major support area in green at 0.6757, which represents a strong basis for the upside.
Don't forget a simple thing: ease and capital.
When you reach the first target, save some money and then change your stop-loss order to an entry order.
For inquiries, please leave a comment.
We have a trend to hold above the 100 Moving Average.
Entry price: 0.7975
First target: 0.7975
Second target: 0.8252
Third target: 0.8600
Don't forget a simple thing: ease and capital.
When you reach the first target, save some money and then change your stop-loss order to an entry order.
For inquiries, please leave a comment.
Thank you.
ONDO/USDT 2D – Falling Wedge Breakout in Play?ONDO/USDT is currently forming a highly compelling structure on the 2-day timeframe. Price action suggests a possible breakout from a falling wedge pattern, which is typically a bullish reversal signal.
🔹 Strong Support Zone:
The price continues to respect a significant accumulation zone between 0.65 – 0.73 USDT, which has held as a major support area since September 2023. Multiple successful retests reinforce its strength.
🔹 Descending Trendline Breakout:
The descending resistance line (yellow trendline), connecting lower highs since December 2023, is being tested and appears to be breaking. A confirmed breakout could trigger a strong bullish reversal.
🔹 Potential Upside Targets (Based on Structure and Fibonacci Projections):
TP1: 0.81211 (breakout confirmation level)
TP2: 1.13111 (key horizontal resistance)
TP3: 1.56596 (technical extension zone)
TP4: 2.04123 – 2.14522 (major historical resistance and previous swing high)
🔹 Trade Idea:
Conservative Entry: Buy the retest near 0.73–0.75 USDT after breakout confirmation
Stop Loss: Below the key support zone, around 0.65 USDT
Risk to Reward: Very favorable, with upside potential exceeding +160%
🔹 Confirmation Tips:
Look for a clean breakout with increased volume and a candle body closing above the trendline. A breakout + retest scenario provides higher probability for trend continuation.

ONDOUSDT 1D AnalysisONDO ~ 1D Analysis
#ONDO Buy back on a retest of this support block with a short term target of at least 15%+ from here. Long term target $2.1

ONDO (Daily) Elliot Wave ii UnderwayONDO appears to have completed a leading diagonal for wave 1 after finding a bottom at the major support high volume node (HVN).
Wave 2 has retraced to the expected alt coin Golden Pocket at the 78.6% retracement tapping high volume node.
The descending resistance line has been tested as support leaving a dragonfly doji but does not look strong enough to be the bottom yet.
Wave 3 should be a powerful move up.
This analysis is invalidated below macro wave 2 -$0.65
Safe trading

ONDOUSDT 1D AnalysisONDO ~ 1D Analysis
#ONDO Buy gradually at this support block with a short term target of at least 15%++ from here.
THESE ALTS can +100% | ALTSEASON PART2️⃣Altseason usually happens when BTC trades close towards a new ATH, as it is doing now, and takes some time to stall/trade sideways
Now this season is working a little differently. Usually ETH makes its way towards new highs, but we haven't seen that just yet. Ethereum has HUGE upside potential still.
It's hard to say just how high Ethereum can go, but what we do know is that it's still 88% away from the previous ATH, and due for a new one...
ENA is another alt with big upside potential, from it's previous peak its more than 200% away:
Solana has made a strong V-shaped recovery and if ETH is primed for new ATH, SOL is sure to follow:
TRUMPcoin may be memecoin, but the again so is PEPE! Still big upside after a long while of range trading here:

Important Point: 1.0113
Hello, traders.
If you "Follow", you can always get new information quickly.
Have a nice day today.
-------------------------------------
(ONDOUSDT.P 1D chart)
The 1.0113 point is the HA-Low indicator point on the 1D chart.
Therefore, if it is supported near 1.0113, it is a time to buy.
If it is supported at the 1.0113 point and rises,
1st: 1.2715
2nd: 1.8588
You need to respond depending on whether there is support near the 1st and 2nd above.
-
If it fails to receive support at the 1.0113 point, you need to check whether there is support near 0.8292.
The support zone is around 0.5911.
-
The location of the 1.0113 point is a point where a breakout trade is possible.
However, caution is required because the StochRSI indicator is showing signs of entering the overbought zone.
Therefore, it is recommended to check the support near 1.0113 and then decide on the trading point.
-
(30m chart)
As seen in the 30m chart, it is currently located near the HA-High indicator.
In other words, it is showing a stepwise upward trend.
The indicators that play an important role in finding trading strategies and trading points are the HA-Low and HA-High indicators.
Therefore, when it is supported by the HA-High indicator and rises, it is necessary to aggressively buy and respond quickly with the thought that it can fall at any time.
-
Thank you for reading to the end.
I hope you have a successful trade.
--------------------------------------------------
- Explanation of the big picture.
I used TradingView's INDEX chart to check the entire range of BTC.
I rewrote it to update the previous chart by touching the Fibonacci ratio range of 1.902(101875.70) ~ 2(106275.10).
(Previous BTCUSD 12M chart)
Looking at the big picture, it seems to have been maintaining an upward trend following a pattern since 2015.
In other words, it is a pattern that maintains a 3-year uptrend and faces a 1-year downtrend.
Accordingly, the uptrend is expected to continue until 2025.
-
(Current BTCUSD 12M chart)
Based on the currently written Fibonacci ratio, it is displayed up to 3.618 (178910.15).
It is expected that it will not fall again below the Fibonacci ratio of 0.618 (44234.54).
(BTCUSDT 12M chart)
Based on the BTCUSDT chart, I think it is around 42283.58.
-
I will explain it again with the BTCUSD chart.
The Fibonacci ratio ranges marked in the green boxes, 1.902 (101875.70) ~ 2 (106275.10) and 3 (151166.97) ~ 3.14 (157451.83), are expected to be important support and resistance ranges.
In other words, it seems likely that they will act as volume profile ranges.
Therefore, in order to break through these ranges upward, I think the point to watch is whether they can receive support and rise near the Fibonacci ratios of 1.618 (89126.41) and 2.618 (134018.28).
Therefore, the maximum rising range in 2025 is expected to be the 3 (151166.97) ~ 3.14 (157451.83) range.
In order to do that, we need to see if it is supported and rises near 2.618 (134018.28).
If it falls after the bull market in 2025, we don't know how far it will fall, but based on the previous decline, we expect it to fall by about -60% to -70%.
Therefore, if it starts to fall near the Fibonacci ratio 3.14 (157451.83), it seems likely that it will fall to around Fibonacci 0.618 (44234.54).
I will explain more details when the bear market starts.
------------------------------------------------------

#ONDO/USDT#ONDO
The price is moving within a descending channel on the 1-hour frame, adhering well to it, and is heading for a strong breakout and retest.
We are experiencing a rebound from the lower boundary of the descending channel, which is support at 0.9200.
We are experiencing a downtrend on the RSI indicator, which is about to break and retest, supporting the upward trend.
We are looking for stability above the 100 moving average.
Entry price: 0.9700
First target: 1.013
Second target: 1.048
Third target: 1.093

ONDO 4H – Fake Breakdown Reversed, Bullish Momentum BuildsBYBIT:ONDOUSDT is exhibiting a strong bullish reversal pattern on the 4H chart, aligning with the broader ascending channel observed on the daily timeframe. After a brief deviation below the channel, which acted as a bear trap, the price swiftly re-entered the channel and broke above the descending resistance trendline. This move indicates a resurgence of buyer strength and a potential shift in market sentiment.
Following the breakout, COINBASE:ONDOUSD has been consolidating above the broken trendline and the ascending channel's support, suggesting that the previous dip was a false breakdown. This consolidation phase often precedes significant upward movements. If the bullish momentum continues, we can anticipate ONDOUSDT targeting the mid-channel resistance around 1.40, with the possibility of challenging the 2.00 zone or even reaching new all-time highs.
On the fundamental front, Ondo Finance has recently made headlines by engaging in discussions with the U.S. Securities and Exchange Commission (SEC) regarding the tokenization of U.S. securities. This strategic move aims to bridge traditional finance with blockchain technology, enhancing the project's credibility and long-term growth prospects.
🔔 Follow for real-time updates!

All I have to say about ONDO is 'own it!'ONDO has an incredibly bright future, and people are going to regret not owning it on a level rivaled only by Bitcoin.
Good luck, and always use a stop-loss!

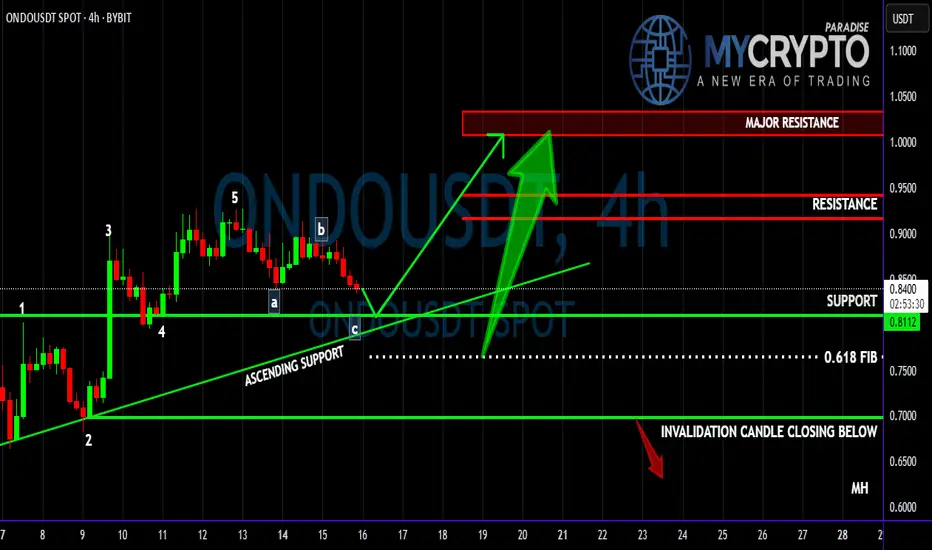
Is ONDO About to Crash Before the Next Big Rally? Yello Paradisers, are you ready for the next big #ONDOUSDT move, or will you be caught off guard by the next dump? Let’s break down what’s really happening here before it’s too late.
💎#ONDOUSDT has been following a clear Elliott Wave impulse structure. After completing the 5th wave of the impulse move, we’ve now entered the corrective phase. So far, the A and B waves have already played out, and now the C wave seems to be on its way — likely heading toward a key support area around 0.8112.
💎This support level is not just psychological — it also aligns perfectly with a well-respected ascending trendline, giving the level even more technical confluence. If buyers step in strongly here, this could be the launching point for the next impulsive bullish leg.
💎However, if the 0.8112 zone fails to hold, there’s a high probability we could see a deeper correction — potentially down toward the 0.618 Fibonacci level. This would still be a technically valid correction and might attract even stronger buying interest.
💎On the flip side, confirmation of bullish continuation would come once the pair regains momentum from the support zone and pushes towards the higher resistance levels. Watch closely for reactions in those zones — they will dictate the strength of the next leg up.
💎The invalidation of this bullish structure would be confirmed if we get a candle close below 0.6967. This would mean a break below both the ascending trendline and the 2nd wave of the Elliott impulse — a clear sign to reassess the structure.
Strive for consistency, not quick profits. Treat the market as a businessman, not as a gambler. Stay sharp and follow the structure — it's unfolding right in front of us, Paradisers.
MyCryptoParadise
iFeel the success🌴
ONDOUSDT 1DONDO ~ 1D Analysis
#ONDO Buy gradually from here if you still have a Conviction on this coin with a short -term target of at least 10%+ from here.

ONDOUSDT 1DONDO ~ 1D Analysis
#ONDO Buy after successfully penetrating the resistant line of this pattern, with a short -term target of at least 10%+.

Is ONDO Gearing Up for a Massive Breakout or Just a Bull Trap?Yello, Paradisers! Is #ONDO setting up for a bullish explosion, or is this just the calm before another dump? Here's what the current price action is signaling, and why this zone could be the final opportunity before a major move…
💎ONDOUSD has remained one of the strongest-performing altcoins, even amid broader market corrections. Since peaking in December, however, it has entered a healthy corrective phase. Currently, the price is forming a falling wedge pattern, and the ABC zigzag correction appears to have completed — an early sign of potential trend reversal.
💎#ONDOUSDT is currently consolidating above a moderate support zone between 0.766 and 0.70, a level that has held firmly since early March. This repeated defense of support, along with the completed correction, is reinforcing the potential shift in market sentiment.
💎If bullish momentum starts building, price is likely to aim towards the descending resistance around the 0.90 level. A confirmed breakout above this area would flip market structure bullish, potentially igniting a trend continuation toward the next resistance range between 1.10 and 1.20.
💎Should this breakout sustain and strength remain, ONDO could target the strong resistance zone between 1.40 and 1.50, which also aligns with the 50% Fibonacci retracement — a critical level where sellers are likely to return.
Paradisers, strive for consistency, not quick profits. Treat the market as a businessman, not as a gambler.
MyCryptoParadise
iFeel the success🌴

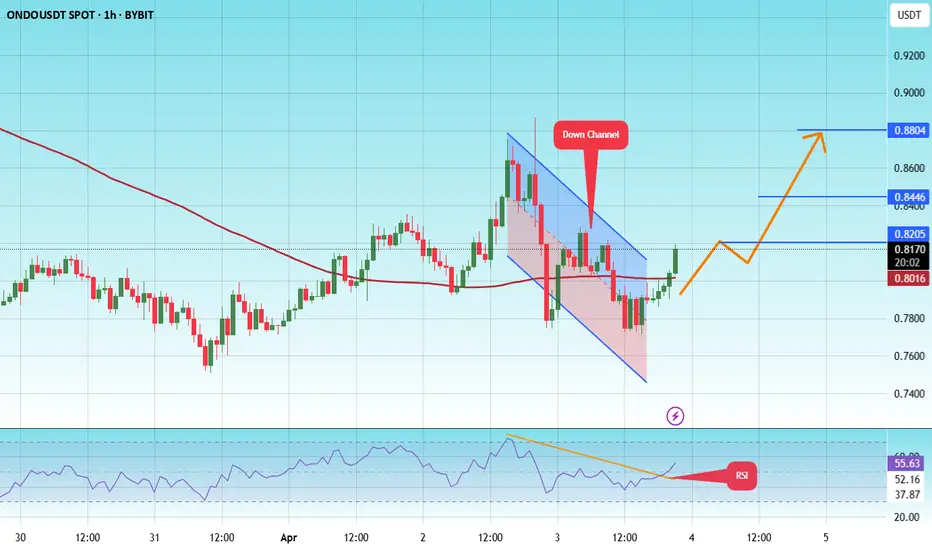
#ONDO/USDT#ONDO
The price is moving within a descending channel on the 1-hour frame and is expected to continue upward.
We have a trend to stabilize above the 100 moving average once again.
We have a downtrend on the RSI indicator that supports the upward move with a breakout.
We have a support area at the lower boundary of the channel at 0.7600.
Entry price: 0.8200
First target: 0.8200
Second target: 0.8446
Third target: 0.8800
ONDO looks bullish (1D)ONDO appears to be in wave D of a larger pattern (possibly a triangle).
Wave D seems to be a diametric or symmetrical structure. This diametric may complete in the green zone, leading to an upward reversal.
We are looking for buy/long positions in the green zone. Targets are marked on the chart.
A daily candle closing below the invalidation level will invalidate this analysis
For risk management, please don't forget stop loss and capital management
When we reach the first target, save some profit and then change the stop to entry
Comment if you have any questions
Thank You
