ONEUSDT: Eyeing Weekly VWAP for Optimal Entry! ONEUSDT: Eyeing Weekly VWAP for Optimal Entry! 🌟📊
Key Points:
Price Check: ONEUSDT’s current price aligns well for a potential buy setup.
Weekly VWAP Opportunity: Aiming to catch an entry below the weekly VWAP for added confirmation and risk management. I would take half the risk I normally take.
Why This Setup?
Strategically buying below the weekly VWAP combines market sentiment and technical advantage. With indicators like CDV, liquidity heatmaps, volume profiles, and volume footprints, these demand zones offer high-value entry points.
Pro Tip: Confirm with low time frame market structure breaks and volume footprint support to maximize confidence in your trade.
If you find this analysis helpful, please boost, comment, and follow. Let’s make trading smarter, together!
Let me tell you, folks, this is amazing. Nobody does analysis like I do. Believe me. If this helps you, don't forget to boost and comment! It’s a big deal, motivates me to share even more winning insights with you. Tremendous insights.
I keep my charts the best, clean, simple, and clear. You know it, I know it, clarity leads to better decisions. No question about it. My approach? Built on years of tremendous experience. Incredible track record. I don’t claim to know it all, but I spot high-probability setups like nobody else. Trust me.
Want to learn how to use the heatmap, cumulative volume delta, and volume footprint techniques I use to determine demand regions with stunning accuracy? Send me a private message—totally free, folks. That’s right. I help anyone who wants it, absolutely no charge. Unbelievable value.
Here’s the list, long list, great list, of some of my previous incredible analyses. Each one, a winner:
🎯 ZENUSDT.P: Patience & Profitability | %230 Reaction from the Sniper Entry
🐶 DOGEUSDT.P: Next Move
🎨 RENDERUSDT.P: Opportunity of the Month
💎 ETHUSDT.P: Where to Retrace
🟢 BNBUSDT.P: Potential Surge
📊 BTC Dominance: Reaction Zone
🌊 WAVESUSDT.P: Demand Zone Potential
🟣 UNIUSDT.P: Long-Term Trade
🔵 XRPUSDT.P: Entry Zones
🔗 LINKUSDT.P: Follow The River
📈 BTCUSDT.P: Two Key Demand Zones
🟩 POLUSDT: Bullish Momentum
🌟 PENDLEUSDT.P: Where Opportunity Meets Precision
🔥 BTCUSDT.P: Liquidation of Highly Leveraged Longs
🌊 SOLUSDT.P: SOL's Dip - Your Opportunity
🐸 1000PEPEUSDT.P: Prime Bounce Zone Unlocked
🚀 ETHUSDT.P: Set to Explode - Don't Miss This Game Changer
🤖 IQUSDT: Smart Plan
⚡️ PONDUSDT: A Trade Not Taken Is Better Than a Losing One
💼 STMXUSDT: 2 Buying Areas
🐢 TURBOUSDT: Buy Zones and Buyer Presence
🌍 ICPUSDT.P: Massive Upside Potential | Check the Trade Update For Seeing Results
🟠 IDEXUSDT: Spot Buy Area | %26 Profit if You Trade with MSB
📌 USUALUSDT: Buyers Are Active + %70 Profit in Total
🌟 FORTHUSDT: Sniper Entry +%26 Reaction
🐳 QKCUSDT: Sniper Entry +%57 Reaction
📊 BTC.D: Retest of Key Area Highly Likely
And that’s just the start. The list goes on and on, folks. It’s a tremendous list, the best. I stopped adding because, frankly, it’s tiring. So many wins. People are amazed. You can check my profile and see for yourself, winning moves, all the time. Believe me, nobody does it better.
ONEUSDT

Buy Signal for ONE/USDT📈 Buy Signal for ONE/USDT
✅ Suggestion: Open a market buy position now.
🎯 Target Levels: The labeled targets are expected to be reached soon.
🚨 Stop Loss: A specific stop-loss has been determined for this trade to manage risk.
💬 For managing this signal effectively and gaining access to more trading opportunities:
1️⃣ Follow my TradingView page 📊
2️⃣ Send me a private message for personalized guidance.
💎 Let’s profit together from this opportunity! 💰

Alikze »» ONE | Accumulation phase🔍 Technical analysis: The accumulation phase is ready for the bullish wave 3 rally - 1W
📣 BINANCE:ONEUSDT In the previous analysis, the weekly timeframe was corrected after hitting the supply zone, the details of which were examined.
🟢 On the weekly timeframe, it is in a three-year range in a concentration that is in the accumulation phase.
🟢 At present, given that the current supply zone has been consumed, we should wait for the zone break for the next supply zone.
🟢 Therefore, this upward leg will have the ability to grow to the neckline area, which can bring a 200-300% rally.
💎After breaking the second supply zone and consolidating above the area, it will have the ability to grow to the 84 cents area.
»»»«««»»»«««»»»«««
Please support this idea 💡 with a LIKE 👍 and COMMENT 💬 if you find it useful and Click "Follow" on our profile if you'd like these trade ideas delivered straight to your email 📧 in the future.
Thanks for your continued support.🙏
Best Regards,❤️
Alikze.
»»»«««»»»«««»»»«««

(update) ONEUSDT is ready to increase even further!After breaking the ascending Wedge , the price experienced significant growth. As you can see, the price has now dropped to under the the 0.618 Fibonacci line. Market volume indicates that the price may not be able to break above the 0.618 line, which means the price could drop alittle before rising again.
previous analysis
Give me some energy !!
✨We spend hours finding potential opportunities and writing useful ideas, we would be happy if you support us.
Best regards CobraVanguard.💚
_ _ _ _ __ _ _ _ _ _ _ _ _ _ _ _ _ _ _ _ _ _ _ _ _ _ _ _ _ _ _ _
✅Thank you, and for more ideas, hit ❤️Like❤️ and 🌟Follow🌟!
⚠️Things can change...
The markets are always changing and even with all these signals, the market changes tend to be strong and fast!!

ONE Analysis - What Shall we Expect !!!As you can see, ONE has created an ascending head and shoulders and is also located in the Falling wedge , which means that if it breaks, we expect the price to reach the target (AB=CD).
✨We spend hours finding potential opportunities and writing useful ideas, we would be happy if you support us.
Best regards CobraVanguard.💚
_ _ _ _ __ _ _ _ _ _ _ _ _ _ _ _ _ _ _ _ _ _ _ _ _ _ _ _ _ _ _ _
✅Thank you, and for more ideas, hit ❤️Like❤️ and 🌟Follow🌟!
⚠️Things can change...
The markets are always changing and even with all these signals, the market changes tend to be strong and fast!!

ONEUSDT Analysis: Strategic Demand ZonesONEUSDT presents high-potential demand zones , highlighted by the blue boxes . I’ve intentionally placed these zones lower , considering the market's potential to reach these levels around the Christmas period . This approach provides an opportunity for well-positioned entries if market conditions align.
Key Points:
Strategic Positioning: Blue boxes set intentionally lower for better entries in expected market dips.
Market Timing: Potential price action around Christmas aligns with these zones.
Confirmation Indicators: I will use CDV, liquidity heatmaps, volume profiles, volume footprints, and upward market structure breaks on lower time frames for validation.
Learn With Me: If you want to master how to use CDV, liquidity heatmaps, volume profiles, and volume footprints to identify precise demand zones, just DM me. I’d be happy to guide you!
Reminder: Be aware of the market's current state and approach it with caution. Successful trading relies on meaningful levels and robust confirmations.
If you think this analysis helps you, please don't forget to boost and comment on this. These motivate me to share more insights with you! Wishing everyone success in their trades.
If you think this analysis helps you, please don't forget to boost and comment on this. These motivate me to share more insights with you!
I keep my charts clean and simple because I believe clarity leads to better decisions.
My approach is built on years of experience and a solid track record. I don’t claim to know it all, but I’m confident in my ability to spot high-probability setups.
If you would like to learn how to use the heatmap, cumulative volume delta and volume footprint techniques that I use below to determine very accurate demand regions, you can send me a private message. I help anyone who wants it completely free of charge.
My Previous Analysis
🐶 DOGEUSDT.P: Next Move
🎨 RENDERUSDT.P: Opportunity of the Month
💎 ETHUSDT.P: Where to Retrace
🟢 BNBUSDT.P: Potential Surge
📊 BTC Dominance: Reaction Zone
🌊 WAVESUSDT.P: Demand Zone Potential
🟣 UNIUSDT.P: Long-Term Trade
🔵 XRPUSDT.P: Entry Zones
🔗 LINKUSDT.P: Follow The River
📈 BTCUSDT.P: Two Key Demand Zones
🟩 POLUSDT: Bullish Momentum
🌟 PENDLEUSDT.P: Where Opportunity Meets Precision
🔥 BTCUSDT.P: Liquidation of Highly Leveraged Longs
🌊 SOLUSDT.P: SOL's Dip - Your Opportunity
🐸 1000PEPEUSDT.P: Prime Bounce Zone Unlocked
🚀 ETHUSDT.P: Set to Explode - Don't Miss This Game Changer
🤖 IQUSDT: Smart Plan
⚡️ PONDUSDT: A Trade Not Taken Is Better Than a Losing One
💼 STMXUSDT: 2 Buying Areas
🐢 TURBOUSDT: Buy Zones and Buyer Presence
🌍 ICPUSDT.P: Massive Upside Potential | Check the Trade Update For Seeing Results
🟠 IDEXUSDT: Spot Buy Area | %26 Profit if You Trade with MSB
📌 USUALUSDT: Buyers Are Active + %70 Profit in Total
🌟 FORTHUSDT: Sniper Entry +%26 Reaction
🐳 QKCUSDT: Sniper Entry +%57 Reaction
I stopped adding to the list because it's kinda tiring to add 5-10 charts in every move but you can check my profile and see that it goes on..

#ONE/USDT#ONE
The price is moving in a descending channel on the 4-hour frame and is expected to continue upwards
We have a trend to stabilize above the moving average 100 again
We have a descending trend on the RSI indicator that supports the rise by breaking it upwards
We have a support area at the lower limit of the channel at a price of 0.02226
Entry price 0.02512
First target 0.02973
Second target 0.03367
Third target 0.3865

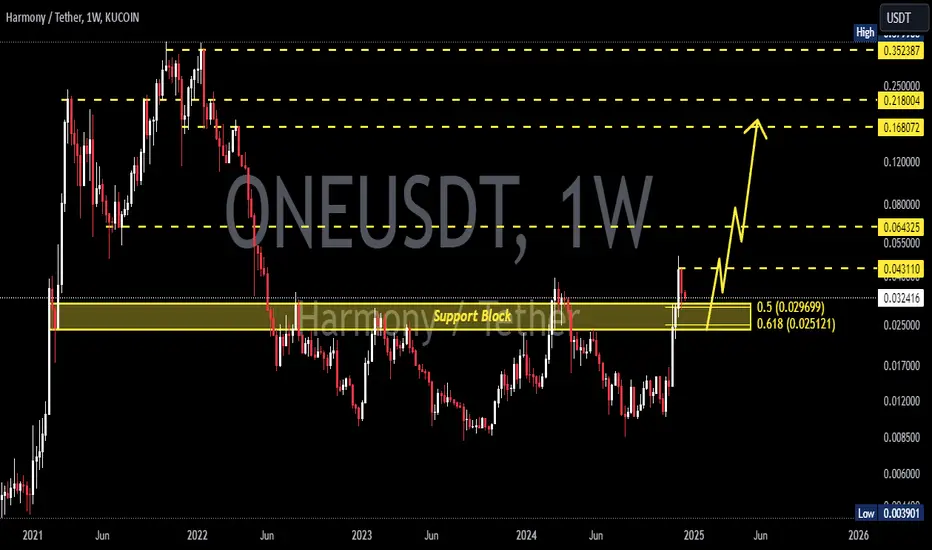
ONEUSDT 1WONE Update ~ 1W
#ONE If you still have Conviction on this coin,. This support block is a very good place to start buying gradually, with a target of at least 20%++
ONEUSDT Delivers a Whopping 1,500% Gain and Still Running!ONEUSDT on the 1-Day timeframe has delivered an explosive long trade setup, exceeding all profit targets. The trade has achieved an extraordinary 1,500% profit so far and continues to show strength for further upside momentum.
Key Levels:
TP1: 0.01510 ✅
TP2: 0.01804 ✅
TP3: 0.02099 ✅
TP4: 0.02280 ✅
Technical Analysis:
The trade was perfectly caught using the Risological Swing Trading Indicator , which provided a clear entry at 0.01328 and an SL at 0.01181 for disciplined risk management.
Price action shows a strong uptrend, with consistent support from the Risological Trend Line, pushing ONEUSDT beyond all set targets. Profit-taking at higher levels remains ideal while monitoring for further gains.

Harmony is READY!As you can see BINANCE:ONEUSDT able to close a candle above 0.04 area which means breaking a neck of H&S pattern. You can think of it as beginning, and we may never see this price again. So this will be the opportunity invest in Harmony ( BINANCE:ONEUSDT ). I will be taking profits at those marked green lines.

ONEUSDT: Analysis of Key Buying AreasThe blue and green boxes on this chart represent critical buying zones, identified using a blend of advanced technical analysis techniques. These zones indicate areas where strong buying pressure is expected, making them ideal for potential long positions. Below is a detailed breakdown of their significance and trading approach:
1. The Concept of Buying Zones
Buying zones are price regions where a reversal or bounce to the upside is likely. These zones are derived from significant support levels and historical price reactions.
Blue Boxes: These are primary buying zones , indicating areas with the highest confidence of support. They are often identified from higher timeframes, such as daily or 4-hour charts, and reflect strong confluence levels like Fibonacci retracements or key order blocks.
Green Boxes: These are secondary buying zones , providing additional opportunities but with slightly lower confidence. These zones typically stem from intraday price action and minor structural support levels.
2. How Are These Zones Determined?
The buying zones are meticulously drawn using the following methods:
Fibonacci Levels: Focused on 0.618–0.786 retracement areas for strong support.
Order Blocks: Highlighting the last bullish or bearish candle before an impulsive price move.
Volume Profile: Identifying high-volume nodes, which often act as significant price magnets.
Market Structure: Analyzing higher highs and higher lows to define areas of structural support.
3. How to Trade the Zones
When the price enters these buying zones, here’s how to approach it:
Blue Box – High-Confidence Trade:
Monitor for confirmation signals such as bullish candlestick patterns (e.g., engulfing or pin bars).
Place stop-loss orders just below the zone’s boundary to minimize risk.
Green Box – Lower Priority Trade:
Use tighter stop-losses and wait for stronger intraday confirmations, like breakouts from local resistance.
Be mindful of higher risks as these zones are not as robust as blue boxes.
4. Additional Confirmation Signals
Strengthen your entries by combining these signals:
Bullish Divergences: Look for RSI or MACD divergences aligning with the zones.
Volume Spikes: A sharp increase in volume near the zones indicates institutional interest.
Reclaim of Key Levels: A break above nearby resistance after bouncing from the zone confirms upward momentum.
5. Example Scenarios
Scenario 1: Price enters the blue box and forms a bullish engulfing candle. Enter a long position, set a stop-loss below the zone, and target the next resistance level.
Scenario 2: Price dips into the green box but holds above the lower boundary. Wait for consolidation and a breakout before entering.
I keep my charts clean and simple because I believe clarity leads to better decisions.
My approach is built on years of experience and a solid track record. I don’t claim to know it all, but I’m confident in my ability to spot high-probability setups.
My Previous Analysis
🐶 DOGEUSDT.P: Next Move
🎨 RENDERUSDT.P: Opportunity of the Month
💎 ETHUSDT.P: Where to Retrace
🟢 BNBUSDT.P: Potential Surge
📊 BTC Dominance: Reaction Zone
🌊 WAVESUSDT.P: Demand Zone Potential
🟣 UNIUSDT.P: Long-Term Trade
🔵 XRPUSDT.P: Entry Zones
🔗 LINKUSDT.P: Follow The River
📈 BTCUSDT.P: Two Key Demand Zones
🟩 POLUSDT: Bullish Momentum
🌟 PENDLEUSDT: Where Opportunity Meets Precision
🔥 BTCUSDT.P: Liquidation of Highly Leveraged Longs
🌊 SOLUSDT.P: SOL's Dip - Your Opportunity
🐸 1000PEPEUSDT.P: Prime Bounce Zone Unlocked
🚀 ETHUSDT.P: Set to Explode - Don't Miss This Game Changer
🤖 IQUSDT: Smart Plan
⚡️ PONDUSDT: A Trade Not Taken Is Better Than a Losing One
💼 STMXUSDT: 2 Buying Areas

Easy 10X on HarmonyNice chart and project, hold for this bullrun
This is one solid project and will see +10BN market cap this alt season

Harmony (ONE)📊 Comprehensive Analysis of Harmony (ONE)
🔍 Overview: Harmony, after experiencing significant trading volume, successfully broke out of its descending channel. The breakout of the weekly resistance zone (yellow area) in the weekly timeframe opens new opportunities for upward movement.
🕰 Technical Analysis:
Current Situation: The price, having surpassed the weekly resistance, is poised to target Fibonacci levels of 1.618 and 2.618.
RSI Analysis:
RSI is encountering a critical resistance level that could temporarily halt the upward momentum.
A breakout above this resistance could push RSI into the Over-Extended zone, which may trigger a sharp price surge.
🎯 Recommendations and Entry Points:
Layered Entry Strategy:
First Entry: At the current price zone.
Second Entry: After a correction and pullback to the yellow zone (previously broken resistance).
📌 Key Considerations:
Risk Management: Proper capital management and risk allocation are crucial.
Market Volatility: Sudden market reactions can lead to unexpected losses. Failing to adhere to effective risk management could result in significant setbacks.

ONEUSDT Signals Trend ReversalONEUSDT Technical analysis update
ONEUSDT has been trading within a channel for the last 150 days, which is considered an accumulation stage. We can see high volume as the price moves toward a breakout, and today, the price has crossed the 200 EMA. This is considered a strong bullish signal, indicating a potential trend change to bullish.
Regards
Hexa

#ONE(SPOT) entry range(0.01030- 0.01230) T.(0.02599) SL( 0.0101)BINANCE:ONEUSDT
entry range (0.01030- 0.01230)
Target1 (0.02199) - Target2 ( 0.02599)
SL .1D close below (0.0101).
*** Collect the coin slowly in the entry range ***
*** No FOMO - No RUSH - it is a long journey ***
**** #Manta #OMNI #DYM #AI #IO #XAI #ACE #NFP #RAD #WLD #ORDI #BLUR #SUI #VOXEL #AEVO #VITE #APE #RDNT #FLUX #NMR #VANRY #TRB #HBAR #DGB #XEC #ERN #ALT #IO #ACA #HIVE #ASTR #ARDR #PIXEL #LTO #AERGO #SCRT #ATA #HOOK #FLOW #KSM #HFT #MINA #DATA #SC #JOE #RDNT #IQ #CFX #BICO #CTSI #KMD #FXS #DEGO #FORTH # AST #PORTAL #CYBER #CLV #RIF #ENJ #ZIL #APT #MAV #ZRX #RENDER #THETA #CHZ #MASK #ONE ****

ONEUSDT Bullish Breakout After 150 DaysONEUSDT Technical analysis update
BINANCE:ONEUSDT has formed a parallel channel at the bottom, and the price broke the channel resistance line with high volume on the daily chart. The price is trading above both the 100 and 200 EMAs, confirming a trend change. This breakout occurred after 150 days of a ranging market
BINANCE:ONEUSD

Harmony One TP zones approaching Bull run 2024-25Looking for Harmony One to complete the top of cup pattern edge here to reach TP1. Showing considerable strength as we approach the end of the year. Looking for continuation.

Harmony (ONE)Harmony is a blockchain platform designed to facilitate the creation and use of decentralized applications. Harmony achieves scalability and increases the speed of transactions and block generation through the use of random state sharding. Random state sharding allows the network to split the database into smaller partitions called shards to reduce latency.
Anyway, It is clear that after ONE's harmonic pattern ended, an upward move started but lacked momentum. So, ONE went further down to accumulate momentum, and after did so, a strong upward wave started, and now it seems breaking the minor downtrend line too. Looking at the chart, it can be seen that ONE has a lot of room to rise. Let's see what happens.

Trading opportunity for ONEUSDTBased on technical factors there is a Buy position in :
📊 ONEUSDT
🔵 Buy Now
🪫Stop loss 0.01350
🔋Target 1 0.01700
🔋Target 2 0.01950
🔋Target 3 0.02200
💸RISK : 1%
We hope it is profitable for you ❤️
Please support our activity with your likes👍 and comments📝


#ONE/USDT
#ONE
The price has broken the descending channel on the 1-hour frame. Up and is expected to continue
We have a trend to stabilize above the moving average 100 again
We have an upward trend on the RSI indicator that supports the rise by breaking it upwards
We have a support area at the lower limit of the channel at a price of 0.01137
Entry price 0.01190
First target 0.01296
Second target 0.02422
Third target 0.01525

ONEUSDTONE ~ 1W
#ONE Back to retesting this support block. if you have Conviction on this coin,. Maybe placing a purchase here is good enough for the short term at least 20%++

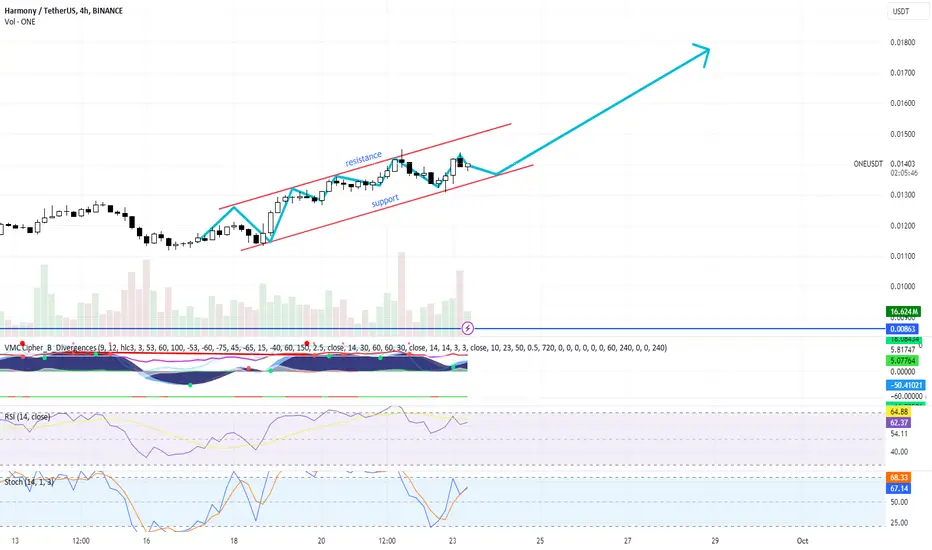
Harmony (ONE/USDT) technical analysis and trading plan.Harmony (ONE/USDT), technical analysis and trading plan by Blaž Fabjan:
Price Channel:
The price is moving within a rising channel, marked by support and resistance lines.
The price is currently near the lower part of the channel (support zone), which suggests potential upside movement if the support holds.
Volume:
There's a visible increase in volume, especially around the recent moves to the downside. This could indicate some volatility and buyer/seller activity.
Keep an eye on whether the volume increases near the support area for a confirmation of buying interest.
Indicators:
VMC Cipher B Divergences:
The green dots at the bottom may suggest some bullish divergence, meaning that the price could bounce from this support level.
RSI (Relative Strength Index):
RSI is around 50, suggesting the market is neutral but possibly gearing up for a momentum shift. A move above 60 could confirm bullish strength.
Stochastic RSI:
Stochastic RSI is currently near oversold levels (below 20) and showing signs of a potential upward crossover, which usually signals a buy opportunity.
Support & Resistance:
The support line of the ascending channel acts as the immediate buy zone.
Resistance is around the upper channel limit, which could be a take-profit target.
Upward Projection:
The blue arrow shows a bullish trend, with price potentially moving upward toward the resistance of the channel.
If the price breaks above this channel, we could see further bullish continuation.
Trading Plan:
Entry Point:
Consider entering a long position near the support line (around $0.0135–$0.0140) within the price channel.
Look for confirmation signals such as increasing volume and bullish divergence on the indicators (especially RSI moving above 50 and Stochastic RSI crossover).
Take-Profit Targets:
Target 1: At the resistance line of the channel around $0.0160–$0.0165.
Target 2: If price breaks above the channel, set an additional take-profit around $0.0180 as indicated by the upward projection.
Stop Loss:
Place a stop-loss just below the channel’s support, around $0.0130. This level ensures protection against a breakdown of the current uptrend.
Risk Management:
Use proper position sizing, risking only 1–2% of your capital per trade.
Trailing stop-loss could be employed if the price continues to move in your favor.
Watch for Confirmation:
Ensure RSI and Stochastic RSI both signal momentum shift, and volume should accompany any move upwards for confirmation of the trend.
By following this technical setup, you can navigate the current market conditions for Harmony (ONE/USDT) efficiently.