oneusdt/1dBullish gartley pattern completed at strong reversal zone ( D ) and I think we're going to see a bullish AB=CD pattern from D but you can wait for long entry after we're going to see a breakout from down trend.
As for me, I think good time for opening a position is right now with sell stop-limit order under the reversal zone.
ONEUSDT

ONE:USDT Bullish, LONG, 5th wave, +10xThis is ONE beautiful chart ;) if this plays out honestly this is one to frame and put on the wall. I can't help but marvel at how technically perfect it is. If this plays out- it'll display the real power of Elliott wave. This 4th- 5th wave trade is the bread and butter of Elliott- it doesn't get better than this.
Key points
2nd wave retraced to the high probability zone 0.5 Fib
3rd wave pivoted at the high probability zone between the 1.618- 1.75 Fib
4th wave has currently retraced to the high probability zone 0.38 Fib
5th wave high probability target is at 1:1 of the first wave projected from the end of the 4th wave; this gives a target of almost 10x!
4th to 5th wave trade:
Entry: Below 0.056
Stop: 0.04667
Target: 0.54
Risk: Reward of about 1:60; for me this is a must take trade.
If the above trade is stopped out but fairly quickly rebounds and reclaims the previous range, wait for price to reclaim this area and look for the first retracement for a second opportunity to get long. For this second trade stops can be place below the new low.
Never Trust. Verify.
D.Y.O.R . Not Financial Advice, this is my trading journal.
Always remember: Technical Analysis is not about being right, it's about increasing your odds.
Be prepared to be wrong. Risk management is key . Capital preservation above all else.

HARMONY ONE monthly camarilla pivotsStop loss at L4. Entry on L3. Target H3. Extra targets for longer positional trade if successful are labelled on the chart

ONEUSDTHello fellow traders, if you like the idea, do not forget to support with a like and follow.
DISCLAIMER
________________
Forex trading and trading in other leveraged products involve a significant level of risk and are not suitable for all investors.
THIS IS NOT IN ANYWAY AN INVESTMENT ADVICE! DO YOUR OWN DUE DILIGENCE BEFORE TAKING ANY TRADE.

one / usdtthere is strong support zone at 0.08 $ and also ascending trendline that make a good entry for long position...black marker shows the possible swing point that you can consider as a target for your trade

ONEUSDTHello to you all. Mars Signals team wishes you high profits at all times.
We are in daily frame time. The price does not have enough power to go out of the resistance line. If we go out of the resistance line and stabilize above the line, we can trade for the above purposes.
Warning: This is just a suggestion to you and we do not guarantee profits.
Wish you luck!

ONE/USDT Consolidation into the apex. Are we ready?One Harmony is in a retracement phase since two months already.
We now see a symmetrical triangle forming out of the yellow and violet line.
we expect the support around 0.07$ to hold and retest the 0.16$ barrier.
If we just follow the lower violet line we could consolidate into the violet triangle which probably takes even more time.
Basic rules:
- Never buy the top/ATH
- Take profit as long as you can (also partial profit is profit)
- Use Stop/loss for leveraged positions
- If you are not experienced, don't leverage in the first place
Enjoy the ride and don't be too greedy.
If you like the content, please like, comment and give this channel a follow.
We would love it if you could share your thoughts in the comments.
Discussions are very welcome here.
Always do your own research and keep in mind that my charts and comments cannot be considered financial advice.
Cheers
ps.
Chart explanation:
Main lines:
- Green lines are tested support lines.
- Orange lines are resistance lines or, if we are above, possible support lines which were not tested yet.
- Cyan line is for volume trendline.
- White lines are Fibonacci retracement levels
Helplines:
- Purple lines are trendlines we take a look at.
- Yellow lines are for visual help only.
Boxes:
- Either entry zone or support zone. Check the description.


the best position high volume and technical indicatorthe best position high volume and technical indicator

Important turning point in whole crypto and HARMONYIt might be early to say, because we can't exclude both a bullish or bearish outcome, but as we try to make accurate forecasts, 2 bullish scenarios are definitely not excluded:
Bullish:
1. Green Elliott impulse wave to 0.2 USD short term
2. Turquois Elliott impulse wave to identical or higher target midterm.
Bearish:
3. Break of the white ascending trendline and 200 EMA following..
Situation atm:
Big corrections or run ups influenced by bitcoin have drastic impact, but can technically be eliminated to have a clearer view of where the chart might be going.
If we wouldn't have had the break out to 0.18 and the correction to 0.06, we would still have a longer consolidation in the form of a symmetrical triangle with the turquois path as an outcome.
The white ascending trendline is in my opinion primordial and functions as support for another leg up.
The fact that we have volatility in a broad trading range is good for the future, cfr. Matic around the 0.3-0.5 level and 0.7-0.8 level, remember.
We have also on a smaller scale broken out from a descending wedge and are hanging between the 21 and 100 EMA. Break out of these levels will indicate highly probable further direction.
On a macro scale we could have ended an ABC correction with an abrupt C wave, or we will be having an elongated C wave which will indicate a beartrend. These corrections are probably a subdivision of a larger correctional wave 4. And as we are making heavy consolidation in a larger trading range, I believe a 5th wave will definitely be insane.
On the log scale, which is nice to see parabolic movements play out like a walk in the park, I prefer to watch the regular scale to avoid over bullish scenarios, which doesn't exclude the probability.
A last overview of the correction since the 0.22 usd level is the yellow descending broadening wedge we are in, but hasn't really made form... I don't believe this is happening, as another visit to the lower trendline of the wedge would reach sub 0 levels, which is of-course excluded and proves the latter.
So after this analysis I would say I am rather bullish than bearish, if you'd have a few months max. patience.
Best case scenario a week or 2, worst case, a bullish turnaround after 2nd quarter or beginning July, which makes sense as well. This would mean that bitcoin might have a longer recovery as well, and indicate a second bull-run phase half this year until end of the year.
I am still prosperous for the future of blockchain, certainly for undervalued top coins as Harmony. They haven't been working on marketing or the 'network effect', but I believe hidden gems are called that way to astonish the market in a positive way on the longer term.


Harmony, ONE, going for.. almost 1.. (0.5 USD)Harmony is making for a long time momentum, walking in the footsteps of Matic, as always...
Very underrated, making a very large IHS, hovering above the 21 EMA, having 50 getting in line as well..
Target is 0.5 usd or about a 300% increase potential.

Harmony ONE tests 6 hr reaching for the Daily Trend LineHarmony ONE has touched the 6 hr Trend line and if it can surpass the 6 hour, then the Daily Trend Line, we could then and only then call this a start to a recovery. The same thing is happening to Bitcoin right now.
I expect a bounce off the 6 hr before any further moves up. I most certainly expect a bounce off the Daily Trend Line as well. We were at 50% correction, so this might be a great turning point. However, remember that previous bull markets experienced 80% corrections before flattening. I anticipate that if Bitcoin drops below key EMA's at 13 and 36 EMA, then we would likely test $18700 and alts would tumble with it.
Daily Trend Line (D TL on the chart) shaded red line identified by yellow arrow.
There was a strong buy signal on the 4 hr and it looks like it was a great signal. I've been trading in and out of 1 minute breakouts on ONEUSDTPERP on Binance with 30-50x leverage. The 5 minute trend has continued long with the 4 hr, so each time there was a long breakout on the 1 minute chart, I entered with 10-20K ONEUSDTPERP on long contracts at 30-50x. If you are interested in what you see here, or are looking to possibly make up some of your losses in this volatility, you should message me and demo this script set. The dashed lines on the chart are support and resistance lines based on time frame trends. Highly accurate. I can also show you when to adjust your leverage based on price movement, so you don't get liquidated as easily. :) What's amazing is you can use this script with a free account or PRO.
Each breakout is confirmed by a bend in the thin colored line between the candles, and a matching short/long arrow, with parabolic circles confirmation. I use RSI/SRSI on the bottom to see direction along with the Higher Time Frame chart, but realistically you can trade each breakout easily.
This is not financial advice, don't invest more than you can afford to lose, do your due diligence on all coins, and most of all, learn fundamentals of trading.

ONE/USDT Update: Testing upwards moving lineOne Harmony currently is volatile like crazy.
We even test the upwards moving line we did draw several weeks ago and did not expect to hit it at all.
Now here we are now testing the last support line before we potentially fall back to 0.03$.
We expect this support to hold unless people can't hold themselves and continue with this FUD all around.
Basic rules:
- Never buy the top/ATH
- Take profit as long as you can (also partial profit is profit)
- Use Stop/loss for leveraged positions
- If you are not experienced, don't leverage in the first place
Enjoy the ride and don't be too greedy.
If you like the content, please like, comment and give this channel a follow.
We would love it if you could share your thoughts in the comments.
Discussions are very welcome here.
Always do your own research and keep in mind that my charts and comments cannot be considered financial advice.
Cheers
ps.
Chart explanation:
Main lines:
- Green lines are tested support lines.
- Orange lines are resistance lines or, if we are above, possible support lines which were not tested yet.
- Cyan line is for volume trendline.
- White lines are Fibonacci retracement levels
Helplines:
- Purple lines are trendlines we take a look at.
- Yellow lines are for visual help only.
Boxes:
- Either entry zone or support zone. Check the description.

Oneusdt BuyHello traders!
Oneusdt is in correction form and it is now ready to make some new highs.
This trade will give 80% gains on the investment
DON'T FORGET TO HIT THE LIKE BUTTON AND FOLLOW TO STAY CONNECTED

Harmony Shows Strength ONE/USDT looks Bulish. Trendline was tested,and it looks like a trend continuation trade.
We are not registered or licensed in any jurisdiction whatsoever to provide investing advice or anything of an advisory or consultancy nature.
and are therefore are unqualified to give investment recommendations.
Always do your own research and consult with a licensed investment professional before investing.
This communication is never to be used as the basis of making investment decisions, and it is for entertainment purposes only.

Harmony ONE the road to $0.228 , short break then $0.285$ONE is big and price is about to explode ! last chance to get in at cheap price , after $0.35 lvl ONE will explode more to $0.85 , $1.5 then $3 !
DYOR !


ONE - USDT / Harmony Price targets support and resistanceHarmony still have more upside targets. Nicely consolidated over 10 Cent.

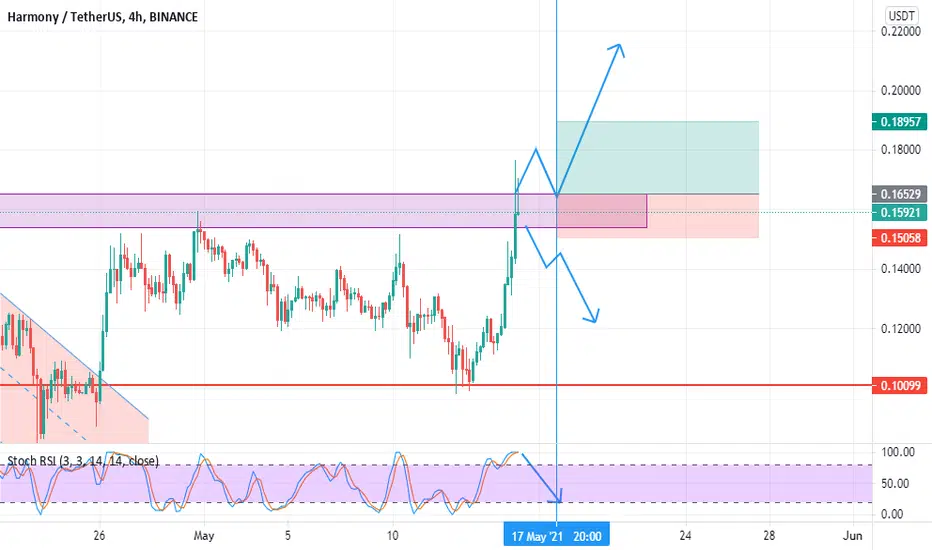
Harmony (One ) For Scalping 15% the best entry entry after break of resistance and test of support + Stochastic rsi under 20
ENTRY : 0.1660
SL : 0.1505
TP : 0.1895