A great project w/ price rocketing. Shooting for 300% from hereMore NOOB TA.
I bought in at 0.650 and holding. This is a great project that will take a bit of patience. It will still give you 300% on your money. Dumping money in and not looking at it for awhile. We might have a small retrace, but I don't care. My goal is 2x my money at least.
I am taking profits from 0.02 to 0.06 (10% at 0.06 - aiming high lol)
ONEUSDT

ONE/USDT - Correction After Bullish CandleHello traders and community, today we will tell ourselves shortly about the situation of ONE/USDT
Trend analysis
- As you can see from the ONE/USDT daily chart, the price of Harmony coin made big bullish candle after it with price action analysis I expect that there is high probability for correction movement which you can see on the chart (white line). Price of ONE may go down approximately down to 0.04517 price level after it will be done we can count with bullish movement again. After correction movement we can expect price on previous resistance level (price zone: 0.06303). Today's Resistance level is on 0,06303 price level, support level is near 0.03998 price level and global trend stays bullish. Always check for trustworthy signals before you make a trade!
Chart pattern
- Bullish breakout (approved)
- Correction (processing)
Technical indicators
- RSI: market is beyond the borders and is located near 79 level (overheated, Bearish signal)
- MACD: MAs are prepared for upward movement + they are moving away from each other and overall trend is going up (Bullish signal)
- BB: Volatility of the market started increasing after range movement accomplished (Bull signal)
- MA (10,20): MA10 is above the level of MA20 and moving upward (Bull signal)
= Overall bullish signal movement
Dear friends, please push the like button, write comments below, follow me for more technical analysis and share this post with other traders - that would be the best support, Thank you for your attention!
Tell us about your opinion for making better decisions :)
P.S.: Information provided is only educational and should not be used to take action in the market.

ONE/USDT - Ready for 0.06$On the daily chart, we can see that the market has formed a bullish W formation in addition to the bullish trend line.
On the second try, the price has broken its previous high and that high is now a support level.
The price is expected to rise to 0.06 and above .
If you like ideas like this, please like and subscribe to this channel so as not to miss another technical analysis .
Write your opinion about it in the comments. I would like to discuss this with anyone.
This is NOT a FINANCIAL ADVICE . This is just my point of view on the current situation.

Harmony considered the MOST PERFECT 2nd layer scale solutionAs I watched Matic going public, I heard rumors saying 'Harmony is the real deal' and technically the most innovated layer 2 solution built ever. As Harmony is made in an idealistic way and is meant to bring fair trade into the world, the founders have tried to make this ONE as perfect as they could. It is considered by Theta the most innovated token and is still an underdog. We just have experienced a revisit of the value of the ICO, and this means a doubling is around the corner.
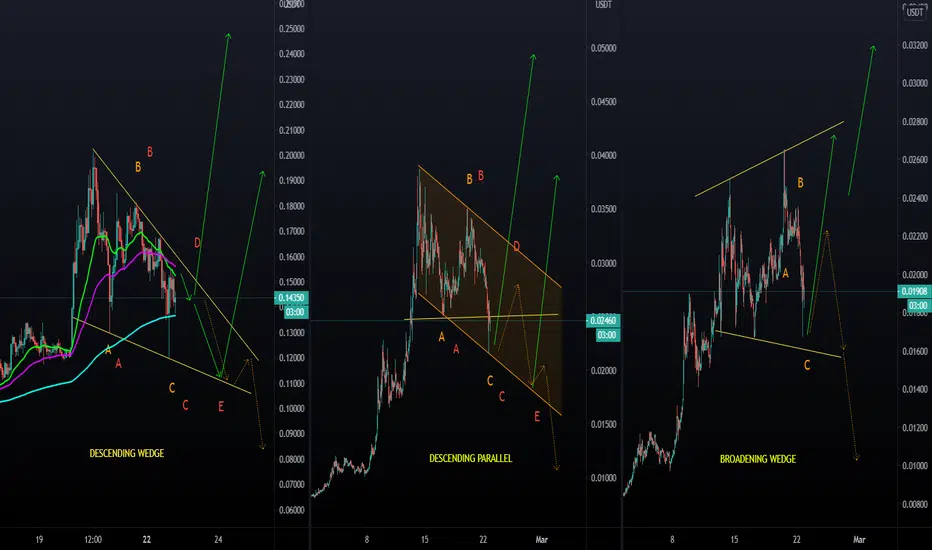
Most alts are recovering from a serious correction and are consolidating within a descending wedge, which is quite a particular trend these times in any tech/futuristic chart or market..
I can foresee a visit of 0.1 usd for sure. Harmony is the last one behind Matic for this market to catch up with Theta and Theta fuel.
Total supply of Harmony (12.6 billion) is quite similar to that of Matic (10 billion) but Harmony's circulating supply is already 75% of that of Matic which has still 50% of its supply to be released which could not harm, but I'd say influence Matic's growth.
Harmony has a current market cap of 240M usd, and a price of 0.026 usd, and a 0.1 usd is just a 4x and similar to Matic it can reach a 1B usd market cap, which many people have in mind as well.
People always follow trends and Harmony will certainly get in the spotlight and prove its practical use cases.
Technically as I said Harmony is at the offspring of momentum made in a descending broadening wedge, after correction to exactly to the 61.8% FIB (not shown here, as this is the 61.8% here is the follow up, not the correction). 1.618 Extension is exactly at the doubling of the ico's value and comes on around 0.06 usd. This could be a 3th wave visit or a bounce as a 4th correctional wave, with a target of 0.1, 2.618 FIB or about 0.1 usd level. We are clear above the 21 EMA and touched and get rejected by the 50 EMA.
I foresee certainly an identical target of 1 billion usd market cap as I predicted this for Matic as well before the run up.
If btc recovers and markets will shift in real values, Harmony and Matic are destined to become a top 20 coin which will eventually develop as a +10 B usd market cap token.
We must follow correct patterns, and this is just a calculated speculation, and the timeframe could be much larger as well.. remember the bullrun from Theta which had quite some long pauzes in between but ended up each time in a higher trading range.
So far this token deserves to be big, that's my opinion.

While BTC went down.. Alts crashed.. OR .. corrected?I present 3 layer 2 solution alts with 3 similar ABC corrections, but with 3 different structures.
In case this correction is finished we can clearly see an ABC correction, which could interlude a new bullrun.
On the other hand BTC has dropped from a significant high, and failed to reach the 60K, though we remained above the 1T BTC market cap as this is an milestone in history and could indicate a support level.
Bitcoin just had 1 leg down (on a smaller scale there was a leg down as well, but not as great in comparison as this one).
Alts had 2 legs down, and so if bitcoin would have a new visit to lower levels, we might have an ABCDE correction.
Worst case, we could have a major BTC correction in which we don't know yet how ALTS would behave, but they would probably outperform to the downside as well...
So be careful with trades and risk mgmt. On the other hand I don't quite believe on the long run we are done.
These alts are a free sample of what still undervalued top-coins look like.
So I am mostly long, but I don't have enough data to completely back my theory.

ONE/USDT Testing previous ATH as new supportOne Harmony broke out of its previous All-time-high (ATH).
We are currently within a pullback to retest the previous resistance if it acts now as support.
So if it does this is considererd to be a good entry point.
Keep an eye onto the yellow line which signals the next support if the previous ATH doesn't hold.
What is the upper limit you ask? Well I don't see any.
Enjoy the ride and don't be too greedy.
If you like the content, please like, comment and give this channel a follow.
Always do your own research and keep in mind that my charts and comments cannot be considered financial advice.
Cheers
ps.
Chart explanation:
Main lines:
- Green lines are tested support lines.
- Orange lines are resistance lines or, if we are above, possible support lines which were not tested yet.
- Cyan line is for volume trendline.
Helplines:
- Purple lines are trendlines we take a look at.
- Yellow lines are for visual help only.


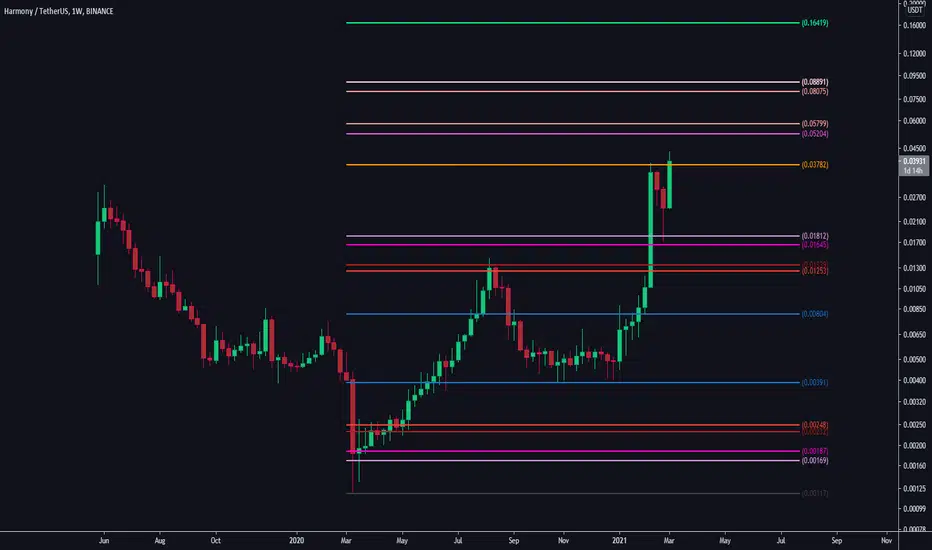
Harmony / Pick your lucky numberONEUSDT Weekly chart - Fibonacci Levels.
We are not registered or licensed in any jurisdiction whatsoever to provide investing advice or anything of an advisory or consultancy nature.
and are therefore are unqualified to give investment recommendations.
Always do your own research and consult with a licensed investment professional before investing.
This communication is never to be used as the basis of making investment decisions, and it is for entertainment purposes only.

ONE/USDT Going for a break of the LAST resistance levelOne Harmony eyes with the last resistance line (Orange).
If we can break this we finally are fully in price discovery mode.
It's only a matter of time until we break it, so don't too long.^^
Enjoy the ride and don't be too greedy.
If you like the content, please like, comment and give this channel a follow.
Always do your own research and keep in mind that my charts and comments cannot be considered financial advice.
Cheers
ps.
Chart explanation:
Green lines are tested support lines.
Orange lines are resistance lines or, if we are above, possible support lines which were not tested yet.
Cyan line is for volume trendline.
Purple lines are trendlines we take a look at.
Yellow lines are for visual help only.

ONE/BTC/USDTONE looks ready here buy it only on break out.
potential target on the chart
OLD call. target hit

ONE/USDT Recovering after the bitcoin dumpOne Harmony already gave us a 5x and dropped together with Bitcoin and the whole market this week.
We found some support (green line) and are currently recovering and looking up again.
Maybe we need some more momentum but the moment seems near to produce some new All-Time-Highs.
Enjoy the ride and don't be too greedy.
If you like the content, please like, comment and give this channel a follow.
Cheers
ps.
Chart explanation:
Green lines are tested support lines.
Orange lines are resistance lines or, if we are above, possible support lines which were not tested yet.
Cyan line is for volume trendline.
Purple lines are trendlines we take a look at.
Yellow lines are for visual help only.


Harmonic Patterns on Harmony ChartHarmony (ONE) high time frame chart seems to be bullish . If it falls down to 0.00288 - 0.00358 and bounces at this level I expect it to break its almost horizontal trend and make a new trend with the same angle as the last trends it made before. If this happens I think It can easily break the all-time resistance and take back its ATH at 0.002426 by making a bat pattern

Cup and Handle for HarmonyCup and Handle for Harmony , its better to wait for reversal to the support level to buy 0.012 and target 0.06 , the support should be hold on weekly candles

harmony ATH challenge analysis by matin taherzadehHi guys
After prolonged accumulation , harmony attacks to the upside resistace at 0.618 fibonacci retracement level that was the main resistance level of this boy and break it hardly with a high thick weekly marubozu so lets make a deep insight on this coin:
The attractive thing about one/usdt pair is that the marubozu attack to the ATH (all time high) of this coin and if can break ATH level will become hyperbolic and even rockets to the moon !
now relative strength index and money flow index both are in the overbought zone show that one needs a correction and the possible reaction levels for recovery mentioned as the fibonacci levels.
if harmony successfully does its correction and then break the ATH, the targets upward mentioned on the chart. please note that this analysis is in the weekly time frame and the targets will be accessible in the mid term so your time& risk management is the most important factor to trade with this position trade.
always do your own research and with that: happy trading :)
good luck

oneusdtaccording to the previous analysis date:8 jan 2021 it has reached to the targets about 300% profit in one month.

oneusdtaccording to the previous analysis of this symbol, it has reached to three targets, about 100 % profit

ONEUSDTentry: around 0.0194
TP1: 0.0227
TP2: 0.0243
TP3: 0.0266
TP4: 0.0289
TP5: 0.0305
SL: 0.01562
Check my website for tutorials, examples and calls :)
cry-pto-surf.com

ONEUSDT 4H-TIMEFRAME ANALYSIS✨ONEUSDT 4H-TIMEFRAME ANALYSIS✨
Hello ladies and gentlemen
This is my new idea for Harmony ONEUSDT
I expect the price GO to correction
I hope my idea is clear
Support me by like and share
Stay Safe💯
Good luck💰

HARMONY ( one ) interesting weekly closersi turning bullish also macd have golden cross , +300% possible in longterm , wait for some consolidation then you can invest

Harmony has completed a big bullish setupHey friends, hope you are well, and welcome to the new update on Harmoney coin.
Up channel and different indicators:
The priceline of ONE coin is moving in an up-channel and crossing up the 25 and 50 simple moving averages. The stochastic and MACD are strong bullish.
Big bullish Shark move:
On long-term monthly chart ONE with Bitcoin pair, the price action of ONE token has formed a big bullish Shark and entered in potential reversal zone.
Ichimoku cloud and different indicators:
The price action Harmony with Bitcoin pair is moving below the Ichimoku cloud. Now the cloud has turned bullish and MACD and Stochastic are also turning bullish. The Stochastic is also in the oversold zone.
Conclusion:
As the price action of Harmony coin with Bitcoin pair is turning bullish and it can breakout the Ichimoku cloud resistance in the long-term weekly chart, therefore it can also break out the up-channel that the price action of ONE has formed with US Dollar pair on the weekly chart.
