OPUSDT Forming Descending ChannelOPUSDT is showing an impressive technical setup that has caught the attention of many crypto traders recently. The chart reflects a well-formed descending channel, which is a classic bullish reversal pattern when broken to the upside. Currently, the price action is testing the upper boundary of this channel with increasing buying pressure, signaling that a potential breakout could be on the horizon. A successful breakout here, supported by good volume, could trigger a strong rally in the coming sessions.
The volume profile for OPUSDT is encouraging, as it suggests that more investors are accumulating positions in anticipation of this move. This aligns with the optimistic sentiment in the broader crypto market, where traders are actively seeking altcoins with high potential upside. With an expected gain of around 80% to 90%+, OPUSDT offers an attractive risk-to-reward ratio, especially for those who prefer swing trades and short-term position trades in trending altcoins.
One key factor to watch is whether OPUSDT can sustain momentum above the descending channel’s resistance line. If volume remains strong and the breakout confirms on higher timeframes like the daily or weekly chart, this could attract further interest from both retail and institutional traders. Such a move often sparks a chain reaction of buying, as traders look to ride the trend to its projected target zone.
Overall, the combination of a textbook pattern, healthy volume, and increasing investor interest makes OPUSDT one to watch closely. Keep it on your radar for a possible breakout play with significant upside potential. As always, manage your risk properly and wait for a confirmed breakout before entering any position.
✅ Show your support by hitting the like button and
✅ Leaving a comment below! (What is You opinion about this Coin)
Your feedback and engagement keep me inspired to share more insightful market analysis with you!
OPBTC

OP Roadmap (3D)The OP token has entered a bearish phase after completing a triangle pattern. We are currently in this bearish phase.
Such large bearish phases typically require a sweep of liquidity from key levels before ending. It appears that OP, after sweeping the liquidity below support levels, may reverse and enter a bullish phase.
The targets have been marked on the chart.
A daily candle close below the invalidation level will invalidate this analysis.
For risk management, please don't forget stop loss and capital management
Comment if you have any questions
Thank You

#OP/USDT#OP
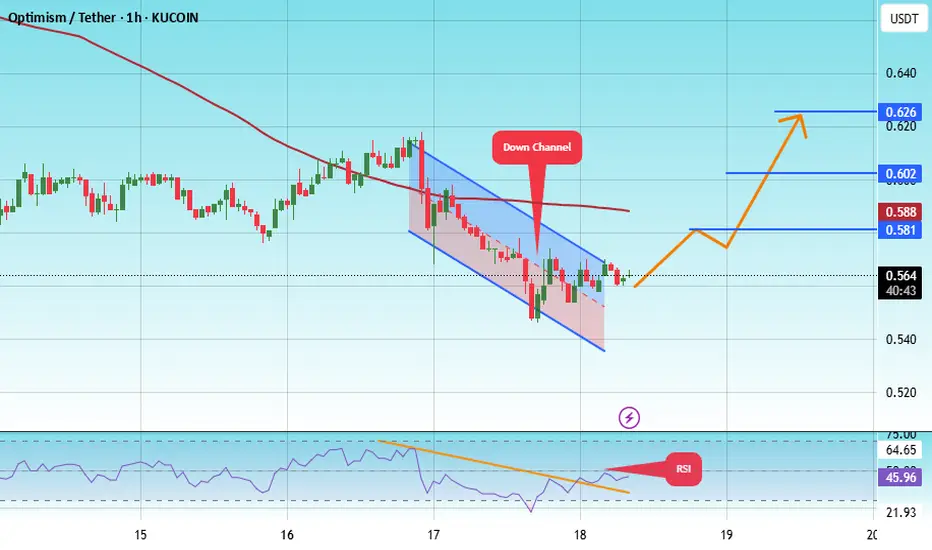
The price is moving within a descending channel on the 1-hour frame, adhering well to it, and is heading toward a strong breakout and retest.
We are experiencing a rebound from the lower boundary of the descending channel. This support is at 0.544.
We have a downtrend on the RSI indicator that is about to be broken and retested, supporting the upward trend.
We are heading toward stability above the 100 moving average.
Entry price: 0.564
First target: 0.581
Second target: 0.602
Third target: 0.626
#OP/USDT#OP
The price is moving within a descending channel on the 1-hour frame and is expected to break and continue upward.
We have a trend to stabilize above the 100 moving average once again.
We have a downtrend on the RSI indicator that supports the upward move with a breakout.
We have a support area at the lower limit of the channel at 0.600, acting as strong support from which the price can rebound.
Entry price: 0.616
First target: 0.630
Second target: 0.641
Third target: 0.658

#OP/USDT#OP
The price is moving within a descending channel on the 1-hour frame, adhering well to it, and is heading for a strong breakout and retest.
We are seeing a bounce from the lower boundary of the descending channel, which is support at 0.653.
We have a downtrend on the RSI indicator that is about to be broken and retested, supporting the upward trend.
We are looking for stability above the 100 moving average.
Entry price: 0.702
First target: 0.757
Second target: 0.805
Third target: 0.865

#OP/USDT#OP
The price is moving within a descending channel on the 1-hour frame and is expected to continue upward.
We have a trend to stabilize above the 100 moving average once again.
We have a downtrend on the RSI indicator, which supports the upward move by breaking it upward.
We have a support area at the lower limit of the channel at 0.817.
Entry price: 0.860
First target: 0.891
Second target: 0.916
Third target: 0.950

#OP/USDT#OP
The price is moving in a descending channel on the 1-hour frame and is adhering to it well and is heading to break it strongly upwards and retest it
We have a bounce from the lower limit of the descending channel, this support is at a price of 0.834
We have a downtrend on the RSI indicator that is about to be broken and retested, which supports the rise
We have a trend to stabilize above the moving average 100
Entry price 0.909
First target 0.939
Second target 0.992
Third target 1.054

OP BUY hello friends
I hope you are well.
As you can see in the chart, by correcting the price, we can buy step by step in the 2 specified support areas with capital management.
We have specified goals for you to be comfortable.
If you want an analysis, send us a message.
*Trade safely with us*

OP Analysishello guys
We carefully analyzed this coin for you and determined the purchase areas and price targets.
If you are risk-taking, you can buy a step right here, otherwise, the two specified ranges in the case of a pullback are the ranges where we expect the price to move from there to the specified targets.
I am happy to support and follow us.
be successful and profitable

#OP/USDT Ready to launch upwards#OP
The price is moving in a descending channel on the 1-hour frame and sticking to it well
We have a bounce from the lower limit of the descending channel, this support is at 2.10
We have a downtrend on the RSI indicator that is about to break, which supports the rise
We have a trend to stabilize above the moving average 100
Entry price 2.17
First target 2.28
Second target 2.40
Third target 2.60

TradeCityPro | OPUSDT Analysis Prepare Your Bullish Triggers!👋 Welcome to TradeCityPro Channel!
Let’s dive into the market and analyze OPUSDT, focusing on a detailed breakdown of its structure. Remember, those who stay calm and manage their emotions during market corrections are the ones who profit big in the bull run.
🌍 Market Overview
As always, we start with Bitcoin. Currently, it’s undergoing a minor pullback with hourly red candles and good volume. However, this is a positive development as it signals a potential pullback in Bitcoin dominance, possibly forming a lower high on the daily timeframe—a bullish indicator for altcoins.
Currently, Bitcoin is fluctuating around the 94,660 support. If this level is broken and Bitcoin moves toward 91,000 with a rising dominance, altcoins could see another 20-30% drop.
🕒 Weekly Time Frame
OP is a relatively new coin, part of the Layer 2 category, and hasn’t experienced a bull run yet.
The weekly candle shows a strong rejection at 2.688, making it a better resistance level than the previous 3.016. This rejection also enhances the significance of the 2.688 entry point.
Additionally, there’s a hidden trendline that has acted as support in the past, and after breaking it, the price pulled back. It has rejected this level again, suggesting potential future significance.
For safer entries, wait for support confirmation on lower timeframes or a breakout above 2.688. If you already bought at the 1.93 breakout, hold your position and remain patient.
📊 Daily Time Frame
On the daily chart, after breaking out of the accumulation box between 1.324 and 1.833, the price moved the size of the box to reach its first target (R:R 1). From there, it faced a heavy rejection.
pullback to the 1.833 support seems logical as this level aligns with the 50% Fibonacci retracement and Dow Theory principles. Confirmation on lower timeframes could signal a bullish reversal.
For now, wait for the downward momentum to fade before planning new entries. If the market moves sharply upward, this could introduce strong bullish momentum, allowing for higher-risk entries.
🕒 4-Hour Time Frame
On the 4-hour chart, the coin broke a rising trendline, leading to a drop. I personally didn’t open any short positions, nor would I recommend them in this context.
If 2.049 support is broken and Bitcoin dominance rises, the price could drop further to 1.833. Decision-making at that level will be key.
📈 Long Position Trigger
if the price ranges between 2.049 and 2.283 and starts gaining bullish momentum, a breakout above 2.283 with increasing volume would offer an early entry opportunity.
📉 Short Position Trigger
while breaking 2.049 might seem like a trigger, I still don’t recommend it. If you choose to short, watch the RSI, which is deeply oversold.
💡 BTC Pair Insight
In the current conditions, the Bitcoin pair (OPBTC) might not hold much significance. Coins that have either not dropped much or completed healthy corrections with declining bearish momentum are more favorable.
For OPBTC, the key trigger would be a breakout above 0.00002975, which could signal the start of its upward move in a bullish market.
📝 Final Thoughts
Stay calm, trade wisely, and let's capture the market's best opportunities!
This analysis reflects our opinions and is not financial advice.
Share your thoughts in the comments, and don’t forget to share this analysis with your friends! ❤️

OP is bullish (1D)On the chart, we have both a bullish iCH and a bullish QM.
If the price returns to the bottom, we are looking for buy/long in the specified range of ENTRY.
Closing a daily candle below the invalidation level will violate this analysis
Do not enter the position without capital management and stop setting
Comment if you have any questions
thank you

#OP/USDT#OP
The price is moving in a descending channel on the 1-hour frame and sticking to it well
We have a bounce from the lower limit of the descending channel and we are now touching this support at a price of 1.53
We have a downtrend on the RSI indicator that is about to be broken, which supports the rise
We have a trend to stabilize above the moving average 100
Entry price 1.57
First target 1.63
Second target 1.70
Third target 1.77

Optimism (OP) Optimism is a layer two blockchain on top of Ethereum. Optimism benefits from the security of the Ethereum mainnet and helps scale the Ethereum ecosystem by using optimistic rollups. That means transactions are trustlessly recorded on Optimism but ultimately secured on Ethereum.Optimism is one of the biggest scaling solutions for Ethereum with over $300 million in TVL.
Optimism price today is $1.23 with a 24 hour trading volume of 270 million dollars, OP price is up 15% in the last 24 hours
after a little correction OP can hit 1.3 and 1.5
did you manage to buy OP at 0.8$?

#OP/USDT#OP
The price has broken the descending channel on the 4-hour frame upwards and is expected to continue
We have a trend to stabilize above the moving average 100 again
We have an upward trend on the RSI indicator that supports the rise by breaking it upwards
We have a support area at the lower limit of the channel at a price of 1.45
Entry price 1.60
First target 1.70
Second target 1.84
Third target 1.90

OP is ready for big movePA is bullish, price is so close from price discovery mood - any known resistance, those moves are explosive and fast, parabolic.
SPOT play.
NOT A FINANCIAL ADVICE, MANAGE YOUR RISK AND USE STOPLOSS

#OP (SPOT) entry range( 0.13 - 0.17) T.(3.560) SL(1.271)BINANCE:OPUSDT
entry range ( 0.13 - 0.17)
Target1 (2.440)- Target2 (3.560)
1 Extra Target (optional) in chart, if you like to continue in the trade with making stoploss very high.
SL .1D close below (0.3832)
*** collect the coin slowly in the entry range ***
**** #Manta ,#OMNI, #DYM, #AI, #IO, #XAI , #ACE #NFP #RAD #WLD #ORDI #BLUR #SUI #Voxel #AEVO #VITE #APE #RDNT #FLUX #NMR #VANRY #TRB #HBAR #DGB #XEC #ERN #ALT #IO #ACA #HIVE #ASTR #ARDR #PIXEL #LTO #AERGO #SCRT #ATA #HOOK #FLOW #KSM #HFT #MINA #OP ****

#OP/USDT#OP
The price is moving in a descending channel on the 4-hour frame and it was broken upwards
We have a trend to stabilize above the moving average 100
We have an upward trend on the RSI indicator that supports the rise by breaking it upwards
We have a major support area in green at a price of 1.10
Entry price 1.30
First target 1.50
Second target 1.65
Third target 1.83

OPUSDT Ascending TriangleOPUSDT technical analysis update
OPUSDT has formed an ascending triangle pattern on the 4H chart. The price is now breaking the triangle's resistance, and after a small retest, we can expect a strong bullish move in OP.
Buy zone : Below $1.65
Stop loss : $1.48
Regards
Hexa

OP ANALYSIS (4H)From where we placed the green arrow on the chart, it seems OP has entered a bullish phase.
The Boolean phase pattern looks like a diametric or triangle.
If the demand 1 range is lost, the pattern is confirmed to be a triangle, but if the price is rejected upwards, the pattern is diametric.
What seems certain now is a drop to the demand 1 range
The structure and movement path that we intend for OP is clear on the chart.
Closing a daily candle will invalidate the analysis level.
For risk management, please don't forget stop loss and capital management
Comment if you have any questions
Thank You

OP - Excellent opportunity or will the support break ? BINANCE:OPUSDT (1W CHART) Technical Analysis Update
OP is currently trading at $1.764 and price has reached the bottom of the channel, OP has been trading inside the range and currently price has reached the bottom support line, in the past this support line held strongly multiple times and we are expecting the same this time. If the price bounces back then there is an opportunity for new ATH.
Entry level: $ 1.764
Stop Loss Level: $ 1.290
TakeProfit 1: $ 2.054
TakeProfit 2: $ 2.704
TakeProfit 3: $ 3.845
TakeProfit 4: $ 4.788
TakeProfit 5: $ 6.741
Max Leverage: 2x
Position Size: 1% of capital
Remember to set your stop loss.
Follow our TradingView account for more technical analysis updates. | Like, share, and comment your thoughts.
Cheers
GreenCrypto

OP Mid TermWe are expecting a rise from the green zone.
You can try a SPOT or 2-5X long position.
Take your risk, make some profit !

OP looks bullishFor the OP, it looks like we have a large diametric. It seems that we are now in the F wave of this diametric.
By maintaining the green range, it can move towards the targets.
Closing a daily candle below the invalidation level will violate the analysis.
For risk management, please don't forget stop loss and capital management
When we reach the first target, save some profit and then change the stop to entry
Comment if you have any questions
Thank You
