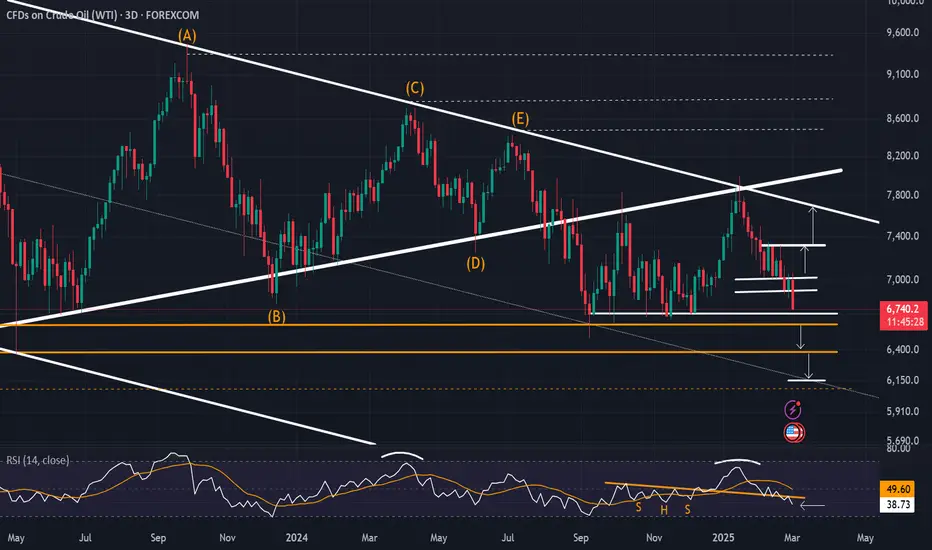
Oil Under Pressure Amid Tariff Tensions and OPEC+ UncertaintyMacro:
- Oil prices stabilised after hitting multi-month lows as the market weighed potential output increases in Apr and escalating tariff tensions among Canada, Mexico, China, and the EU.
- Meanwhile, the halted US military aid to the Eastern Europe conflict, and OPEC+ production decisions continue to pressure oil.
Technical:
- USOIL remains in a downtrend, consistently making lower lows while trading below both EMAs, signalling persistent bearish momentum. However, the price is nearing the oversold zone, supported by multiple key levels.
- If USOIL continues declining, it may retest 66.90 and 65.80, aligning with the 78.6% Fibonacci Extension.
- Conversely, holding above 66.90 could lead to a short-term sideways movement, with a potential retest at 70.20, confluence with EMA21, and the descending channel’s upper bound.
Analysis by: Dat Tong, Senior Financial Markets Strategist at Exness
Opec

Oil Drops Below $68 Amid Trade Wars and Oversupply RisksCrude Oil drops on oversupply risks and weakening demand expectations
Key Events:
- Trade wars between the world’s largest economies heightens inflation and economic contraction risks
- OPEC plans to unwind supply cuts in April despite oversupply concerns.
- Trump - Ukraine dispute may disrupt oil's bearish trend if tensions escalate with the EU and Russia.
Key Levels:
Oil eyes a 4-year support zone ($63.80–$66), and the potential for the consolidation to extend above that zone persists.
- A close below $63.80 may extend declines to $61.50, $60, and $55 (aligning with the 0.618 Fibonacci retracement of the 2020-2022 uptrend.
- A hold above $68.80 could cap gains at $70.50, $73.50, and $75.
Upside potential on Oil is expected to remain short-lived given the bearish implications of trade wars in tandem with oil's 2022 - 2025 dominant downtrend. A clean close above 78-80 zone may reinforce longer term bullish expectations.
- Razan Hilal, CMT
So far, so good... WTI oil price continues to please the bears. So far, the our stance is unchanged, we remain somewhat bearish on the price of MARKETSCOM:OIL in the near-term. That said, certain criteria still need to be met for us to get comfortable with further declines, especially from the technical side. Let's dig in!
TVC:USOIL
Let us know what you think in the comments below.
Thank you.
74.2% of retail investor accounts lose money when trading CFDs with this provider. You should consider whether you understand how CFDs work and whether you can afford to take the high risk of losing your money. Past performance is not necessarily indicative of future results. The value of investments may fall as well as rise and the investor may not get back the amount initially invested. This content is not intended for nor applicable to residents of the UK. Cryptocurrency CFDs and spread bets are restricted in the UK for all retail clients.

GBP/CAD Analysis – Key Levels & Trade Scenarios📊 Timeframe: Weekly (1W) | Current Price: ~1.8391
📈 Bullish Context:
Resistance at 1.8391:
Price is testing a strong supply zone (dark red area).
A breakout above this level could open the door to further upside.
Support at 1.8233 & 1.7677:
1.8233: Short-term support where buyers have stepped in.
1.7677: Major support level, previously tested multiple times.
📉 Current Outlook:
Price has aggressively moved up, breaking through previous resistances.
Approaching a critical resistance area, where rejection is possible.
If a rejection occurs, a retracement toward 1.8233 or 1.7677 could be seen.
📈 Trade Setups:
🔼 Long (Breakout Play):
Entry: Above 1.8400 with confirmation.
Target 1: 1.8600
Target 2: 1.8800
Stop Loss: Below 1.8230 to avoid fakeouts.
🔻 Short (Rejection Scenario):
Entry: Bearish rejection from 1.8391 with confirmation.
Target 1: 1.8233
Target 2: 1.7677
Stop Loss: Above 1.8450.
📌 Final Thoughts:
GBP/CAD is at a critical resistance; a breakout could lead to new highs.
A rejection would confirm a pullback toward support levels.
Key macroeconomic data may impact momentum and direction.

GBP/JPY Analysis – Key Levels & Trade Scenarios📊 Timeframe: Weekly (1W) | Current Price: ~189.90
📉 Bearish Context:
Resistance at 192.04:
Strong supply zone (red rectangle) where price previously reversed.
Aligned with moving averages (likely 50 & 100 periods), acting as dynamic resistance.
Support at 184.63:
Marked in blue as a significant demand zone.
Historical reaction area, where buyers may step in again.
📉 Current Outlook:
Price rejected 192.04, forming a bearish structure.
Price currently consolidating below resistance, indicating weakness.
If selling pressure continues, a move toward 184.63 is likely.
📈 Trade Setups:
🔻 Short (Bearish Bias):
Entry: Below 189.50 with a bearish confirmation.
Target 1: 186.00
Target 2: 184.63
Stop Loss: Above 192.00 to avoid fakeouts.
🔼 Long (Reversal Play):
Entry: Strong bullish reaction from 184.63.
Target: Retest of 192.04, with SL below 184.00.
📌 Final Thoughts:
The bearish trend remains dominant unless 192.04 is broken.
A clean break below 189.50 strengthens the bearish outlook.
Macro factors and volatility could influence upcoming price action.

EUR/USD Bearish Outlook – Key Levels & Trade Setups📊 Technical Analysis EUR/USD
Timeframe: Likely Weekly (1W)
Current Price: ~1.0416
📉 Bearish Context:
Key Resistance: 1.05290
This zone has been tested multiple times without a breakout, indicating strong selling pressure.
It aligns with a liquidity area visible in the red rectangle.
Also near the yellow moving average (likely 50 or 100 periods), acting as dynamic resistance.
Key Support: 1.02838
Marked in blue as a potential short-term target.
A level that previously provided support and may attract buyers again.
📉 Current Scenario:
The price has rejected the 1.0529 resistance with a strong bearish candle.
A breakdown from the gray zone suggests a potential continuation downward.
If selling pressure persists, the 1.02838 target could be reached.
📈 Potential Trading Strategies:
🔻 Short Scenario (Bearish Bias):
Entry: Below 1.0430 after confirmation with a daily bearish close.
Target 1: 1.02838
Target 2: Below 1.0200 (depending on price action).
Stop Loss: Above 1.0500 (to avoid false breakouts).
🔼 Long Scenario (Less Likely Bullish Setup):
Entry: Confirmed bounce above 1.02838 with a strong reversal candle.
Target: Retest of 1.0529, with a stop below 1.0280.
📌 Final Considerations:
The current structure favors a short-term bearish continuation.
Key areas (support and resistance) will be crucial for the next move.
Watch for macroeconomic data and volatility, as they could impact the trend.

S&P 500: Rejection at Resistance and Potential Downside RisksThe chart shows a clear rejection from a key resistance zone around 6,150 points, highlighted by the red area. After an attempt to break through, the price faced strong bearish pressure, falling back below the 6,100 level. The current retracement has led the price to test the 50-day moving average (yellow), which has so far provided temporary support. However, breaking this structure could increase the risk of a sharper decline toward the intermediate support at 5,924, marked by the dashed yellow line.
Recent macroeconomic releases, such as the decline in retail sales and weakening consumer confidence, are weighing on market sentiment, increasing pressure on stock indices. Additionally, uncertainty related to tariffs proposed by the U.S. administration is adding volatility, with investors showing signs of risk aversion. If the price fails to quickly recover the 6,100-6,150 area, the next bearish target could be the more structured support zone at 5,850-5,800, identified by the lower blue area.
In summary, the technical structure reflects a moment of uncertainty with a clear rejection from the weekly resistance. A recovery above 6,100 could bring buyers back in control, while further weakness would open the door to new declines toward lower support levels.

USD/JPY: Liquidity Grab Below Weekly LowThe chart shows that the price has grabbed liquidity below the weekly low, potentially triggering a bullish reaction. Analyzing the current USD/JPY situation, recent economic data highlights bearish pressure on the dollar due to declining consumer confidence in the U.S. and expectations of Federal Reserve rate cuts, while the yen is strengthening on the back of more solid economic indicators. Technically, the price has rejected a key demand zone and remains below the psychological threshold of 150.00, which acts as a crucial resistance. If the price confirms a bullish structure on lower timeframes, we could see an upward move towards the 152.00-152.50 area, aligning with a supply zone and moving average confluence. However, a close below recent lows could invalidate this outlook, paving the way for a further drop toward the next support at 146.00.

EUR/USD Faces Key Resistance Amid Liquidity Grab ExpectationsEUR/USD is undergoing a pullback after reaching a one-month high of 1.0528, closing at 1.04658 on February 24, marking a 0.22% decline from the previous day. The euro's recent strength was driven by post-election stability in Germany, where centrist parties formed a coalition government, boosting market confidence. However, bullish momentum has stalled near key resistance levels around 1.0530 and 1.0560, with the pair struggling to sustain gains above the 100-day simple moving average.
From a technical standpoint, the price is approaching a significant supply zone, where a liquidity grab could occur before a potential downside move. Resistance in this area aligns with broader concerns over Germany's economic outlook and coalition negotiations, which could weaken the euro’s appeal. Meanwhile, the U.S. dollar, despite recent weakness due to declining consumer confidence, remains in a favorable position for a short-term recovery, adding further pressure on EUR/USD.
If the pair fails to break through resistance, a rejection could trigger a decline toward 1.0400, with further downside potential extending to 1.0283. Conversely, if buyers manage to push past the liquidity zone, the next upside targets lie at 1.0530 and 1.0560.

GBP/USD: Bullish Momentum Faces Key ResistanceGBP/USD has reached its highest point since mid-December at 1.2690, primarily driven by the weakness of the US dollar. The pair has shown strong momentum, and as long as it holds above the key support at 1.2520, analysts see potential for further upside toward 1.2725. Positive UK economic data, including better-than-expected retail sales and inflation figures, have reinforced a bullish outlook for the pound. However, minor retracements have been observed, with slight declines following recent gains, such as the 0.05% drop on February 24. Market volatility remains a factor, with geopolitical tensions and fluctuating commodity prices impacting the dollar’s strength. From a technical standpoint, the price is currently testing a resistance zone while approaching key moving averages, which could act as dynamic resistance. The presence of supply zones above suggests that the pair could face selling pressure before a potential continuation higher. If the price fails to sustain above the resistance area, a retracement toward the 1.2520 level and possibly deeper into the 1.2400 region could materialize. Despite the recent bullish momentum, caution is warranted due to broader market uncertainties, and future movements will depend on economic indicators from both the UK and the US, as well as overall market sentiment.

EUR/GBP: Key Support Test Amid Bearish PressureThe analysis of EUR/GBP as of February 24, 2025, presents an interesting technical outlook. The price is testing a key support area around 0.8297 after a modest recovery from the 0.8271 lows. The current setup suggests a potential reaction in this zone, with the possibility of a technical rebound towards higher levels or a more significant bearish breakdown.
From a technical perspective, several key areas stand out: the upper resistance in the 0.8440-0.8460 range represents a critical level for a bullish recovery, while the lower support around 0.8265-0.8240 could act as a catalyst for further downside momentum if broken. Moving average analysis indicates persistent bearish pressure, with both the 50 and 200-period moving averages sloping downward. This reinforces the idea that, despite recent rebounds, the dominant trend remains bearish in the medium term.
From a macroeconomic standpoint, expectations regarding the UK and Eurozone economic outlook are shaping the pair's direction. UK inflation is showing signs of recovery, providing some support for the pound, but uncertainties related to economic growth and Bank of England policies could hinder a sustained strengthening of the British currency. On the other hand, the Eurozone is facing challenges linked to growth stagnation, and the ECB may maintain an accommodative policy to stimulate the economy. These factors create an unstable balance that could lead to heightened volatility in the coming days.
Technical forecasts suggest two possible scenarios: a temporary rebound towards 0.8340-0.8360 before another test of the lows or a direct break below 0.8265, which could open the door for a decline towards 0.8240-0.8220.

GOLD| Approaching Historic Highs Amid Geopolitical UncertaintyThe analysis of XAU/USD highlights a strong bullish trend, closing at approximately $2,939.41 on February 20, 2025, marking a 0.23% increase from the previous day. The recent high of $2,946.83 on February 19 indicates continued positive momentum, driven by geopolitical tensions, inflation concerns, and fears of potential trade wars, all of which have strengthened gold’s status as a safe-haven asset. The current momentum has pushed prices toward historic levels, with the potential to surpass $3,000, supported by a weaker U.S. dollar and declining U.S. yields. The chart shows a key resistance zone around $2,960, with a potential retracement towards the $2,880 area, identified as the first major support level. The current price action suggests a possible pullback before another breakout attempt. If the price consolidates above $2,900, it could accelerate towards new highs, while a break below $2,880 may drive the price toward the next support level around $2,840. The overall outlook remains bullish, with investor interest fueled by global uncertainties and the increasing demand for gold as a hedge against economic risks.

GBP/NZD Analysis: Market Uncertainty Amid Key Technical LevelsThe analysis of GBP/NZD shows recent volatility, with a close at 2.20571 on February 19, 2025, slightly down from the previous day, indicating a phase of market indecision. The previous trend saw moderate progression from February 16 to 18, supported by an increase in UK GDP, which temporarily strengthened the Pound. However, the absence of new economic data left the pair exposed to market sentiment, contributing to the decline on February 19. From a technical perspective, the chart highlights a strong resistance area between 2.21770 and 2.22180, a level that has rejected the price multiple times, suggesting that without a decisive breakout above this zone, the bullish trend may weaken. Conversely, a significant support area is located around 2.17616, a level that has already provided a positive reaction, pushing the price back up. The current price action shows a consolidation phase between these two key levels, with a recent structure of higher lows that could indicate an accumulation attempt before a potential bullish breakout. If the price manages to break above the upper resistance decisively, the next target would be around the recent highs in the 2.24000 area. On the other hand, a break below the 2.17616 support could trigger a decline towards the next key level at 2.15000, where an interesting liquidity zone is present. The combination of the recent positive GDP data and a more cautious market sentiment leaves the pair in a state of uncertainty, with a key reaction expected in the coming days depending on the holding or breaking of the main technical levels.

USD/JPY: Bearish Momentum and Key Support TestThe USD/JPY analysis as of February 18, 2025, shows a clear bearish structure, with the price breaking below key support levels, particularly around 152.70, which aligns with the 200-day moving average. The February 17 close at 151.456 confirms the downward trend after the recent high of 154.79 on February 12, highlighting the weakness of the US dollar against the strengthening Japanese yen. The yen’s appreciation was driven by Japan’s unexpectedly strong GDP data, which showed an annualized growth of 2.8%, far exceeding expectations and fueling speculation of a potential rate hike by the Bank of Japan. In contrast, the US dollar has been under pressure due to weak retail sales data and a general lack of bullish catalysts.
The chart setup highlights a key demand zone between 150.50 and 151.00, where the price is showing an initial reaction, suggesting a possible technical rebound. However, the overall structure remains weak, and unless the price can stabilize above 152.50-153.00, the risk of further downside remains high. The next significant resistance lies between 154.50 and 156.00, an area with concentrated sell orders and a potential reversal point in case of recovery. Conversely, a break below 150.50 would open the way toward 148.00 and even lower levels, with a critical support zone around 146.00.
The short-term trading range could remain between 151.00 and 155.00, with strong dependence on upcoming macroeconomic developments, particularly statements from the Bank of Japan and economic updates from the United States.

GBP/JPY: Uncertainty and Bearish PressuresGBP/JPY has shown a volatile trend in recent sessions, with a combination of ups and downs highlighting a phase of uncertainty. The last closing on February 15, 2025, at 191.618 marks the beginning of a bearish trend after the doji on February 14. This movement reflects a complex dynamic, where macroeconomic and technical factors play a decisive role in price direction. The recent rebound was supported by positive UK GDP data, which helped the pound recover from bearish pressures over the past months. Notably, on February 12, a reversal of the bearish trend occurred, with GBP/JPY starting to regain ground due to an improvement in market sentiment. Additionally, the strengthening of US inflation negatively impacted the Japanese yen, pushing GBP/JPY up by 1.22% around February 12, driven by a weaker yen following the increased strength of the US dollar. However, despite these positive elements, the Bank of England’s monetary policy has introduced uncertainty, with a dovish stance fueling pressure on the pound. The interest rate cut has raised concerns about further depreciation, negatively affecting GBP/JPY. Added to this is the earlier decline in early February, triggered by disappointing UK economic data and expectations of further BoE interventions, which contributed to a widespread bearish sentiment. From a technical perspective, the price is currently in a consolidation phase between 187.610 and 193.120, with a structure suggesting a possible expansion of volatility in the coming weeks. The key resistance at 193.120 represents a critical obstacle for a potential continuation of the bullish trend, while support at 187.610 remains the main level to watch in case of renewed bearish pressure. A breakout above the 193.50 threshold could confirm further pound strengthening, while a break below 188.00 could reopen scenarios of weakness. With a combination of technical and macroeconomic factors in play, GBP/JPY’s trend remains subject to upcoming BoE decisions and the evolution of global economic conditions, making it crucial to monitor upcoming economic releases to determine the market’s direction.

EURNZD: Key Resistance at 1.8430 and Rejection from HighsAs of February 14, 2025, the EURNZD pair is once again testing the key resistance zone around 1.8430 after showing a clear rejection in previous sessions. The price has reacted from the support zone at 1.8235, which continues to act as a strong defense level for buyers. However, the strong rejection from the weekly resistance area suggests a possible new phase of weakness.
Technical analysis indicates interaction with key moving averages, with the price rebounding from the mid-term moving average but struggling to break through the upper liquidity zone. If the market stays below 1.8435, it could trigger a decline towards 1.8235, and if broken, a further extension towards 1.8100. Conversely, a decisive close above 1.8435 could open the way for a breakout attempt towards 1.8500. The macroeconomic context remains a key factor to monitor, with the strength of the euro and the Reserve Bank of New Zealand’s policy likely to influence the future direction of the pair.

Brent Declines Amid Rising Inventories and Peace HopesOn February 13, 2025, Brent crude fell by 0.9% to $74.50 per barrel, driven by expectations of a potential peace deal between Ukraine and Russia, which could ease supply disruptions caused by sanctions. Additionally, U.S. crude inventories increased for the third consecutive week by 4.1 million barrels, surpassing analysts' forecasts. These factors, combined with new U.S. tariffs on steel and aluminum, have reinforced the bearish sentiment in the oil market.

GBP/JPY: Persistent Bearish Pressure Amid Recovery AttemptsThe GBP/JPY pair has shown recent volatility, attempting a rebound to 188.00 on February 10, breaking a three-day losing streak after hitting the weekly low at 187.00. The Bank of England’s dovish monetary policy, including the recent rate cut, has worsened the bearish sentiment on the pound, while downward revisions in the UK's growth forecasts have further weakened the GBP. Despite recovery attempts above 190.00, economic uncertainty and the central bank's negative outlook keep the risk of further declines high. The price is near a daily FVG, with potential liquidity grabs within and around the 0.62% Fibonacci level before resuming its downward movement.

XAG/USD: Silver Uptrend with Short-Term ConsolidationAs of February 11, 2025, the XAG/USD (Silver Spot/US Dollar) exchange rate exhibits a positive medium-term trend despite a recent short-term slowdown. Currently, the price is around $32.83 per ounce at the time of writing. The first resistance level is identified at $32.24, followed by a second resistance at $32.96. The first support level is at $31.52, with an additional support at $31.21. In the short term, a weakening of the bullish trendline is observed, with the price testing the high at $32.24. Technically, a potential decline towards the $31.21 support level remains possible. Recent political decisions, such as the announcement of a 25% tariff on all steel and aluminum imports to the United States, have impacted financial markets, leading to an appreciation of the US dollar and a decline in stocks. These developments could affect the precious metals market, including silver. Despite the positive medium-term trend, silver is currently undergoing a consolidation phase in the short term.

USD/JPY Approaches 152.00 Amid Yen Weakness and Trade War FearsThe USD/JPY exchange rate is recovering from recent lows, reaching 151.90 on February 10, 2025, compared to the previous close of 151.30. After a significant drop in early February, the trend shows a gradual rebound, supported by the Japanese Yen’s weakness due to disappointing macroeconomic data, particularly the sharp decline in Japan’s current account balance to 1,077.3 billion Yen from November’s 3,352.5 billion Yen. The strength of the US Dollar is also fueled by concerns over new 25% tariffs on steel and aluminum announced by President Trump, driving investors toward safe-haven assets like the Greenback.
From a technical perspective, USD/JPY is nearing the psychological level of 152.00, with key resistance between 152.40 and 152.90. A breakout above this range could signal further gains, while a rejection may trigger a corrective phase. Volatility is heightened by uncertainty surrounding the Fed’s monetary policy, as it may maintain a cautious stance on rates to counter inflationary pressures. Meanwhile, speculation about a potential rate hike by the Bank of Japan (BoJ) could reduce the interest rate differential between the US and Japan.
The Dollar Index (DXY) stands at 108.20, slightly up by 0.1% but down from the intraday high of 108.50, indicating a cautious market sentiment ahead of Fed Chair Jerome Powell’s testimony before Congress on Tuesday and Wednesday. Traders will closely watch his statements for any hints of a policy shift.

EUR/AUD: Weekly Engulfing Bar Pullback!The recent performance of the EUR/AUD exchange rate shows a fluctuating trend, with a slight recovery, closing at approximately 1.6450 in the first week of February. In the preceding days, the rate experienced several declines, with a significant drop. These fluctuations reflect the economic dynamics of both the Eurozone and Australia. In the Eurozone, inflation unexpectedly rose to 2.5% in January, exceeding the European Central Bank’s 2% target for the third consecutive month. Despite this, the ECB plans to continue cutting interest rates, expecting inflation to reach its 2% target over the year. Meanwhile, the Eurozone economy showed no growth in the last quarter of 2024, with contractions in Germany and France and stagnation in Italy. In Australia, the leading economic indicators index increased by 0.2% in October 2024, suggesting a slight economic recovery. However, Australian Treasurer Jim Chalmers confirmed a worsening fiscal deficit, projected to rise by AUD 21.8 billion over the next four years, mainly due to unavoidable expenditures. These economic developments impact the EUR/AUD exchange rate, with the Euro benefiting from a more accommodative monetary policy while Australia faces fiscal challenges. Despite the recent upward movement, the negative trends from previous sessions and technical analysis suggest caution is warranted when assessing the short-term trajectory of the EUR/AUD exchange rate.

GBP/USD: Bearish Pressure Amid US Inflation and Trade TensionsThe GBP/USD pair has recently declined, closing at 1.24445 on February 12 (-0.0233%) after a 0.6688% increase on February 11. Volatility has dominated recent sessions, with fluctuations between 1.2400 and 1.2500. The decline was triggered by US inflation data, which strengthened expectations of higher Fed rates, weighing on the pound. Despite a 2.5% increase in UK retail sales (compared to the expected 0.2%), GBP struggled to maintain upward momentum, further pressured by uncertainty surrounding US tariffs on steel and aluminum. Technically, support between 1.2320 - 1.2330 remains crucial for potential rebounds towards 1.2550 - 1.2600, but future movements will depend on upcoming economic data and monetary policy expectations on both sides of the Atlantic.

GBP/NZD: Bearish Outlook Confirmed by Head and ShouldersThe GBP/NZD exchange rate at NZ$2.1922 reflects a persistent downtrend, confirming recent weakness in the British Pound against major counterparts. The formation of a head and shoulders pattern on the daily chart suggests further downside risk, with the pair testing key support levels. Market fluctuations between NZ$2.1754 and NZ$2.22 highlight ongoing volatility driven by external economic factors, including U.S. tariffs and mixed macroeconomic data from both the UK and New Zealand. The Pound remains under pressure due to inflation concerns and lackluster GDP growth, while the NZD struggles to capitalize on the Pound’s weakness amid subdued domestic data. The technical setup and broader macroeconomic landscape signal a potential continuation of bearish momentum for GBP/NZD.
