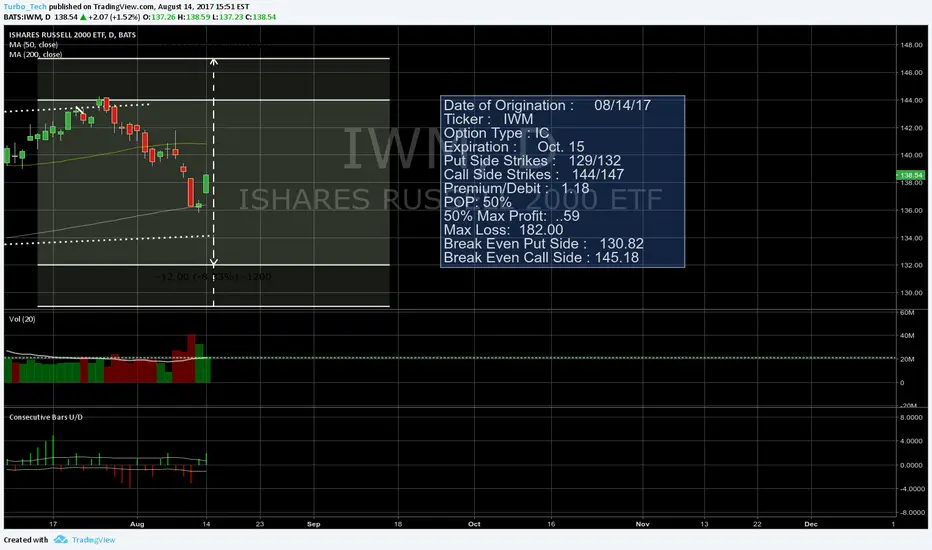
IWM 3 wide Iron CondorSold an Oct IRON condor on IWM today after taking profits on my Sept IWM IC for 35% max profit. 3 point wide on the wings here with hopefully enough cushion to make Jenifer Lopez jealous. 1.18 in credit for the option.
Option
5.21.2017 Trade Idea: BABAIf you are interested in more of our trades, check out our profile and Tradingview Indicator @ChaoticTrader

5.17.2017 Trade Idea: VIf you are interested in more of our trades, check out our profile and Tradingview Indicator @ChaoticTrader

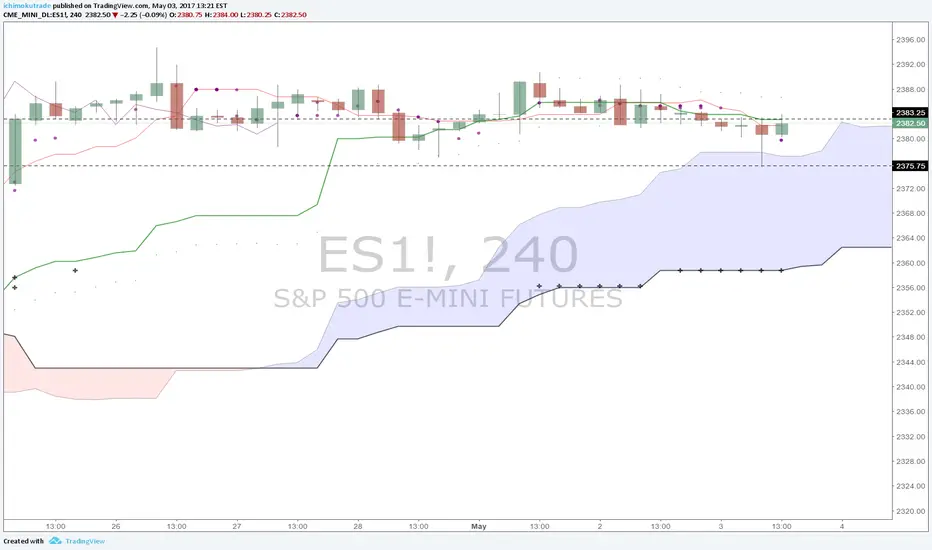
$ES Emini SP500 held support 2375.75 and now at major resistance$ES Emini SP500 held support blogged this morning 2375.75 and now at major resistance 2383.25. Tight stop/exit

Near the money Strangle on Euro Stocks (FEZ ETF)We have the French election coming up and other than my trades on FXE I didn't have much on play for that.
The IV Rank on FEZ is pretty high at 77 and I am selling the strangle with 30 days to go. After the first part of the election we might get a decent volatility. I am betting that Euro companies won't be impacted as much and I can get paid on the expensive premium.
Sold the 35/36 Strangle for $2.03 per contract.
55% probability of profit.

E61! - Short Strangle 09.06.2017Since the EURO did not break out after the first election in Europe, and the Commercals being neither long nor short, I tend to sell a strangle expecting the EURO to move sideways.

Volatilitäty IndicesThis picture shows a comparison of many well known volatility indices and shows, which Vola Index is moving upward or moving low.

SI1! - Silver Future (short CALL Option)
Commercials are going short on silver
volatility is low, so small trade sizes are adequate
Strike 20, duration 29.06.2017

$NFLX SIGNAL 4/19Today's was a Netflix ($NFLX) trade. Check out our profile link to read more.
Synopsis:
Netflix (NFLX) has had a really strong uptrend run since the election and has gained a massive percent since their last earnings call. Unfortunately, the most recent quarterly earnings caused a clearly evident swing in emotions of traders, because the price crashed almost 1% only to rally back up in the after-hours from the reporting period.
So what is the hubbub all about? Well, Netflix is without a doubt a power-player in the tech/entertainment industry, but the competitive landscape is becoming fierce, with the likes of Amazon (AMZN) studios producing a hit winning accolades as well as the traditional box-office Hollywood entertainment market.
One can gather a lot of investing-intel from an earnings release, and how upper management handles the call. Reed Hastings definitely had a “spin” on this release, urging analysts to focus on “long term” subscriber growth due to the hiccup this previous quarter. For us, this is a fundamental trigger to a stock price downswing, especially on the negative cash-flow expenditures the company is about to undertake for the next couple of years to acquire content. Since those costs are going nowhere but up, this is another negative trigger set to send the stock downward.
As far as the stock is concerned, we hardly ever go short and prefer selling a spread or buying a put option. For NFLX, this is no different. If you’re more risk tolerant, then the plain put buy works. If you want to play the “time-card”, and earn premium, then a skip-strike butterfly or vertical spread works as well.

$TRIP has a seasonality of 90% bearish probabatility$TRIP has a seasonality of 90% bearish probability, Entered a day trade with options. Goal is to get the preserve mode i.e. pivot low. Once at preserve mode, take 50% positions off and then move it to higher time frame to ride it to earnings (if possible with stop)

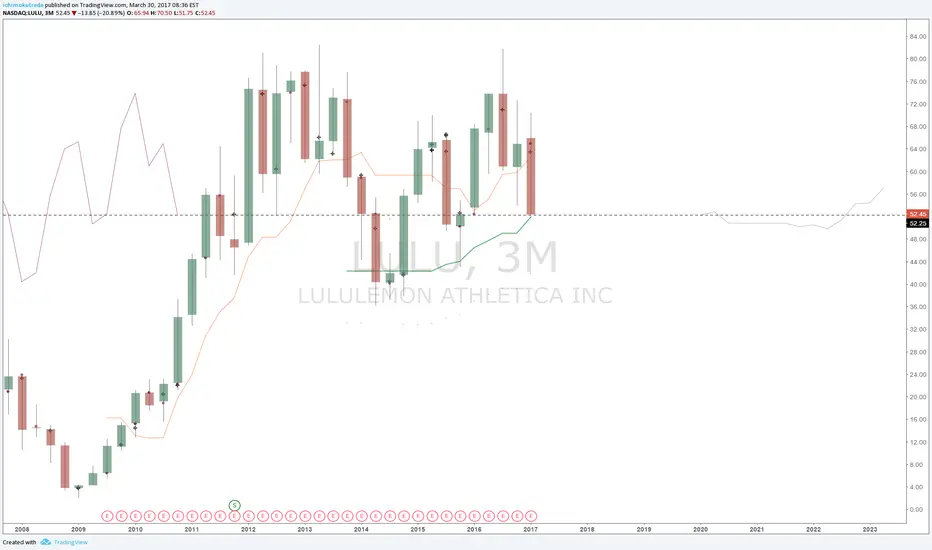
$LULU gap down on earnings to major support$LULU gap down on earnings to major support #stocks #stock #options #option #stocktweets #earnings #gap #gap #ichimoku
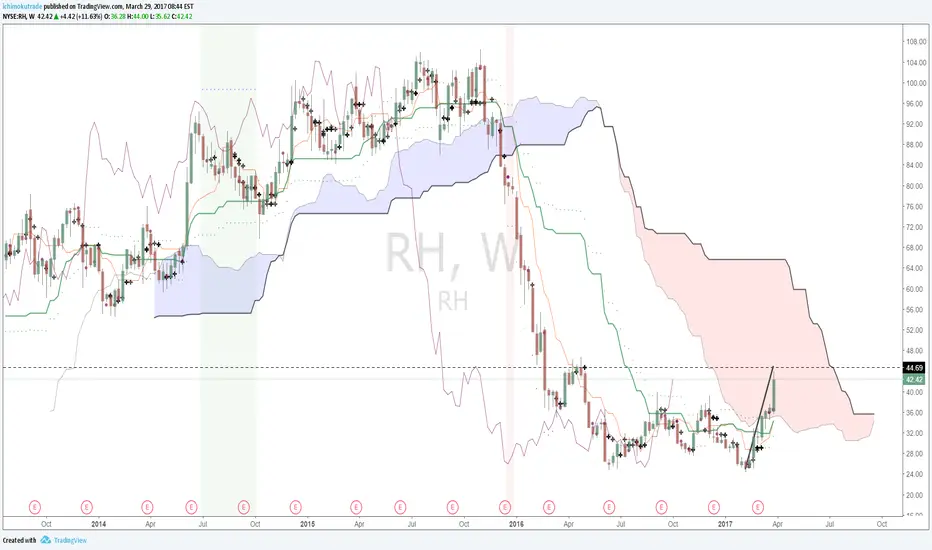
$RH approaching major resistance at 44.69.$RH approaching major resistance at 44.69. Has moved 80% in 7 weeks!
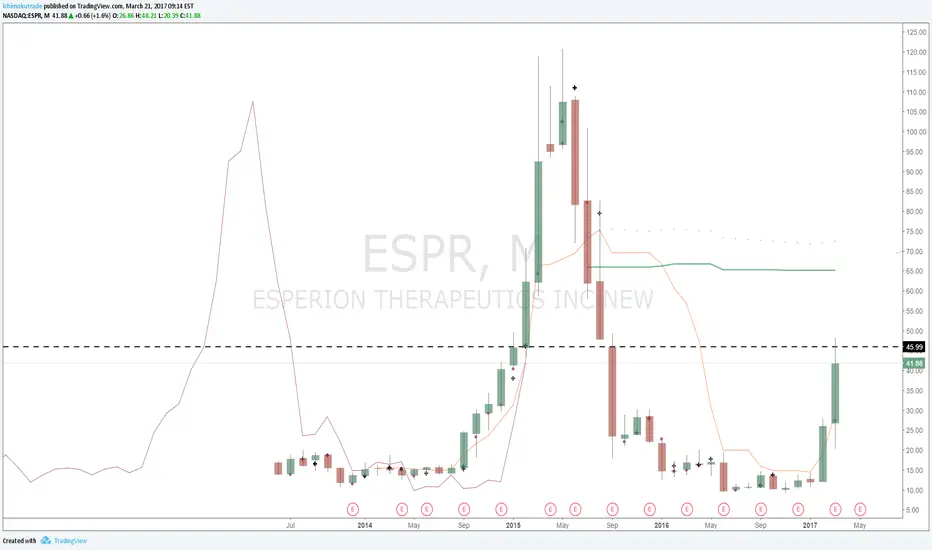
$ESPR hits major resistance with unusual put volume 2017-04-21 $ESPR hits major resistance with unusual put volume 2017-04-21 40.00 P BOT @ 3.20 #options #option #ichimoku #stocks #stock #stocktweets
TGT - Hi Risk/Reward Option play, $45 July puts @ $0.45TGT is a possible High risk setup with high potential reward. It has broken down a long term upward channel & Channel breakdown target is around $45-46.
And on the daily chart it has a downward trend, which targets around $44. To play this we are considering $45 July-17 Puts, Currently around $0.45
* Trade Criteria *
Date first found- March 14, 2017
Pattern/Why- Upward channel breakdown
Entry Target Criteria- Break of $54.35; We would consider July $45 Puts
Exit Target Criteria- $44-45
Stop Loss Criteria- N/A
Please check back for Trade updates. (Note: Trade update is little delayed here.)

AMZN - Potential Head & Shoulder formation short from $844.33AMZN forming a potential head & shoulder. We would like to take the advantage from the top when it is forming the second shoulder, and a break of $844.33 will be a good entry point.
For trade we would consider $850 Apr/May-17 Puts, last traded for $23.75 & $38.02 respectively.
* Trade Criteria *
Date First Found- February 23, 2017
Pattern/Why- Potential head & shoulder
Entry Target Criteria- Break of $844.33
Exit Target Criteria- $802.13
Stop Loss Criteria- $858.13
Please check back for Trade updates. (Note: Trade update is little delayed here.)

DIS - Upward channel or Rising wedge breakdown short from $108.5DIS was going higher within an upward channel or rising wedge formation. It seems broken down the pattern, retested the broken support and getting ready to rollover. It would be a good short, If it breaks below 50 day MA, and for trade we would consider $110 May-17 Puts
* Trade Criteria *
Date First Found- February 23, 2017
Pattern/Why- Upward channel or Rising wedge breakdown
Entry Target Criteria- Break of $108.50 and MA-50
Option - $110 May-17 Puts
Exit Target Criteria- $104.13 & lower
Stop Loss Criteria- $111.07
Please check back for Trade updates. (Note: Trade update is little delayed here.)

XYL- Short at the break of 49.33 to 46 or lower XYL looks very suitable short opportunity as it has lots of weakness. It has moneyflow divergence & insider selling.
It also breaking down from a long upward channel.
We think it will decline to 46 & lower, and we are considering $50 January puts, last traded for $2.55
You can check our detailed analysis on XYL in the trading room/ Executive summary link here-
www.youtube.com
Time Span:5:45 "
Trade Status: Pending

IMAX - Upward channel Possible earnings play, $31 March PutsIMAX seems running within an upward channel, also forming a possible bear flag formation. On the other side we have the earnings coming in 2 days. So we would like to take advantage with option, and we would consider $31 March-17 Puts, last traded for $1.25
* Trade Criteria *
Date First Found- February 19, 2017
Pattern/Why- Upward channel, Possible bear flag, Possible Earnings play
Entry Target Criteria- Current price
Exit Target Criteria- $29
Stop Loss Criteria- N/A
Please check back for Trade updates. (Note: Trade update is little delayed here.)

Neutral position on BTCI currently have a debit spread open on BTC, with a $100 spread. BTC 31mar17 1100/1200.
I expect the price to be trading within this range for a bit, however not all of it is completely sound. The probability of the call leg being In-The-Money is about 60%, and as of current it is trading pretty close to my strike price. To hedge that, I opened up my short leg with a few more contracts, to collect premium and be net profit at expiration, because there's a 40% chance of it ever going In-The-Money from that strike price.
If all else fails, I'll adjust my position, and roll down my long call to a lower strike. For now, that doesn't seem necessary. All of the greeks are favourable. Theta decay is high on the short side, but that's also favourable- you want the top option to expire worthless so you get that sweet, sweet premium.
Good luck!

IVN or IVPAF - has huge potential to be 10-20 bagger. IVN or IVPAF (US) has huge upside potential. Our fundamental Analyst Strath thinks that it is like buying a option without expiration data & it will be 10 - 20 times bagger over the years to come.
Trade Criteria
Date first found - January 17, 2017
Entry Target Criteria- current price
Exit Target Criteria- Momentum
Stop Loss Criteria- N/A
(Note: Trade update is delayed here.)

$ROK at major support...do or die $ROK at major support...do or die. Higher time frames still bullish. Worth taking a risk here with a small risk only

X- Speculative Call option trade as it forming a Flag formationX seems forming a possible Flag formation, clearly seen in weekly chart. It also shows a small downward channel. At the breakout it can go up to 55 area, and to catch the gain we would consider $33 March Calls.
Trade Criteria
Date first found- January 25, 2017
Entry Target Criteria- Speculative entry point at current price, confirmation at the Break of channel ($36.67)
Exit Target Criteria- First target $45, Second target $55
Option- $33 March-17 Calls, currently $3.10/3.15
Stop Loss Criteria- N/A
(Note: Trade update is delayed here.)
