i just be waiting for the fib levels to get broke...there no such big bad news in the market yet the sentiments are still a bit bearish. will be wating for the bearish signal. not so comfortable to take long position for today.
Options-strategy
SELL Opportunity on the DAX TP is 14437
Take advantage of this with put calls with expiry of your choice.
Cheers

XOM to test the highsXOM has a high probability to test its recent highs. I feel the May 20, 2022 87.5 calls seem cheap, 20% and I'm booking half and letting the rest ride. I am no pro but typically summer months cause oil to rise anyways. We shall see!

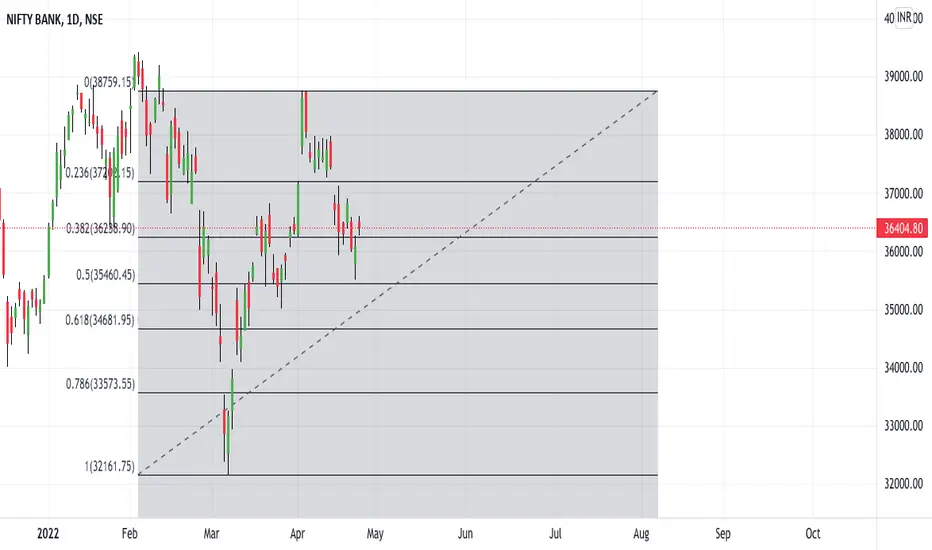
BIG move ahead in banknifty.Banknifty had been spending last 7 days in a narrow range . we had seen some selling pressure but bulls were able to hold the important level of banknifty.
if banknifty closes above 38200 in daily time frame we can hold CE positions in long side for the entire week.
and if breaks down the 37360 level in the daily time frame we can see a down side move.

BTC1! (Bitcoin Futures) - Bullish Double Bottom at Support - 4HRBTC1! (Bitcoin CME Futures) has double-bottomed above $39,500 trendline support (4-hour chart).
If support prices hold, Bitcoin could rally over time to resistance prices above.
Entry (long): $40,165
Profit Target +7% (exit): $42,915
Stop Loss -3.5% (exit): $38,640
Utilize stop loss, position sizing, risk management.
Note: Crypto market has short-term correlations with the USA stock market & tech stocks. Support prices need to hold strong, and bullish continuation is needed to sustain a bull rally.
All content is Not financial advice. Trade at your own risk.

an end of a bull run...?markets, sentiments, and behavior all seem weak at least to me. motivation is not high to take any long position. ya but from an intraday point of view, will stay neutral before setting any bias. major levels marked, will follow the market for tomorrow's trade.

BUY Opportunity on the NASDAQ TP is 14750
Take your positions and make some good ROI on this Opportunity.
I post an Opportunity only after i have taken the trade myself.
My accuracy is 100%

BUY opportunity on WBA Earnings per share came in higher than estimates.
My proprietary analysis shows buy opportunity with Target at $47 per share.
do not miss this opportunity.

EURUSD potential long...Potential bounce on EURUSD from current support level , buy if support holds towards retest of 1.10 zone..
Or BUY 1.10 Strike CALL option of 22 APR or later expiry....
>Follow us for more..

BUY opportunity on the DAX!Lovely buy opportunity on the DAX!
make yourselves some good money buying 14500 call options with April 25 for expiry
14500 is the target
Like and subscribe.
Cheers!

will today GOLD will fall ..? Buying Put options exp 07aprPrice is trading sideways and has retested many times horizontal support, with todays FOMC meeting minutes we expect volatility in gold price and potential of price breakout towards the downside....
in order to benefit from current scenario we can PUT options at 1920 strike price or below to get good RR and maximum risk of 2.20 euro per lot ( multiplied by number of lots you take ) for example in 5 lots max loss is around 11 euro only.. irrespective of how big price movement can be against ur trade..
Follow us for updates..

SHORT position on NASDAQ This is a great opportunity that I wouldn't fail to capitalise on.
Bought me some 14850 options contract with April 25th for expiry.
My accuracy is 100%

Remora Report, pump over going shortRemora Report 4/2-4/8 Swim with the whale and share its meal or be eaten like a minnow *living thread through the week, things change over time***
Earlier today we say close to 1billion in stable coins moved into exchanges, this proved the pump now
The open interest dropped and now so will the price, longs are closing our on longs vs shorts
twitter.com
We should trend sideways around 3500 for the coming days and options expiry on the weekly shows a drop by 4/8/22 to $3200 *this price will change over time
SO we should see lower lows after potentially Tuesday
www.coinoptionstrack.com

GME Short Play - Down to $130s by EODCurrent support for GME at $160.
Heavy sell pressure with regular drops below support before recovery, plus multiple previous supports shattered.
GME likely to fall to next support, likely the prior resistance at $136-$137 range by EOW (4/8) as bears have no sign of releasing pressure.
Puts on GME for $136 strike.


VXX Bearish inclined Naked Calls 1 Apr Expiry (Apr Track 1)Whats The Plan/Trade/Thought
I purposely ended my March trades last week because I felt this week would be super volatile given the Fed announcements on interest rates. This play turned out well as I got to write VXX calls that end 1 Apr at an amazing price
On the 15 March, I noticed that the VXX had stopped correlating with the market and I believe this had to do Barclay suspending new share creations of their VIX Short Term futures ETN (VXX). In a statement, the bank said it ran out of issuance capacity for the two products and would halt new creations indefinitely. It claimed the halts were not a result of the war in Ukraine
This divergence, allowed me to quickly write VXX Call options that expires 1 April at $3 a contract. I decided to use a smaller Margin (50k) because it is still a VUCA global situation and I wanted to have room to maneuver. I have also never seen the VXX diverge so drastically before.
I also believed that the Fed’s announcement would already be factored in to the past weeks and current volatility
I Feel
Pretty damn good, the VXX as aligned back to the market and right now the market is pretty bullish. Lengthen my distance to strike.
Imagine Yourself Taking The Other Side
This trade is very opportunistic in timing and volatility. There is no way I would take the other side given the price movement.
Imagine Yourself As A Neutral Observer
The risk of this was the unknown of why the VXX was diverging from it’s original intention and what the implications where.
Look For New Information
I did a search to understand what was going on with the VXX, but I decided that it was better to look and based my decision on the current sentiment of the market.
How Do I Feel Now
I am very very happy with this play as it mitigated risk by having a shorter time frame, high contract price and also leveraged my understanding and tracking of the market’s key events.
Trade Specs
Sold 60 Calls @ 3.00 - Strike 58
% to Strike 41%
ATR 98%
BP used 51k
Max Gain: 18k

history repeats itself..simple yet powerful price action. no assumptions on market, major levels are marked be neutral but don't forget to apply yours strict money management rules. wish u a profitable expiry traders.

Eve & Adam Double Bottom confirmation on Costco ($COST)Earlier this month, Costco made confirmation of an Eve & Adam Double Bottom chart pattern as it began seeing daily closes above the mid range between lows. This pattern indicates a fairly high probability (about 88%) of a bullish reversal relative to the sell off which from the recent all-time high (571.49) achieved on December 29th, 2021.
Today, the price is within 10 points of the all-time high. I'll be looking over the coming weeks to see what happens next, and for possible positions. From here, I see one of two likely outcomes over the near term:
A) COST breaks out above the previous high and likely has a forcible move to the upside, or...
B) COST gets rejected from the current levels in the near term and has a pullback to somewhere around $520
In the case of A , I'll be looking to short either with a PUT spread, or potentially straight up long PUTs - which have a greater risk/reward but are enticing considering the macro picture of the broader market/economy as a whole. In the case of B , I'd shop for a long position with some kind of CALL spread.
The statistics indicate that track B has about a 2/3 chance of playing out. This could be even more advantageous because it could potentially offer both decent long and short opportunities over the next few months. We'll have to see where the chips fall.

another big move is coming traders..?pure price action levels are marked, traders. volatilities are high in the market. still no positive news in the market yet. so i wiill kepp my bias to neutral will take an action when price processed any of marked line either up or either down. best of luck traders.

BEARS in controlTSLA was not able to rally enough momentum to the upside.
Friday March 11,22
TSLA expected to reach and break 780 to the downside.
With possible targets @ 767.76 and 729.44 do not want to leave the possibility of it reaching 690
What can happen before this?
A bounce from current position to 814.44
or a complete retest of the contended 850.

VXX Bearish inclined Naked Calls 11 Mar Expiry (Mar Track 1)Whats The Plan/Trade/Thought
I entered this position as I believe that we are currently in a sideways bearish situation. The markets took huge dips since late Nov to Jan and while it has recovered some of that loss. The S&P and especially the NASDAQ show that at least for now, the constant bold bullish days are narrowing
Even though I am taking a sideways bearish stance. I still sold calls as we have just gotten out from a terrible 3 months of nose bleed drops and I think there will be some respite where market participants will try to determine what is the next direction
Writing calls also allow me to develop a hedge on the other trades which will be bearish
I Feel
I entered this trade on Monday and it feels almost clinical as it was already part of my plan and the indexes were aligned
I would have liked to get a better price to weather some potential volatility but it is a decent price at 0.71
I would have also preferred to have this trade expire on the 4th March way before the mid March inflation implementations
Imagine Yourself Taking The Other Side
I would be slightly worried as the market in the past 2 days have been bullish.
Also I did try to initially take a sold PUT trade, but the prices for them and the % from strike were not optimal. I guess the market expects more bullishness?
Imagine Yourself As A Neutral Observer
VXX eats alot of margin fast as it is also a reflection of the tech stocks. And that could limit the fund’s movements.
Regardless of direction I think with a good 63% of space between the entry and strike is prudent
Look For New Information
I am accepting that if the market does furiously dip too fast and too hard. I might be in a difficult position. The good news is that the major Tech earnings are over.
How Do I Feel Now
I neither feel happy or worried. Just somewhat clear but edgy given what we have just gone through in Nov - Jan
Trade Specs
Sold 125 Calls @ 0.71 - Strike 33
% to Strike 63%
ATR 64%
BP used is 91k
Max Gain: 8875

JWN Bearish inclined Naked Calls 11 Mar Expiry (Mar Track 2)Whats The Plan/Trade/Thought
I identified this trade by looking at Finviz Groups and shortlisted the mid volatility Industry players (1 Month bull, 2 - 1 Week bearish). This was because I wanted to be trading in industries with less volatile price movements. Previously for the past 4 months I have been trading in industries at the forefront of any movement. Travel, Banks, VXX
JWN is part of the department store industry and has seen a huge dip (20%) on the 24 Nov due to lacklustre results. While I don’t expect any huge dips in the near future, I also don’t expect huge bullish jumps especially with the current climate
The other department store counters I explored were M and KSS. I liked KSS’s price movement also as it already spiked on the 24 Jan due acquisition news. M did not provide a good price for options contracts
I Feel
I felt good for this trade and tactic as I have adjusted by trade selection and strike prices towards a volatile market bearish ranging market.
This means I will take extra far strikes, even through it means sacrificing some alpha
Imagine Yourself Taking The Other Side
I would feel afraid given all the negative news on Ukraine and Inflation. I do not think I would take this trade on the opposite side at all.
Imagine Yourself As A Neutral Observer
While there is confidence in selling calls, there is also the earnings release on the 1 Mar. But given the entire market I think this is a safe bet. There is enough room for the price to rise (33% from strike) and it expires on the 11 March just before the release of the Interest rate increase (Week 14 Mar).
Look For New Information
I am clearly rejecting the risk of earnings and if I am wrong in this trade. This would probably be the reason.
How Do I Feel Now
I feel confident since was planning it and since I entered. This is a good trade and if it goes south it would either be because of me ignoring Earnings or just how the world turns.
Trade Specs
Sold 270 Calls @ 0.33 - Strike 27
% to Strike is 33%
ATR is 55%
BP used is 55k
