Options-strategy

XRT ETF Bullish inclined Naked Puts 18 June ExpiryXRT is my JETS replacement. This month I was also trying to enter JETS but I couldn't get in at a good price.
XRT is an ETF reflecting the US retail industry, specifically the Consumer Discretionary segment. I selected them because with the pandemic optimism and the decreasing unemployment, I expect the customers to be less tight on their retail habits especially on everyday items.
ATR is low which is a good sign but my worry is the S/R line just above at 95, which might cause a retracement. But if it breaks through it would be a nice padding.
Sold 50 Puts @ 0.5 Strike 82
BP Block: 43K
Max Gain: Est $2500
% Distance to Strike: 13%

ROKU possible upsideROKU just broke out of this triangle, showing some strengh,
Has possibility to run back to top of triangle

NIKE Put Option Play - Ex-Dividend Expiration 5/28NYSE:NKE NIKE (NKE) Put Option Play - FRI 5/28
I hope you guys were able to capitalize on todays NKE Put option play. I had to wait it out but it did pay out a nicely.
OK, as many of you know, today 5/27 was the last day to buy NKE shares in order to qualify for Nike's dividend payment.
Those who were only holding for the dividend are able to sell tomorrow 5/28 and still receive their payment.
If you look thru NKE chart history you can clearly see a sell off directly after each qualifying date.
SNAP has ran up nicely ALL WEEK after being shorted/manipulated last week so that many CALL options would not cover.
I think with the potential inflation data looming over the market and it also being the end of the week, we are going to be seeing folks take some profits.
Tomorrow 5/28 the Personal Consumption Expenditures Price Index will be released.
This index is what is used by the FED as their preferred inflation measure.
If this shows that inflation is going higher than expected, it could cause the FED to act sooner and the market WILL react.
Taking into consideration these factors, I think it is likely we have a bearish day tomorrow.
Pay very close attention to futures and the 10-Yr bond yield tonight and before market open as this should give us a feel as to what type of day it will be.
Possible Option Play NYSE:NKE
Strike Price: $136-138 Put
Expiration Date: 5/28 or 6/4
Stop Loss: 40%
Notes: Watch price action & volume in pre-market. Make sure there is liquidity/open interest in the option.
This will be a quick in & out play as I'm anticipated a sharp gap/spike to the downside.
Open to all questions, critique and conversation. I'm a beginner and would love to know what you know and pick your brain.
Thanks for reading & happy trading tomorrow!
Disclaimer: This is not financial advice. These are just my ideas and notes on what I may do. NYSE:NKE

Option Strike Price "Secrets" In this article you will learn...
- what a strike price is,
- the different intervals for strike prices,
- how to pick the right strike price,
… and much more.
Let’s get started.
1.) The basics: What is the strike price?
Strike Price Definition:
The strike price of an option is the price at which the option buyer has the right to buy or sell an underlying security.
As an example, if you are buying a CALL option of AAPL with a strike price of 126, then you have the right to BUY 100 shares of AAPL for $126.
And if you are buying a PUT option of AAPL with a strike price of 125, then you have the right to SELL 100 shares of AAPL for $125.
Strike Price Intervals
When you open an options chain, you will see all the different strike prices that are available.
The strike price intervals are set by the options exchange and will change depending on market conditions and the price of the underlying stock.
There are four commonly used strike price intervals: $1, $2.50, $5, and $10.
There are currently no strict standards and the exchange reviews and decides on the strike price interval of each optionable stock from time to time in order to adjust policies to better cater to trading needs.
Here are some general guidelines provided by the Chicago Board Options Exchange (CBOE):
- 2.50 points strike price interval is used when the underlying stock is trading between $5 and $25,
- 5 points strike price interval is used when the stock is trading between $25 and $200,
- and 10 points strike price interval is used when the stock price is over $200.
But these are just guidelines. The options exchanges decide on strike price intervals based on market demand and trader’s needs) more than any strict mathematical formula.
In the example above, you see that AAPL is trading at about$127.
So according to the guidelines, the strike price interval should be $5.
But since AAPL is a very volatile stock that currently moves $2.50 per day on average, which is around 2% per day, the $5 strike price intervals wouldn’t make sense.
That’s why the exchange decides to only offer $10 intervals to best serve the trader.
Strike Price, Option Premium & “Moneyness”
When buying or selling an option, you must choose a strike price, and often you will hear terms like:
- In-The-Money (ITM),
- At-The-Money (ATM),
- or Out-Of-The-Money (OTM).
I call this the “Moneyness” of an option.
In-The-Money Options Strike Prices (ITM)
TM Call Options will have strike prices below the current stock price.
And ITM Put Options will have strike prices above the current stock price.
In the example above, AAPL is trading at around $127 right now.
Therefore, the strike prices of 125 and below are considered ITM for Call options.
And the strike prices of 128 and above are considered ITM for Put options.
At-The-Money Options Strike Price (ATM)
An ATM option would be the closest strike price to the current market price of the stock.
For our AAPL example (The current price is about $127), the strike prices of 126 and 127 are the closest strikes to the market.
So these strikes are considered ATM for both Call and Put options.
Out-Of-The-Money Options Strike Prices (OTM)
An OTM Call Option’s strike price would be above the current market price of the stock.
With an OTM Put Option, the strike price would be below the current market price of the stock.
For our AAPL example (The current price is about $127), the strike prices of 128 and above are considered OTM for Call options.
And the strike prices of 125 and below are considered OTM for Put options.
2.) How to Pick the Right Strike Price
Wow! So many strike prices!
So how do you pick the right option strike price?
Are some strike prices more desirable than others?
Absolutely!
It really depends on what you are trying to accomplish:
Do you want to BUY an option and make money?
Do you want to SELL an option, collect premium and let it expire worthless or
Do you want to SELL an option, collect premium, and get assigned?
For now, let’s keep it easy.
Let’s say you want to make money with a CALL option.
Call option strike price example
We will use AAPL again as an example.
Right now, AAPL is trading at about $127.
Let’s say you’re bullish AAPL and expect Apple to move up to 135 within the next month.
If you were to look at an options chain, you would have several choices.
a.) You can buy a cheap OTM option with a strike price of 135.
The last price of the option was $0.86.
Since options come in “100 packs”, you would have to pay $86 for the option.
This would allow you to buy 100 shares of AAPL at a price of $135.
b.) You can buy an ATM option with a strike price of 127.
This option is more expensive. The last traded price was $3.80, so you would have to invest $380 for this option.
And this option would allow you to buy 100 shares of AAPL at a price of $127.
c.) You can buy an ITM option with a strike price of 124.
This option is the most expensive. The last traded price was $5.90, so you would have to invest $590 for this option.
And this option would allow you to buy 100 shares of AAPL at a price of $124.
Now let’s say that AAPL never goes back up to $135.
Let’s say that on expiration day (June 11), AAPL is trading at $134:
a.) OTM Option with a strike price of 135
This option allows you to buy 100 shares of AAPL at $135.
Since AAPL is trading at 134, that wouldn’t make sense.
Why would you pay MORE for 100 shares of AAPL than the underlying stock price?
So this option is worth nothing, and you lose the $86 option premium that you paid.
b.) ATM Option with a strike price of 127
This option allows you to buy 100 shares of AAPL at $127.
Since AAPL is trading at 134, you could buy 100 shares at $127 and immediately sell them for $134.
In this case, you would make 134–127 = 7 per share.
1 option allows you to buy 100 shares, so your profit is $700.
You paid $380 for this option and make $700.
That’s a net profit of 700–380 = 320 or 84% based on your initial investment!
c.) ITM Option with a strike price of 124
This option allows you to buy 100 shares of AAPL at $124.
Since AAPL is trading at 134, you could buy 100 shares at $124 and immediately sell them for $134.
In this case, you would make 134–124 = $10 per share.
1 option allows you to buy 100 shares, so your profit is $1,000.
But you paid $590 for this option to make $1,000.
So the net profit of this trade is 1,000–590 = 410 or 69% based on your initial investment.
Let’s review:
OTM Option: $86 loss
ATM Option: $320 profit = 84%
ITM Option: $410 profit = 69%
As you can see from this example, it’s super important to pick the right strike price.
The underlying security (AAPL) moved from $127 to $134. That’s a 5.5% move.
Often traders who are new to options pick the cheapest options contract, i.e. the OTM option.
But you would have lost the whole option premium.
So should you pick the most expensive one?
As you can see in this example, picking the most expensive option (i.e. ITM option) would have yielded the higher DOLLAR amount.
But in terms of Return on Investment (ROI), the ITM option was best.
Based on the trading strategy that you use, I can give you several guidelines on how to pick the right strike price.
In a nutshell, when you are BUYING options, you want to buy an ATM or ITM options contract.
And when you are SELLING options, you want to sell OTM options.
More about that later.
3.) Three Important Things You Need To Know
There are 3 more things you need to know when about strike prices when trading options:
What happens when a call option hits the strike price?
What would have happened if AAPL would have traded above the strike price of $135 before expiration?
Nothing — unless you choose to exercise the option.
But if this happens before the expiration date, then it would be better to sell the option since you would make more money.
How do I change my strike price once the trade has been placed already?
You can’t.
You need to choose a strike price when you enter the trade, and you can’t change it while you are in a trade.
You can only “roll” the option, and here’s how it works:
Let’s say you bought the OTM option with a strike price of $135.
And you realize that it was too ambitious and that AAPL probably won’t hit 135 before the expiration date.
So you could “roll” the option by selling your 135 call and simultaneously buying the 132 call.
What Is Spot Price and Strike Price?
The SPOT PRICE is the current price of the underlying security, so using AAPL as an example, Apple’s current spot price, at the time of this writing, is $126.76 which is the price it’s currently trading.
The STRIKE PRICE is the price at which you can buy or sell the shares of the underlying security on or before expiration.
Summary
s you can see, picking the right option strike price is extremely important.
It will affect your returns and it could even make or break you in the market.
In a nutshell, when you are a BUYER, you want to buy ATM or ITM options since even a small move in the underlying stock price can yield double-digit returns.
When you are a SELLER, it’s the opposite: You want to sell OTM options that have a low probability of getting assigned.

Developing a ChannelI see Yelp developing a channel between 37.31 and 40.95. There's a possibility that this flag pattern turns into a continuation of a previous up trend so I am cautious but today opened a broken wing iron condor to profit the most if it stays in the said range but still make a slight profit slightly above or below. If it breaks resistance, then I will roll the puts to create an iron butterfly; even a partially inverted iron condor if needed. I can also roll the calls to protect the bottom if the price falls below support but will have less room to defend serious price drops since that is the side of the long wing.
Spread:
Brought: Jun 18 34.5 Put
Sold: Jun 18 38 Put
Brought: Jun 18 39.5 Call
Sold: Jun 18 43 Call
Credit: 1.80
Profit Range: 36.19 and 41.30
Max Profit Range: 38.00 and 39.50

Avoid Unprofitable Options ! - GME ExampleHello everyone, this is an example of how to detect unprofitable options BEFORE you take the trade , to better your chances.
We are all doing this (trading) for our own personal reasons, so we need to make sure we succeed.
I see many people want to SHORT GME, some other people suggest they buy PUT options on GME ---> This is a MISTAKE! Because those options are considered not probable to generate money.
In this example of GME (notice this is LOG CHART), you can buy a relative short-term put option for 41 days, but as you can see, to make 2 points of your risk you need the price to crash to a price of $50 within 41 days.
Why is it not profitable?
It costs 34.3, so you need the price to move down 34.3 dollars to be break-even, then another 34.3 dollars to 1 point of profit, and another 34.3 dollars to make 2 points of profits.
All this within 41 days... price could stay flat on a range of 160-255 and only then crash...
Assume that you fantasize about a 3 point profit on this PUT option, do you see the purple line? this is where the price needs to get so this fantasy will be true. HIGHLY UNLIKELY to happen.
So just avoid it!
Now, we will check the long-term option, maybe it gives us better results...
If we look at the long-term put option for 97 days, to make 2 points of profit you need the price to crash to 6!!!
So just avoid it!
It is fair to say though, that the longer-term put option, if someone thinks that a crash will happen testing the price of 45 within the next 3 months, he has a play of 1 to 1, that could be profitable.
But you can clearly see, that once you get that 1 to 1, you better snatch it and grab it because you are probably not going to get more $$$ from this trade.
Currently, the options on GME are not worth it (unprofitable), because the implied volatility is very high (150%+), they are very expensive.

Sell naked call Natural GasHistorically NG goes sideways or down in this period of the year, NG is usually cyclic.
The price of $3 is a psychological barrier.
10 contracts of naked calls worth $3200 of premium.
I have follow-up action of case price or volatility will rise.
81% probability with the current market conditions.
Chobotaru Indicator

🍋 LULU Trade Plan (5/25)-(6/4) 👧🍋 LULU Trade Plan (5/25)-(6/4) 👧
📈 Long Above 316.75
🎯 TGT near 319-320, 322-323
❌SL 314.30
📉 Short Below 314.30
🎯 TGT near 312.60, 310.40, 307.70
❌SL 315.90
✅Trend Line Confluence from March 2021 Lows.
✅Earnings Report coming up on June 3rd.


Sell In May and Go Away?You might have heard the saying “Sell in May and go away.”
It is an old investing adage that has been around for decades, but does it actually work?
In this blog post, we are going to find out what’s best to do.
We will discuss:
1. What is the meaning behind “Sell in May and go away?”
2. Does sell in May and go away work?
3. Should you sell in May and go away?
4. Two reasons not to sell in May and what to do instead.
Let’s get started:
1. What Is The Meaning Behind “Sell In May And Go Away?”
The saying “Sell in May and go away” has been around for a long time.
It was first recorded in 1937 by John Hill via The Financial Times of London.
The original saying was “Sell in May and come on back on St. Leger’s Day.”
This phrase refers to a custom of aristocrats, merchants, and bankers who would leave the city of London and escape to the country during the hot summer months.
St. Leger’s Day refers to the St. Leger’s Stakes, a thoroughbred horse race held in mid-September and the last leg of the British Triple Crown.
And it seems that American traders have adopted the saying. Americans are more likely to spend more time on vacation between Memorial Day and Labor Day.
2. Does “Sell in May And Go Away” Work?
And indeed, for over 50 years, the stock market performance supported the theory behind the strategy.
From 1950 to around 2013, the DOW has had an average return of only 0.3% during the six-month period from May to October period.
In comparison, the Dow had an average gain of 7.5% during the November to April period.
So it seems that “Sell in May and Go away” is a strategy that may have worked for many years.
But In recent times, it seems like the strategy has fallen out of favor.
Technical analysts at Merrill Lynch looked at historical data and found THIS out:
Looking at 3-month seasonal data going back to 1928, the June-August period typically is the second-best of the year, with gains 63% of the time, and an average return of 2.97%!
3. Should You Sell In May And Go Away?
With all this conflicting data, does it make sense to sell in May and go away?
Is this a good investment strategy?
You know me — I always say “Trade What You See And Not What You Think!”
Always look at the market data!
As an example, last year, between May 4th and August 31st, 2020, the Nasdaq rose 28% (refer to chart).
If you would have sold in May and "gone away," you would have missed out on these gains.
4. Two Reasons Not To Sell In May And What To Do Instead
Maybe it makes sense to sell in May and go away when you’re an investor.
MAYBE...
But as a short-term trader like me, May is a GREAT month to trade, and here’s why:
I like to trade The Wheel Strategy . With this trading strategy, you are selling option premiums.
And there are 2 factors that influence options premiums:
- Volatility
When volatility is high, option premiums are higher.
The Volatility Index VIX for the past few month, has been pretty low in March and April.
But now, in May 2021, it's spiking up again.
This means that options premiums are higher, which is perfect for a seller like me:
I can get more premium!
- Down Days
Step 1 of The Wheel Strategy is selling puts, and you get more premium for puts on “Down Days” for such strategies.
According to the NASDAQ , thus far, in May 2021, we had 7 “down days” and only 4 “up days."
On “down days," there are many more trading opportunities.
Last week, when the Dow Jones Industrial Average had its worst week since February, I made $3,722 in profits.
Here Are Some Of My Trades In May:
Let’s take a look at these trades in more detail:
- Trade #1: Snapchat SNAP
Snapchat recently had some rough weeks.
In less than 2 months, it traded from a high of 72.50 to around $50 where it found some support.
Most retail investors would stay away from a stock like this but I saw an opportunity to “buy it at a discount” :
I sold Puts with a strike price of 47 and an expiration of 4 days.
If SNAP closed below $47 on May 14 (the expiration date), I would have gotten assigned and bought SNAP for $47. I would consider that a bargain.
If SNAP closed above $47, I would have just kept the premium that I received for selling calls. In this case, that’s $525.
SNAP did close above $47 on May 14, and I collected $525 for 4 days of exposure in the stock market.
- Trade #2: Square SQ
Square looked very similar:
Mid-February, the stock made a high of $280, but then it retreated to $200.
Most market participants would not trade a stock like this, but looking back over a six-month period, I saw some good
support around the $200 — $203 level.
I sold 5 Puts with a strike price of 202.50 and an expiration date of May 14th.
I received $100 in premium for each put, so I collected $500 in premium.
On May 14, SQ closed above $202.50, and I made $500 in only 4 days. That’s a very nice return.
- Other Trades I Took
I sold 119 Puts on Apple , sold 212.50 Puts on Boeing ,
And I sold 39.50 Puts on Dave & Busters .
All of these stocks have lost in value over the past few months.
Investors who follow a ‘buy-and-hold approach” would lose money in this scenario, but as an active investor, I can apply
trading strategies that make money even if the stock is going sideways or even moving lower.
Summary
“Sell in May and go away” is an old Wall Street adage that might be useful for buy-and-hold investors.
But active investors like me are always on the lookout for trading opportunities.
And with the right trading strategy, the increased volatility combined with markets that are moving lower is a dream come true.
You need to have the right trading strategy.
I personally like to use the PowerX Strategy for markets that are trending, and I trade The Wheel Strategy in
choppy market conditions as we experience right now.
With such a strategy, I am able to make money even if the stock is going sideways or lower.
I for one will NOT sell in May and go away!

Option strategy buy Straddle / StrangleIn this post, I will start from the example and then write the definitions.
Our example will be on Boeing (BA), a hypothetical analysis might be that BA was trading sideways for more than half a year. Previous to that BA was down in price for more than 50%, also there was a rally of 100% between May and June. The volatility in the markets starting to rise, due to Covid-19, election, lockdowns, blue or red waves, vaccines, other news, etc. The trader expects a large move but doesn’t sure in which direction. Also, the rise in volatility enters into consideration, by our trader.
The trader search for a strategy that can be profitable in any direction and a rise in volatility will benefit him.
Straddle buying
A straddle purchase consists of buying both calls and puts with the same stock, option striking price, and expiration date. The straddle purchase allows the buyer of the options to make large potential profits if the stock moves far enough in either direction. The strategy has a limited loss and theoretically unlimited profit.
Buying a straddle should be done on stocks that have the potential to be volatile, this strategy is even more attractive if the options premiums are relatively low, which makes the straddle cost less and if the volatility will rise the buyer will profit much quicker. In general, the probability if held to expiration is near ~40%.
Most of the traders don’t wait till expiration. The options are At the money.
The example on the chart:
Blue lines – profit lines, yellow lines – break-even, red lines – 50% of maximum loss reached. Red zone – in this area the strategy losses money.
The options are from 30/10/2020 close in BA.
The strategy bought for -> 47.35, meaning a debit is being paid.
Stock price-> 144 , Upper strike (call)-> 140, Lower strike (put)-> 140
Days-> 203, Impleid volatility-> 54.4% (0.544), date-> 30/10/2020
The maximum loss is the debit paid for the strategy, in this case, $4735, the chance to lose all of it is less than 1%, the price needs to finish at expiration exactly at the strike price of the options $140, which means all the options will be worthless.
If the price will finish exactly at $163.69 a loss of 50% of the debit paid will occur, the puts will be worthless but the calls still have some value, but less value than the debit paid. If the price will finish exactly at $116.33 the trader will also lose 50% from the debit, but now the calls are worthless and the puts have value.
If the price will finish between $116.33-$163.69, a loss of 50%-100% from the maximum profit will be realized.
The prices of $92.65 and $187.35 represent the prices at which the strategy will break-even. At the lower price, the calls will be worthless and the puts will have value, at the higher price the other way around.
Those prices can be calculated:
Upper break-even point -> the strike price + the debit paid = 140+47.35=187.35
Lower break-even point -> the strike price - the debit paid = 140-47.35=92.65
The strategy presented on the chart has 147 days, before starting to lose 50% of the maximum loss (Debit paid).
If at any point the stock price will reach the dark blue line the strategy will profit $4735 if the light blue line will be reached the profit will be $9470.
How implied volatility affects the position? (20% increase and decrease)
20% IV increase -The buyer wants the implied volatility to increase, the strategy will start profit much sooner. The purple zone is the new loss area, the new area is much smaller than the previous one. The break-even lines are much closer to the end date and each other. It will take more time to reach the 50% loss lines 173 days instead of 147 days.
20% IV decrease – If the implied volatility will decrease, the purple loss zone will grow substantially, the break-even lines will go farther from one another and the 50% loss line could be reached much sooner, 63 days instead of 147.
Strangle Buying
A strangle is a strategy that uses both calls and puts, which have the same expiration date, but different striking prices. The difference between a strangle and a straddle is that the options are now Out of the money, because of that the strangle cost less than the straddle.
The example on the new chart:
Blue lines – profit lines, yellow lines – break-even, purple lines – 50% of maximum loss reached. Red zone – in this area the strategy losses money.
The options are from 30/10/2020 close in BA.
The strategy bought for -> 23.95, meaning a debit is being paid.
Stock price-> 144 , Upper strike (call)-> 190, Lower strike (put)-> 125
Days-> 203, Impleid volatility-> 54.4% (0.544), date-> 30/10/2020
Those options were chosen because they have a Delta of 0.3
The maximum loss is (-$2395) if the price will be at expiration between the strikes 125-190, the strategy will lose all the debit. (Broken red lines)
The other lines are the same concept as the straddle and their outcome is shown on the chart.
The break-even point calculation at expiration:
Upper break-even point -> the upper strike price + the debit paid = 190+23.95=213.95
Lower break-even point -> the lower strike price - the debit paid = 125-23.95=101.05
The strangle presented on the chart has 101 days, before starting to lose 50% of the maximum loss (Debit paid).
The increase and decrease in volatility will have the same effects, thus in the buyer analysis will anticipate an increase in volatility.
This post is related to previous posts.
You can come back and see what will happen with this particular example.
If you have any questions, please ask.

HCL TechSwing long recommended ---> stock is at good support @ 900 Tgt of 930 -> 980 -> 1000
NO Stoploss great stock ..--> keep in holding also Special option strategy can be deployed
+1 * 880CE
-2 * 910CE
+1 * 1010CE
-1 * 1030CE
+1 * HCLtech Futures
this at good price will give a downside profit of 1800 but will capped profit to 21K

Stock Market Crash May 2021 Today, we’re going to talk about whether or not the stock market going to crash in May 2021, because for the past few weeks, the market has gone down depending on what index you’re looking at.
So today we’re going to deep dive into this. Is the market going to crash? What is happening with cryptocurrency? What would happen to your portfolio if the market crashes, and how can you protect yourself from this?
What you see looking at the Nasdaq, over the past three days, it has been gone down. Selling seems to have been accelerated so far today.
The NDX TVC:NDX is for today, at the time of this writing on May 13th, 2021, still up a little bit, but is the market going to crash? How can you protect yourself, and what will happen to our wheel positions if the market is crashing?
That’s what we’re going to talk about today. And I thought in order to do this, it would be fun to bring on another expert. The expert that I want to bring on is my head coach, Mark Hodge.
What’s Happening In The Markets?
Markus Heitkoetter: So the Dow Jones has been making new all-time highs for quite some time right now, but then two days ago, and yesterday, it plummeted down. It was the worst day since January or something like this?
Mark Hodge: I believe so.
Markus Heitkoetter: But the Dow is only part of the picture. I think what most people are concerned about are these growth stocks. The Nasdaq had quite a significant drop, and people who are in, for example, invested in TSLA, SQ, or in any of these growth stocks, have seen these growth stocks have taken a beating over the past few weeks.
Mark Hodge: Right now, this is what’s known as sector rotation. Sector rotation is when everything is going great, interest rates are low, people are bullish, people are willing to put their money in more aggressive stocks for future growth.
Stocks that you would imagine have higher future earnings and have the potential to grow faster, even though they might not be even showing profits right now. So that’s where the money is going.
Now, when you talk about inflation concerns and you talk about higher interest rates, that’s when people get more cautious, and that’s where the blue chips, or the value stocks, become more attractive because people are worried about future profits getting eaten up by higher costs and higher interest rates with these growth stocks.
That’s why the Nasdaq stocks and tech stocks are taking a bit of a hit, but as you mentioned, the Dow was sitting at record highs just last week.
Markus Heitkoetter: I just want to put it in perspective a little bit. According to a weekly chart of the Nasdaq, with the drop that we had yesterday, we are down 8.4%. So around eight and a half percent. This is something that we saw also in March.
In March the markets went down by 12.5%, and we have almost forgotten this now. First of all, a true correction in the market is defined as 10% or more.
So at 8.4%, we’re not even there yet, but let’s take a look at a few other drops that we had earlier this year here.
There was another 12% drop, a 14% drop, and then, of course, last year, this is where everybody got super spooked during the Covid drop, right? This is when the Nasdaq actually dropped 30 percent.
But I mean, things like this happen in the markets all the time. It is absolutely normal. So will we, right now, see a 30 percent drop? Even if we do, so what?
If we were to look even further back we would see these retracements happening all the time. July 2019, we also had a 9% drop in the Nasdaq.
Before that going back to April/May in 2019, we had a drop of 12%. Towards the end of 2018, it’s so long ago, we almost don’t remember anymore, but we actually had to drop off almost 24%.
We have these healthy drops all the time and they need to happen, right Mark?
Mark Hodge: Exactly, and I mean, that’s a good point, Marcus. It’s healthy for the market to pull back, to retrace, and it does create a buying opportunity. So a 10 percent retracement or correction is normal. Now a 20% drop is a bigger deal.
The 30% drop that we saw with the pandemic, was a big deal. You know, that’s where people are getting fearful and they’re pulling money out of the market, but right now, people aren’t pulling money out of the market.
Money might be going into blue chips and then people might be seeing a buying opportunity in tech, but it’s definitely not the same thing, at least at this point.
Where Does The Money Go?
Markus Heitkoetter: You know what, Mark? Let’s actually talk about “buy the dip,” what it means and why it exists. First of all, money doesn’t disappear.
You see after we see a run-up, or even when the markets are making new all-time highs, traders who bought at this point are eventually going to sell at some point and take profits.
Now, what happens when you’re taking profits? Money is being deposited into your account. The key question is, what do you do now with this cash? That’s where we have kind of the Holy Trinity, where we have, on the one hand, money market accounts.
This could be like CDs or something like this where we are earning interest rates. So this is one way where you can put money in it. Mark, what is the interest that you are getting, 0.1% or 0.15%?
Mark Hodge: Not much, say just say zero.
Markus Heitkoetter: Then, of course, you have the stock market that you can invest in.
So the stock market is another way where you can put money in, and then finally, you also have real estate. So this is where we have this holy trinity. So money is not just sitting in cash because I mean, cash is trash, right?
You might have heard about this, and since right now in the money market accounts, you’re not getting any interest, this is why a lot of money is right now flowing into the stock market.
But then at some point, you are taking profits. When you’re taking profits, what do you do now? The real estate market is super hot. I mean, Mark, we talked about it the other day.
I mean, houses are going on the market, and within a day or two, they’re being snapped up.
So it is clearly right now a seller’s market, and in a seller’s market, you don’t want to be a buyer.
I invest in real estate, and right now I don’t want to be a buyer. Mark, you had an example of something that happened in your neighborhood, right?
Mark Hodge: Yeah, in Sacramento. It was, I think about a month ago, I believe it was 122 offers on just the normal three-bedroom, two-bathroom house in one weekend with multiple offers over the asking price.
I want to say they haven’t turned down a $500,000 offer because they wanted to extend the whole process. But anyway, real estate, it’s crazy right now. Marcus, I mean, you were looking at even buying a resort.
Markus Heitkoetter: You can’t buy a resort right now if you wanted to. I mean, I’m trying to buy an apartment complex, and you can’t, I mean, it’s crazy the prices they’re asking for them.
The other thing that is interesting is that the stock market and the real estate market, both historically just go one way, and that’s up.
Now, what about interest rates? Interest rates, on the other hand, fluctuate and they stay in a range. Remember the time when we had 10% interest rates? Nine% was this in the 90s? Mark, do you remember?
Mark Hodge: I believe it was before the 90s. I think it was more the 80s. It’s been a while.
Markus Heitkoetter: So it has been quite a while, and right now there’s not much money in cash. So it is fluctuating between the stock market and the real estate market, and it is not really that interesting right now.
If you were to look at a monthly chart of the Nasdaq, one thing that you see in the stock market is it is constantly going up.
Now, in between, there are a lot of little dips, and those are absolutely healthy. Those are happening when there’s profit-taking.
What Causes The Market To Crash?
This is why in the long run it has paid off to invest in stocks long term. So why, besides the profit-taking, do we have these dips? Why could the market crash and why could we possibly see a market crash now in May? Right.
So the two reasons why markets go down. Number one, there is just simply some profit-taking.
If a market is getting too hot, then profit needs to be taken out of the market. Now, number two is uncertainty. Traders don’t like uncertainty, and right now, we do have some uncertainty going on.
Let’s talk about the economic calendar. I want to bring up last week first. Last week, we had pretty bad news from the stock market. The unemployment rate actually jumped up from 5.8% to 6.1%.
That’s not good for the economy because when people talk about how is the economy doing, the one key indicator, Mark, is jobs. Right? When you say in an economy that is doing good, unemployment is low.
Last year when we had the pandemic starting, it was just going out like crazy, the unemployment rate and it was going down, down, down, but now it is going up. So one thing that traders are concerned about when it comes to the market is unemployment.
The other thing, Mark, and this is what has been spooking the investors this week is inflation.
So inflation is the next spooky thing. And inflation, the Fed has a target of 2%. What does it mean a year over year? We are OK with prices going up by 2%. Now Mark, let me ask you, how does the Fed control inflation?
Mark Hodge: With interest rates.
Markus Heitkoetter: Right, Interest rates. So what the Fed does is if inflation gets high, are they start raising interest rates and therefore inflation usually goes down again.
This is the tricky part because we need interest rates low because low-interest rates are leading to jobs.
How do low-interest rates lead to more jobs? You see, this is why we are talking about this today. I think it is super important that you understand a little bit of what’s behind the market so that you don’t panic when you see the market going down for two days in a row, and dropping maybe 8% in a week or two.
How do low-interest rates create more jobs? Well, first of all, lower interest rates allow companies to borrow money cheaply for expansion.
So today, everything is pretty much in the green. Growth stocks are usually in the Nasdaq, while value stocks are more in the Dow.
So especially these growth stocks, how do you grow a company? By borrowing money. And as long as interest rates are low, it is easy to borrow money and to grow to have healthy profit margins.
Now, if interest rates start rising, this is increasing your costs, and when the costs are increasing, it means that profits are decreasing.
This is the point and this is what it all boils down to. So it’s Interesting for you to see how this all ties together.
What Do We Do When The Market Goes Down?
Now the question is “what do we do when the market is going down like this?” I mean, Mark, we have several trading strategies, and one of the trading strategies that we would really like to trade is The Wheel strategy.
So what do you do when it is going down?
Mark Hodge: One of the benefits to the market falling is that when the market is dropping or there’s uncertainty in the market, then that means that options are getting more expensive.
So options are derivative and they are based on stock prices, and when the market is just kind of going up, things are complacent. Nobody’s worrying about options.
Prices are cheaper, but when there’s uncertainty, they expand, they get bigger, which means that we get to collect more premium.
So, I mean, that’s what we are doing this week. We are selling options on some stocks that we liked and that took advantage of the opportunity, took advantage of the drop.
Markus Heitkoetter: Absolutely. So a few puts that we sold is, for example, AAPL. We sold the 119 put, and this was just perfect. We got a lot of premium for it on the way down.
So this is one of the trades that we did. Another trade that we took was Boeing, (BA). So Boeing here also really a good trade as Boeing comes down, and especially over the past few days as we had the dip.
This is when we can make a lot of money selling options.
We sold the strike price of 217.5. So if Boeing stays above $217.50, we just keep the premium. Otherwise, we are getting assigned.
So then we have of course LVS. (LVS) is actually one of the stocks where we were assigned, so we bought it at $58.
Right now it is trading at $56.17, and we were able here now to sell calls. So this is what we did earlier this week.
We sold a call with the strike price of 59, and we were able to buy this back today.
So if you know how to play the markets, it is actually a good thing when the markets are going down because this is when you can pick up some really nice stocks.
We also picked up (SNAP) and again, Snapchat was going down. So therefore we picked up the put. We sold this with the strike price of 47 expiring tomorrow (March 14th, 2021).
Right now, it is trading at $51. So this is great.
And then we also had (SQ) is pretty interesting because it really seems to be bound to bitcoin here and BTC right now is tanking.
Mark Hodge: Yeah, this one does some exposure to Bitcoin. I think it was like one hundred and fifty million or something like that, I mean not the one point five billion that Tesla bought, but they have some bitcoin exposure.
So the lows today that were established with SQ were lockstep, the same move that Bitcoin saw.
Markus Heitkoetter: Yeah, absolutely. So this is where trading The Wheel strategy when the market is going down, as it is right now when others are taking profits and selling.
This is when we go on a shopping spree. This is what we have been doing this week.
We just sold puts this week. Then based on what the stock price does, you might or might not get assigned. If you do get assigned then you are selling calls.
Summary
Markus Heitkoetter: I mean, this is just a strategy that we like to trade. It’s not for everybody.
Because while you have these stocks, you can experience a drawdown in your account so you can have a huge unrealized loss.
For example. (RIDE) is a stock that I was wrong about. So I sold the 21.50 and this is where I got assigned.
RIDE keeps going down. So right now (March 13th) it is trading at a little bit less than $7. Now I was able to lower my cost basis to $15.23.
I actually was able to collect premium of more than $9,000, which is lowering my cost basis to a break-even of around $14.30, but as you can see I’m still underwater water.
So what you need during these times, it’s of course nicer when you have the index because the index is bouncing back fairly quick.
Again, you see how many weeks does it take after a drawdown before it bounces? One, two, three, four?
When we had this huge, massive drop because of Covid, it took us 11 to 12 weeks. That’s only three months here. Often see this also in stocks.
So the question is, should we be concerned about a crash? First of all, having a retracement here? This is not even a correction. Having a retracement of 8% is nothing.
I mean, unless we start seeing something like we had 10 or 15 percent or 12 percent or 12 percent, or if you are going back in time, if you are going before the covid drop where we had, what, 24%?
This is when we are selling puts and by doing so we are getting paid for selling points and as the market bounces back up, we are buying it back.
And if we are in a stock, we start selling calls. So having a down market mark, for me that’s not scary. It’s a matter of can you deal with it? And yes, as a trader, you need to have a stomach for this.
I mean, it is not for everybody, right? I mean, this is where we are going back to the Holy Trinity.
If this is not for you, these fluctuations, then consider money market accounts. I mean, right now, you’re not making a lot of money there, but this is where you can’t lose money. Well, you kind of do because of inflation.

JETS ETF Bullish inclined naked Puts - 16 Apr ExpiryThis Month I will only be entering a primary trade.
As the Primary trade, this is aligned to the larger market direction and is deemed less risky. I'm bullish inclined for JETS as it is considered one of the COVID19 recovery sectors. The strike is also at a resistance point of the range. Entering at 0.3 would have been my preference but I was too late to get that price as I was wrapped in the previous JETS trade.
I need another JETS as I'm over-reliant on this for the past 1 year.
Sold 365 Puts @ 0.23 Strike 24
BP Block: 94K
Max Gain: Est $8,395
Touch Probability: 29%
% Distance to Strike: 14%
Wish me luck!

XRT ETF Bullish inclined Naked Puts 14 May ExpiryI am diversifying beyond selling puts on JETS as it seems to have had a significant bullish run.
XRT is an ETF reflecting the US retail industry, specifically the Consumer Discretionary segment. I selected them because with the pandemic optimism and the decreasing unemployment, I expect the customers to be less tight on their retail habits especially on everyday items.
etfdb.com
Sold 50 Puts @ 0.78 Strike 83
BP Block: 51K
Max Gain: Est $3,900
Touch Probability: 62%
% Distance to Strike: 8%

VXX Calls - 14 May ExpiryThis is the second part of my May trade and I attempt to break up my holdings.
VXX is based on the volatility index and is an inverse reflection of the S&P500. Currently, the market is pretty bullish and I expect it to continue at least for the next month. My strategy is to not go for the high-risk, high-reward trades. But steady high probably trades that I can compound on.
My 20k loss in Feb, showed me that for my strategy, its better to cut my losses fast and small if I get a hint that things are not panning out. As a small loss is easier and faster to gain back especially since I structure my trades monthly. A huge loss just means more months required to paying back...
My strike is also pretty far away and should be well padded.
Sold 130 Calls @ 0.25 Strike 17
BP Block: 37K
Max Gain: Est $3,250
% Distance to Strike: 74%
ATR is also low which means volatility is pretty passive

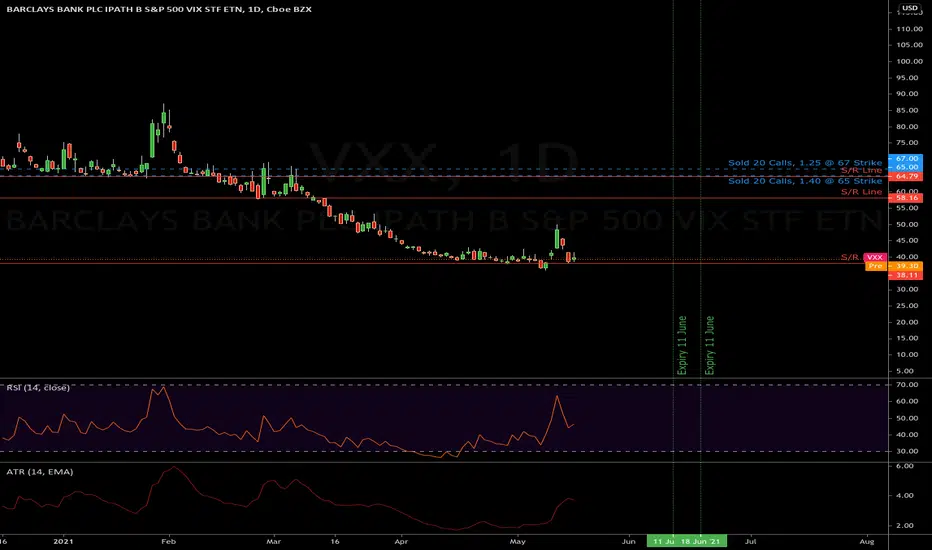
VXX Sold Calls - 11 June & 18 June ExpiryVXX is based on the volatility index and is an inverse reflection of the S&P500 . Currently, the market has returned to it's bullish move especially after the bearish spike from inflation.
The US economy also seems to be strengthening. My big worry is if the IN variant hits the US and if it will have an impact on the market.
There are also good S/R lines to resist potential upside movement
Sold 50 Calls @ 1.4 Strike 65 - Expiry 11 June
Sold 50 Calls @ 1.25 Strike 67 - Expiry 18 June
BP Block: 50K
Max Gain: Est $5285.76
% Distance to Strike 65: 65%
% Distance to Strike 67: 70%
Strangle on Oil futuresThe oil price is going sideways at the moment. The implied volatility is relatively high. I choose a strangle with an 85% probability to finish in the green zone, between the $48-$69 prices in the next 41 days.
I have a follow-up action if the implied volatility will go higher or the price will move sharply up or down.
Always diversify your trades.

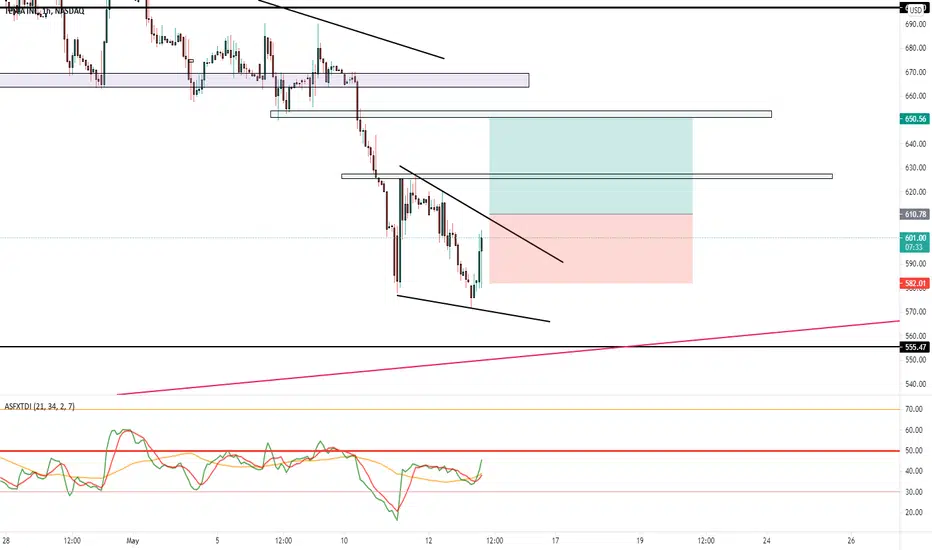
TSLA Falling wedgeTSLA has taken a hit off BTC news and the overall market weakness.
However, there is a lot of room to the upside with $650 as target.
SQ falling wedgeSQ has reacted off the $200 support level,
And formed a beautiful falling wedge, IF we manage to break out, we have room to an upside move as targets disclosed

Japanese Yen futures short call verticalPure TA.
Oversold territory, so take care of the trendline.
Max profit: $213
Probability of Profit: 72%
Profit Target relative to my Buying Power: 20%
Max loss with my risk management: ~$250
Req. Buy Power: $1038 (max loss without management at expiry, no way to let this happen!)
Tasty IVR: 34 (average at futures)
Expiry: 36 days
Sell 2 !6JM1 Jun4' 0.0093 Call
Buy 2 !6JM1 Jun4' 0.00935 Call
Credit Call spread for 0.90cr each
Stop/my risk management : Closing immediately if daily candle is closing BELOW the box, max loss in my calculations in this case could be 250$. Probability of loss in this way: ~20% .
Take profit strategy: 50% of max.profit in this case with auto sell order at 0.45db. Probability of profit this way: ~80%.
Of course I'll not wait until expiry in any case!
If you liked this article, check my other ideas.
Anyway: HIT THE LIKE BUTTON BELOW , and for fresh option ideas FOLLOW ME( @mrAnonymCrypto ) on tradingview !

GE - Long IdeaShowing some reaction off Demand Zone,
If we catch some momentum, we can break out of this descending pennant and move higher
