Don't Sleep On Apple! *This is not financial advice, so trade at your own risks*
*My team digs deep and finds stocks that are expected to perform well based off multiple confluences*
*Experienced traders understand the uphill battle in timing the market, so instead my team focuses mainly on risk management*
For weeks my team has been analyzing AAPL for long opportunities. The stock has been correcting for weeks after reaching its all-time-high of $145.09
The correction seems to be slowing down. AAPL seems fairly priced within the 123-126 range. My team is opening up positions in this range and plan to take profit 2-3 months from now at $160.
Kathie Woods dumped AAPL stock on 5/10/21, but Warren Buffet still holds it as his main offensive position. We believe that the ARK sell-off is non-related with the overall performance of AAPL going forward.
AAPL is also doing business into the gaming console industry by partnering with Sony Corp Groups PS5 game streaming service.
Options-trading

Banknifty should be in a overall overhaulingThere can be bit of upside in banknifty but a good R:R for a SHORT entry is to be realized.

Banknifty Weekly Expiry Range (futures data)We take three possibilities based on the type of opening. All expected to have same end result


TESLA BEAR FLAG|PREPARE TO SELL|OPTIONS TRADE|
TESLA is still growing after it gained momentum
On the news of being added to the S&P500
Usually, the stock falls right after being included into the index
Following the saying "buy the rumors, sell the news"
Though, in the case of S&P500 , more like "buy the news, sell the fact"
Anyhow, TESLA hasn't fallen , and is still growing.
However, the bear flag it is trading in
Indicated that the growth in its final stage
And the stock will soon collapse to the support
As it is obvious that a correction is needed
I think that there is still some space to go Up
But the correction is inevitable
A Short? YES, but with Put Options only , so that your downside is limited.
520-500$ as the final target seems quite reasonable for this trade
Like and subscribe to never miss a new idea!

MU Calls?This one is tough to chart due to it being very extended. My best guess on this one would be a break above 71.51 to further extend its ATH. It rejects, use 69.90 as a support, breaks below that, we could see 67.04

Banknifty Trading in the Zone October 1st weekBank nifty is trading with comforts to distribute sums . Now the much depends upon it to continue the trend or give whipsaws, as for the technicals market has kept bearish view even though a more U shaped recovery to say. However what we notice is that if the U shaped recovery was itself weak then BN would have weaker retracement .232 possibly. Thus a very reasonable target on upper side and more bias towards downward spiral. However we feel a sideways movement would be warranted for the coming week as a cooling off week.

AMZN - Amazon sell, end of the bull run?Amazon has been on a bull run for some time - we now have a sell signal on our strategy.
The entry price, SL and multiple TPs are shown on the chart.
Our back testing and money management strategy itself is holding until a reverse signal to ride a big trend, but as you will not see the next signal - manage the trade as you wish should you decide to enter.
What is our strategy?
Our strategy is a trend following strategy, can be used on any instrument and time frame. However, we have hard coded specific parameters for when trading the H1 time frame, so we can back up over 4200 previous trades to confirm our edge from previous data. This gives us confidence in execution and belief in our trading strategy for the long term.
The strategy simply sits in your trading view, so you will see exactly what we see - the trade, entry price, SL and multiple TPs (although we hold until opposite trade as this is the most profitable longer term plan), lot size, etc.
This could be on your phone trading view app, or laptop of course.
The hard work is done, so we have zero chart work time, no analysis, no time front of the chart doing technical analysis - technical analysis is very subjective - you may see different things at different times - how do you have a rigid trading plan on a H&S shoulder pattern? Your daily routine, diet, sleep, exercise can affect what you 'see' and your decision making, this doesn't happen when a strategy is coded like this; what we do have is a mechanical trading strategy...
What does this mean?
It means, we are very clear on our entry and our exit and use strict risk management (this is built in - put in your account size, set your risk in % or fixed amount and it will tell you what lot size to trade!) so we have no ego with our position and we are comfortable with all outcomes - its simply just another trade. This free's our mindset from worry and anxiety as we take confidence from knowing our edge is there and also that we have used sensible risk management.
The strategy itself can be used as a live trading journal too - how cool is that? The strategy will confirm and support every open and closed position - so its quite easy to follow.
We just have to do what Percy does.
Please see our related ideas below for more information to explain what we do and how it can help you.


Walmart MarkUpThis mark up is for a potential option trade on Walmart before they report earnings. I’m waiting to see if price will test that strong support that was marked on the monthly time frame. If I get my candle confirmations I’m in on the 08/21 $130 call for WMT!

APT 4HR outlook BUllishAPT target first TP $25. My overall TP is $27. we finally broke above $20. I am long

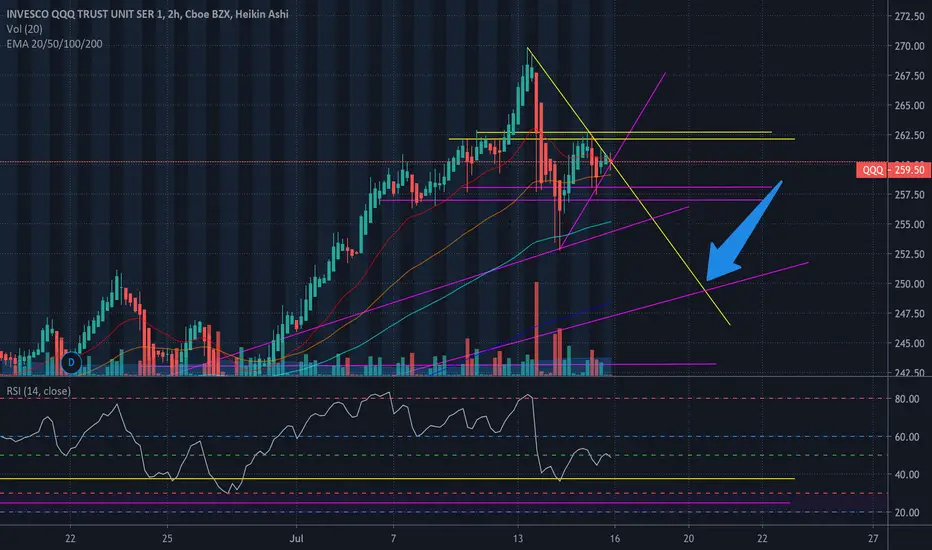
$QQQ Target 249.5 Target 249.50 or lower Check oui the chart analysis and follow along for more charts.
Bank Nifty Trading Strategy for 11th May'2020.I am bearish on BN until Bank Nifty holds above 20060 for an hour.
My downsize targets are 18500 / 17500 (levels are on the chart).
@@ Pivot Zone:- 19,475 - 19,597 Above +ve Below -ve
The rest of levels are on chart, enjoy trading.
#niftybank
#banknifty
#trading
#trader
#levels
#subhag
#subhagghosh


GOLD (XAUUSD): Multi-Timeframe Analysis & Trading Plan
Top-down analysis of gold.
Potential short opportunity and trading plan.
Please, support the idea with like and comment!
Thank you!

SIEMENS (SIE): Close To Buy Zone
3 years long bearish trend on siemens is considered to be broken according to technical rules.
the market has clearly broken above a resistance line of a bullish flag formation violating the last lower high.
now the market is retracing,
the underlined area around 100.0 level gives us a perfect opportunity to buy the stock on a good discount.
this zone is based on the perfect confluence of fib.levels and structure.
buying from that we can aim at 119.0 level as the initial target
and 132.0 as the second one.
good luck!

Natural Gas (NATGASUSD): Bullish Forecast
natgas has surely broken a strong horizontal resistance to the upside.
I believe that the price may now retrace a bit and then the bullish tendency will proceed
with potential continuation to 2.08 level - next structure resistance.
trading against the trend, control your risk with tight stops!
good luck!

Brent Oil Futures (BR1!) Catching Bearish Wave
Brent oil has reached a strong level of structure.
It is a combination of a daily structure and a recent gap open level.
+ 618 retracement of the major impulse
I will be waiting for a bearish breakout of the rising wedge pattern to short the market.
The initial target will be
56.2 level
Target 2
55
Target 3
54
Stop
58
*if the market respects support of the wedge and sets new higher high
setup will be invalid

Copper (XCUUSD): Wait For Breakout!!!
Copper is stuck on a key level as well.
2.61 is a decision level of the market and the reaction of the market participants matters.
in case of a bearish breakout of a small rising channel, I will short the market expecting a test of 2.54
in case of a bullish breakout of the underlined horizontal resistance, I will buy expecting a bullish continuation to 2.675
patience pays, friends!

Copper (XCUUSD): How To Trade Against The Trend???
trading against the trend is a tough thing,
but if it is executed correctly, it feels so good :)
copper is under strong bearish pressure.
during the last two weeks, the market has dropped significantly.
now it is finally trading within a strong area of support and I am looking for a counter-trend trade here.
thought, on a daily the market has perfectly stopped and we see some reversal clues,
I need a confirmation on a lower timeframe to execute a trade.
I will be looking for the completion of the right shoulder of a head and shoulders pattern,
to then buy the breakout of the horizontal neckline.
on the chart, I drew the list of conditions to be met to execute the trade.
The initial target will be 2.595
the second target can be extended to 2.7
Please, like the idea and leave a comment, if such kind of guides help you! thank you

S&P 500 Index: STEEL BALLS TRADE!!!
while everyone is buying the dips on major indexes,
let's go against the crowd and try to short the current market high on SPY.
DISCLAIMER:
steel balls are required for this trade
AKA trading on margin carries a high level of risk, and may not be suitable for all investors.
Trading Plan:
I have a sell limit on 3325 level.
Stop - 3350
T1 - 3292
T2 - 3242
(also, if the market reached T2, leave some minor part of the profit in free-floating just in case ...)
good luck!

SILVER (XAGUSD): Potential Long Trade
hey guys,
silver is standing on a strong support level for quite a while.
It looks like finally ice breaks and bulls are attempting to break above the indecision horizontal range.
for us, it will be a perfect signal to buy the market.
so let the price close above the range and buy the market expecting bullish continuation to higher levels:
18.2/18.4
