$MRNA, trading it 1/10For 1/10, intraday trading ideas for options; For red or green market day. #options #daytrading
Break over 222 (entry, long), it can see 232-237 (exit)
Break below 211 (entry, short), it can see 196-201 (exit), WATCH that ~205 area
Option Trading 101:
Risk what you can lose (0.5%-5%)
Watch buyers and sellers (their interactions & sentiment, ex. exhaustion of buying or selling, etc.) in strikes that you’re watching & the ticker too; this is how YOU manage YOUR trade.
Consider following and checking out bio and prior posts and recaps (on twitter), have a great one. Not financial advice.
Options

$NVAX, trading it 1/10For 1/10, intraday trading ideas for options; For red or green market day. #options #daytrading
Break over 135 (entry, long), it can see 144-148 (exit)
Break below 123 (entry, short), it can see 110-114 (exit), WATCH that ~119 area
Option Trading 101:
Risk what you can lose (0.5%-5%)
Watch buyers and sellers (their interactions & sentiment, ex. exhaustion of buying or selling, etc.) in strikes that you’re watching & the ticker too; this is how YOU manage YOUR trade.
Consider following and checking out bio and prior posts and recaps (on twitter), have a great one. Not financial advice.

Ford pullback idea SHORTFord pullback to trendline for potential gap fill with overbought RSI. NYSE:F

XOM Long PUT Play? 60 days out.Thoughts on Long Term PUT -60 days?
Reasons:
XOM did the same thing last year at this time. Huge jump in price action
3 gaps created on the daily
Extended away from the 8 ema
Last year it jumped 10 bucks before pulling back. If I look at the liner regression that is really close to being a 10 dollar move from top to bottom right now.

SPY IS STILL BULLISH FEDSYou can see there was an inverse head and shoulder with a rising neckline. This pattern indicated we were going to have a breakout to the upside. The feds however decided that they wanted to bring the interest rates up from 0. This broke the pattern and the support zone. In my opinion compared to the past the prices are holding on the trend line pretty well for being so close to a resistance zone. Give it a MONTH. we will be on a new ATH possibly a breakout. That or a complete crash. no in between! I'm staying bullish though.

Weekly Swing 30 point spreadAcross 7-8 day period Microsoft is at the bottom of RSI,MACD is showing slow down of buying pressure, zig zag swing high/low is changing direction to match bullish sentiment, Rising along and holding below moving average, looks as if it will cross over from bullish to bearish sentiment as well. All sign pointing at a reversal to the weekly resistance of 341 from the low of 313.
2 month call
2 contracts
340 call march 2022 exit at RSI REVERSAL 30 point spread

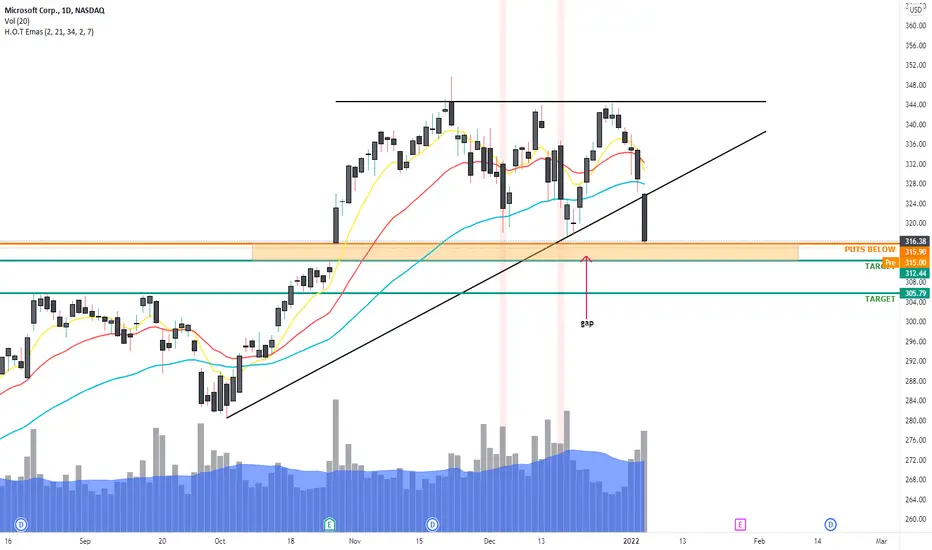
MSFT breaking to the downsideBig breakout candle on MSFT,
Just closed below the trendline on the ascending triangle.
Opening already below yesterday's low.
Might wait to see if it pushes higher at open and look for an opportunity to short it.
Also has a gap that can be filled
Entry: 315.90
Targets: 312.40 / 305.80
**Disclaimer: This is just a trading idea, not a financial advice**
$NVAX, trading it 1/7For 1/7, intraday trading ideas for options; For red or green market day. #options #daytrading
Break over 127 (entry, long), it can see 137-141 (exit)
Break below 118.5 (entry, short), it can see 104-108 (exit), WATCH that ~112 (Low Of Day) area
Option Trading 101:
Risk what you can lose (0.5%-5%)
Watch buyers and sellers (their interactions & sentiment, ex. exhaustion of buying or selling, etc.) in strikes that you’re watching & the ticker too; this is how YOU manage YOUR trade.
Consider following and checking out my prior posts & recaps (on twitter), have a great one. Not financial advice.

$MRNA, trading it 1/7For 1/7, intraday trading ideas for options; For red or green market day. #options #daytrading
Break over 222 (entry, long), it can see 234-239 (exit)
Break below 209 (entry, short), it can see 192-197 (exit), WATCH that ~205 (Low Of Day) area
Option Trading 101:
Risk what you can lose (0.5%-5%)
Watch buyers and sellers (their interactions & sentiment, ex. exhaustion of buying or selling, etc.) in strikes that you’re watching & the ticker too; this is how YOU manage YOUR trade.
Consider following and checking out my prior posts & recaps (on twitter), have a great one. Not financial advice.

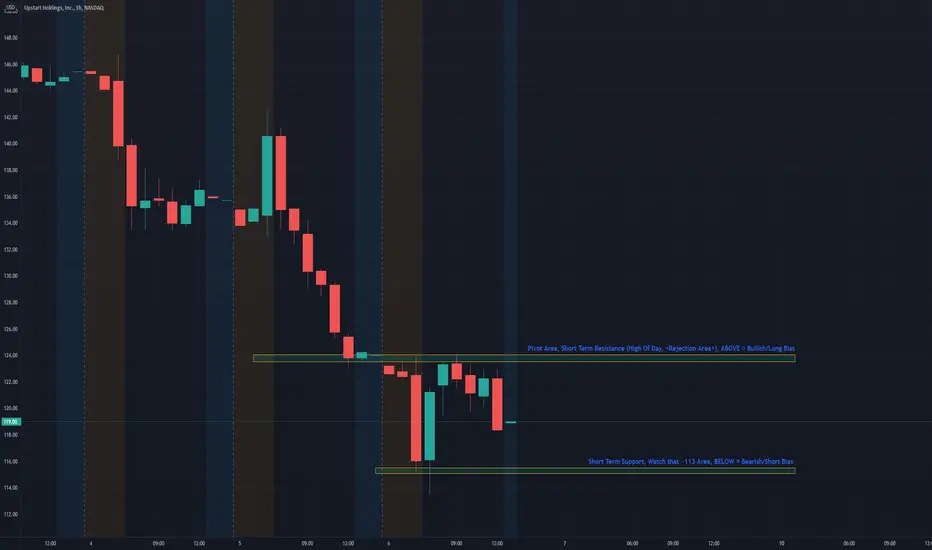
$UPST, trading it 1/7For 1/7, intraday trading ideas for options; For red or green market day. #options #daytrading
Break over 124.5 (entry, long), it can see 133-137 (exit)
Break below 115 (entry, short), it can see 103-107 (exit), WATCH that ~113 (Low Of Day) area
Option Trading 101:
Risk what you can lose (0.5%-5%)
Watch buyers and sellers (their interactions & sentiment, ex. exhaustion of buying or selling, etc.) in strikes that you’re watching & the ticker too; this is how YOU manage YOUR trade.
Consider following and checking out my prior posts & recaps (on twitter), have a great one. Not financial advice.
$NVDA, trading it 1/7For 1/7, intraday trading ideas for options; For red or green market day. #options #daytrading
Break over 286 (entry, long), it can see 294-298 (exit)
Break below 274 (entry, short), it can see 262-266 (exit), WATCH that ~270 (Low Of Day) area
Option Trading 101:
Risk what you can lose (0.5%-5%)
Watch buyers and sellers (their interactions & sentiment, ex. exhaustion of buying or selling, etc.) in strikes that you’re watching & the ticker too; this is how YOU manage YOUR trade.
Consider following and checking out my prior posts & recaps (on twitter), have a great one. Not financial advice.

$COIN, trading it 1/7For 1/7, intraday trading ideas for options; For red or green market day. #options #daytrading
Break over 237.5 (entry, long), it can see 246-250 (exit)
Break below 227 (entry, short), it can see 215-220 (exit), WATCH that ~225 (Low Of Day) area
Option Trading 101:
Risk what you can lose (0.5%-5%)
Watch buyers and sellers (their interactions & sentiment, ex. exhaustion of buying or selling, etc.) in strikes that you’re watching & the ticker too; this is how YOU manage YOUR trade.
Consider following and checking out my prior posts & recaps (on twitter), have a great one. Not financial advice.

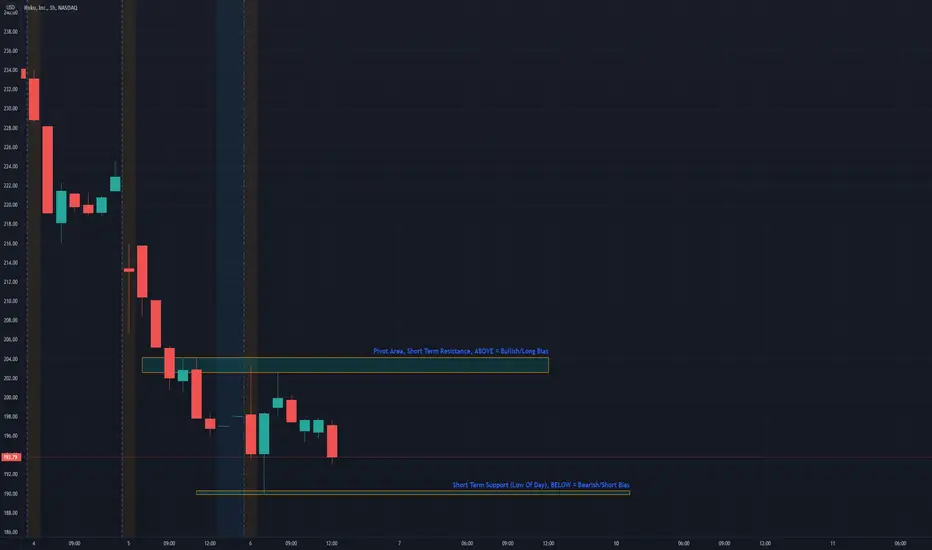
$ROKU, trading it 1/7For 1/7, intraday trading ideas for options; For red or green market day. #options #daytrading
Break over 204.5 (entry, long), it can see 213-217 (exit)
Break below 189.5 (entry, short), it can see 176-181 (exit)
Option Trading 101:
Risk what you can lose (0.5%-5%)
Watch buyers and sellers (their interactions & sentiment, ex. exhaustion of buying or selling, etc.) in strikes that you’re watching & the ticker too; this is how YOU manage YOUR trade.
Consider following and checking out my prior posts & recaps (on twitter), have a great one. Not financial advice.
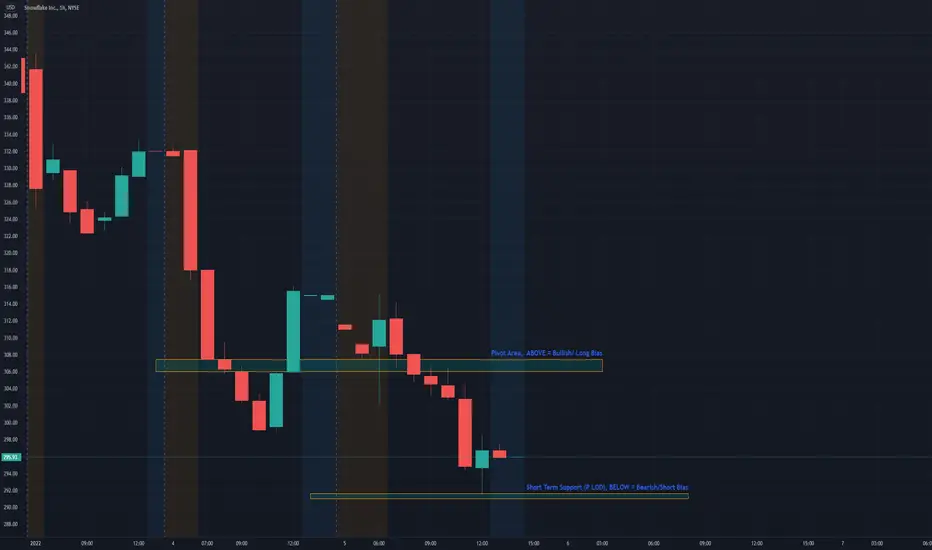
$SNOW, trading it 1/7For 1/7, intraday trading ideas for options; For red or green market day. #options #daytrading
Break over 307 (entry, long), it can see 319-324 (exit)
Break below 291 (entry, short), it can see 274-279 (exit), WATCH THAT 286 area (Previous Day Low)
Option Trading 101:
Risk what you can lose (0.5%-5%)
Watch buyers and sellers (their interactions & sentiment, ex. exhaustion of buying or selling, etc.) in strikes that you’re watching & the ticker too; this is how YOU manage YOUR trade.
Consider following and checking out my prior posts & recaps (on twitter), have a great one. Not financial advice.

$TSLA, trading it 1/7For 1/7, intraday trading ideas for options; For red or green market day. #options #daytrading
Break over 1089 (entry, long), it can see 1124-1140 (exit)
Break below 1040 (entry, short), it can see 989-1005 (exit), WATCH THAT 1020 area (Previous Day Low)
Option Trading 101:
Risk what you can lose (0.5%-5%)
Watch buyers and sellers (their interactions & sentiment, ex. exhaustion of buying or selling, etc.) in strikes that you’re watching & the ticker too; this is how YOU manage YOUR trade.
Consider following and checking out my prior posts & recaps (on twitter), have a great one. Not financial advice.

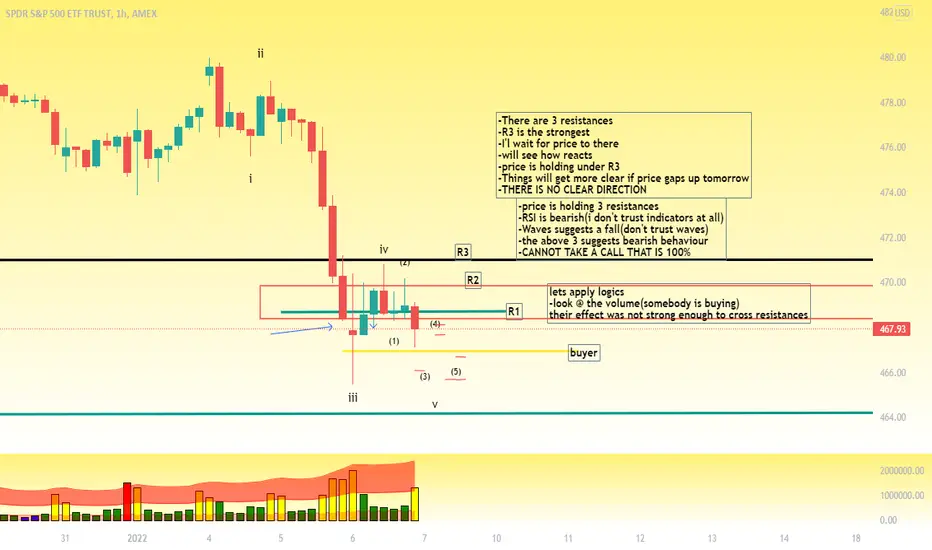
SPY -not a clear directionI don't see a clear direction with SPY.
I am \bearish for now as mentioned in the notes.
Read notes inside chart and if you do like my analysis plz like &follow .
$UPST, trading it 1/6For 1/6, intraday trading ideas for options; For red or green market day. #options #daytrading
Break over 133.5 (entry, long), it can see 141.5-145 (exit)
Break below 123 (entry, short), it can see 111.5-115 (exit)
Option Trading 101:
Risk what you can lose (0.5%-5%)
Watch buyers and sellers (their interactions & sentiment, ex. exhaustion of buying or selling, etc.) in strikes that you’re watching & the ticker too; this is how YOU manage YOUR trade.
Consider following and checking out my prior posts & recaps (on twitter), have a great one. Not financial advice.

$COIN, trading it 1/6For 1/6, intraday trading ideas for options; For red or green market day. #options #daytrading
Break over 244 (entry, long), it can see 252-256 (exit)
Break below 232 (entry, short), it can see 220-224 (exit)
Option Trading 101:
Risk what you can lose (0.5%-5%)
Watch buyers and sellers (their interactions & sentiment, ex. exhaustion of buying or selling, etc.) in strikes that you’re watching & the ticker too; this is how YOU manage YOUR trade.
Consider following and checking out prior posts & recaps (on twitter), have a great one. Not financial advice.

$SNOW, trading it 1/6For 1/6, intraday trading ideas for options; For red or green market day. #options #daytrading
Break over 307.5 (entry, long), it can see 317.5-323.5 (exit)
Break below 291 (entry, short), it can see 275-280 (exit)
Option Trading 101:
Risk what you can lose (0.5%-5%)
Watch buyers and sellers (their interactions & sentiment, ex. exhaustion of buying or selling, etc.) in strikes that you’re watching & the ticker too; this is how YOU manage YOUR trade.
Consider following and checking out my prior posts & recaps (on twitter), have a great one. Not financial advice.
spy put -intrad day for jan 6-2022 ONLYif you do enter to take a put
SL is mentioned
intra-day play,not keeping anything for tomorrow
Pt is mentioned

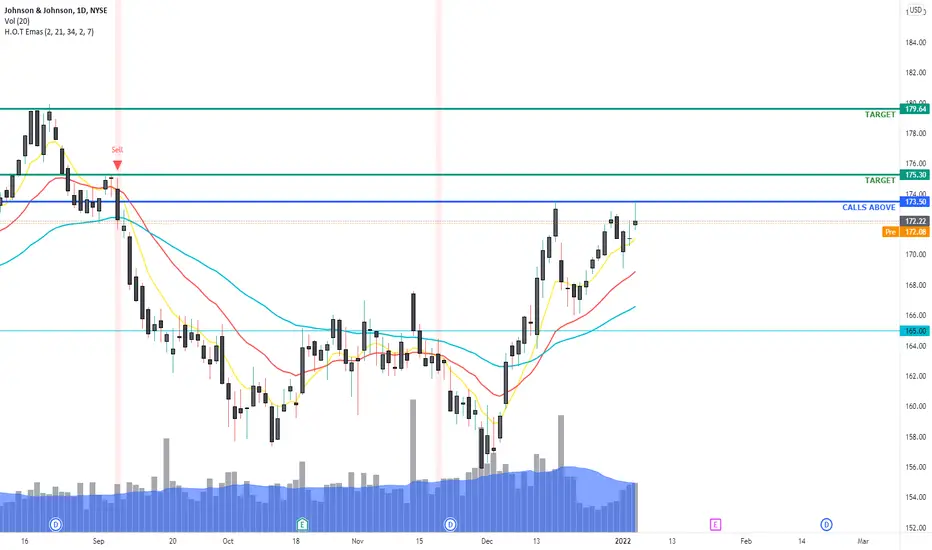
JNJ ideaIf we keep seeing rotation into value, JNJ is a good pick imo
Entry: 173.50
Target: 175.30 / 179.65
***Disclaimer: This is just a trading idea, not a financial advise***
$UPST, trading it 1/5For 1/5, intraday trading ideas for options; For red or green market day. #options #daytrading
Break over 141 (entry, long), it can see 149-152 (exit)
Break below 133 (entry, short), it can see 122-125 (exit)
Option Trading 101:
Risk what you can lose (0.5%-5%)
Watch buyers and sellers (their interactions & sentiment, ex. exhaustion of buying or selling, etc.) in strikes that you’re watching & the ticker too; this is how YOU manage YOUR trade.
Consider following and checking out my prior posts, have a great one. Not financial advice.

$COIN, trading it 1/5For 1/5, intraday trading ideas for options; For red or green market day. #options #daytrading
Break over 252 (entry, long), it can see 259-263 (exit)
Break below 244 (entry, short), it can see 233-237 (exit)
Option Trading 101:
Risk what you can lose (0.5%-5%)
Watch buyers and sellers (their interactions & sentiment, ex. exhaustion of buying or selling, etc.) in strikes that you’re watching & the ticker too; this is how YOU manage YOUR trade.
Consider following and checking out my prior posts, have a great one. Not financial advice.
